e& (Etisalat): revenue grows, but profit and cash flow diverge
25 августа e& (Etisalat) раскрыла результаты за второй квартал 2026 года: выручка выросла на 6,4% год к году, до 19 203,7 млн AED, чистая прибыль снизилась на 10,1%, до 3 121,1 млн AED, а операционный денежный поток ушёл в минус на 2 332,5 млн AED. При текущей цене акция выглядит непривлекательно: мультипликаторы выше собственной истории, а модель портала оценивает потенциал снижения в 46%.
Key takeaways
— Revenue in Q2 grew 6.4% — the slowest pace in five quarters
— Net profit fell 10.1% on higher costs and weak cash flow
— Operating cash flow turned negative — minus 2,332.5 million AED in the quarter
— Debt rose to 36,161.2 million AED, but debt-to-EBITDA over 12 months stands at 1.31
— Dividend yield is below historical levels, and payouts are in question due to weak cash flow
— The portal's model implies a 46% downside from the current price
Attractiveness
Key figures, AED bn
| Metric | Q2 2025 | Q2 2026 | Change |
|---|---|---|---|
| Revenue | 18.0 | 19.2 | +6.4% |
| EBITDA | 7.82 | — | — |
| Operating profit | 5.50 | 6.22 | +13.0% |
| Net profit | 3.47 | 3.12 | -10.1% |
| Operating cash flow | 1.58 | -2.33 | -247.3% |
| Capex | 1.56 | — | — |
| EBITDA margin | 43.3% | — | — |
| Net margin | 19.2% | 16.3% | -2.9 pp |
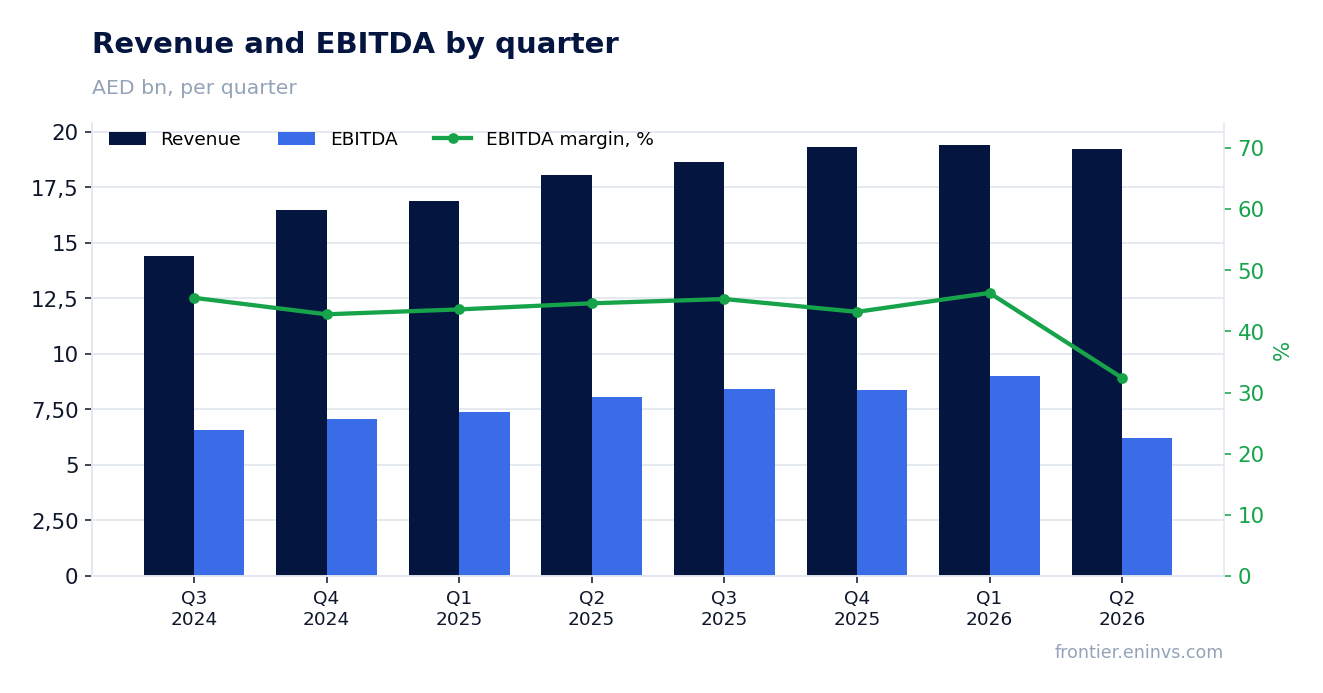
Revenue in Q2 grew 6.4% — the slowest pace in five quarters
In Q2 2026, e& (Etisalat) revenue reached 19,203.7 million AED, up 6.4% year-on-year. This is a marked slowdown from previous quarters: in Q1 2026 growth was 15.1%, and in Q2 2025 it was 28.1%. Still, over the last 12 months revenue reached 76,600.0 million AED.
The slowdown may reflect market saturation or intensifying competition, but the report lacks details on drivers. The key point is that the company continues to grow, albeit more slowly than before.
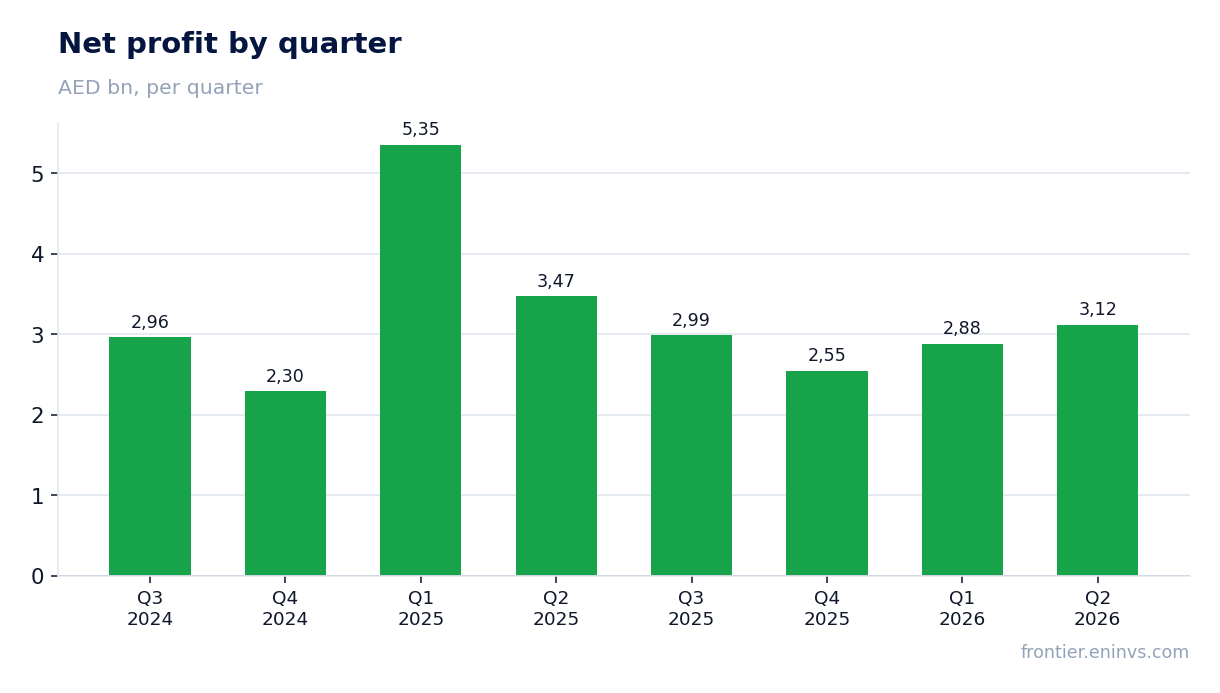
Net profit fell 10.1% on higher costs and weak cash flow
Net profit in Q2 2026 was 3,121.1 million AED versus 3,472.3 million AED a year earlier — a decline of 10.1%. Net margin narrowed to 16.3% from 19.2% in the same period last year.
Operating profit rose to 6,218.7 million AED, but that did not save the bottom line. Judging by the dynamics, higher costs or one-off items ate into profit, but the exact reasons are not disclosed in the report.
Operating cash flow turned negative — minus 2,332.5 million AED in the quarter
In Q2 2026, operating cash flow was minus 2,332.5 million AED. This is a sharp deterioration from positive values in previous quarters: in Q1 2026 it was 7,594.5 million AED, and a year earlier — 1,583.5 million AED.
Negative operating cash flow means the company did not generate enough cash from core operations to cover current expenses. Capex for the quarter is not disclosed, complicating the assessment of free cash flow.
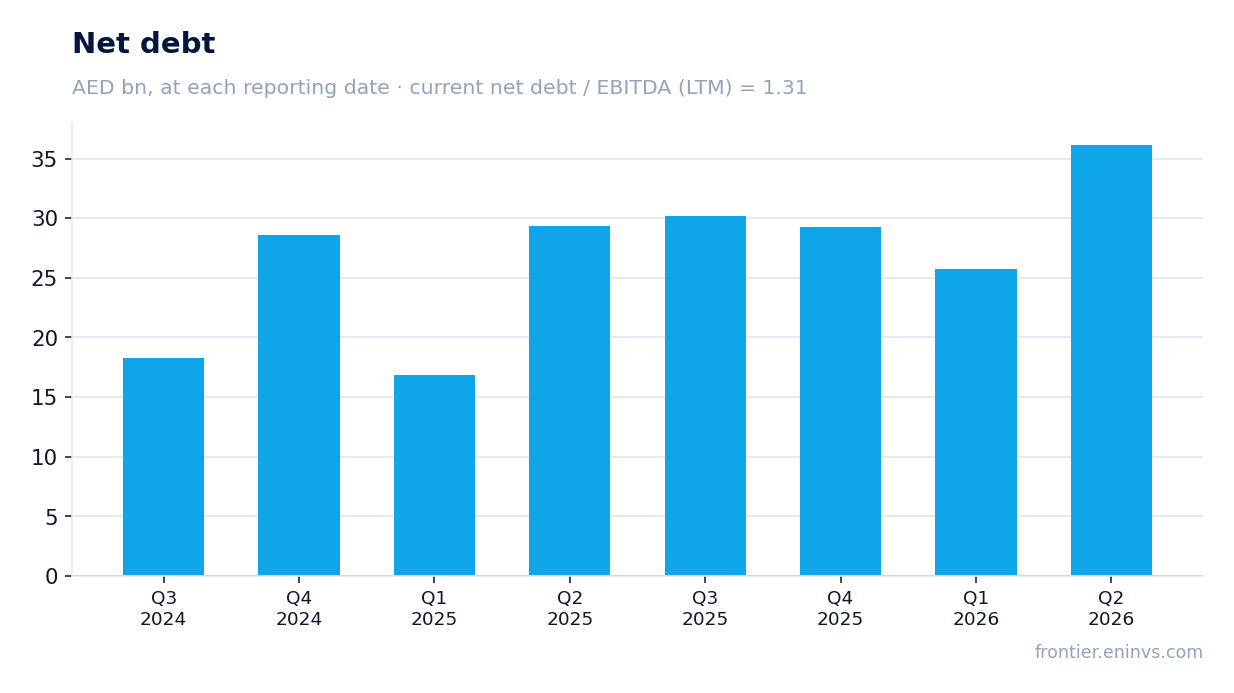
Debt rose to 36,161.2 million AED, but debt-to-EBITDA over 12 months stands at 1.31
Net debt at the end of Q2 2026 stood at 36,161.2 million AED, up 10.4 billion AED from the previous reporting date and 6.8 billion AED over the last 12 months. The rise in debt coincided with negative operating cash flow, indicating the need for external financing.
However, the net debt-to-EBITDA ratio over the last 12 months is 1.31, which looks moderate. Yet quarterly EBITDA was only 6,218.7 million AED, notably below the average of previous quarters (8,000–9,000 million AED), so the metric could deteriorate if this trend persists.
Dividend yield is below historical levels, and payouts are in question due to weak cash flow
Over the last 12 months, the company earned 11,536.7 million AED in net profit. At the current market cap of 188,023.7 million AED and a P/E of 16.3, a potential dividend yield at a generous 70% payout ratio would be around 4.3%, below historical levels for this issuer.
However, negative operating cash flow in Q2 casts doubt on the company's ability to maintain payouts at previous levels. If cash flow does not recover, dividends could be cut.
The portal's model implies a 46% downside from the current price
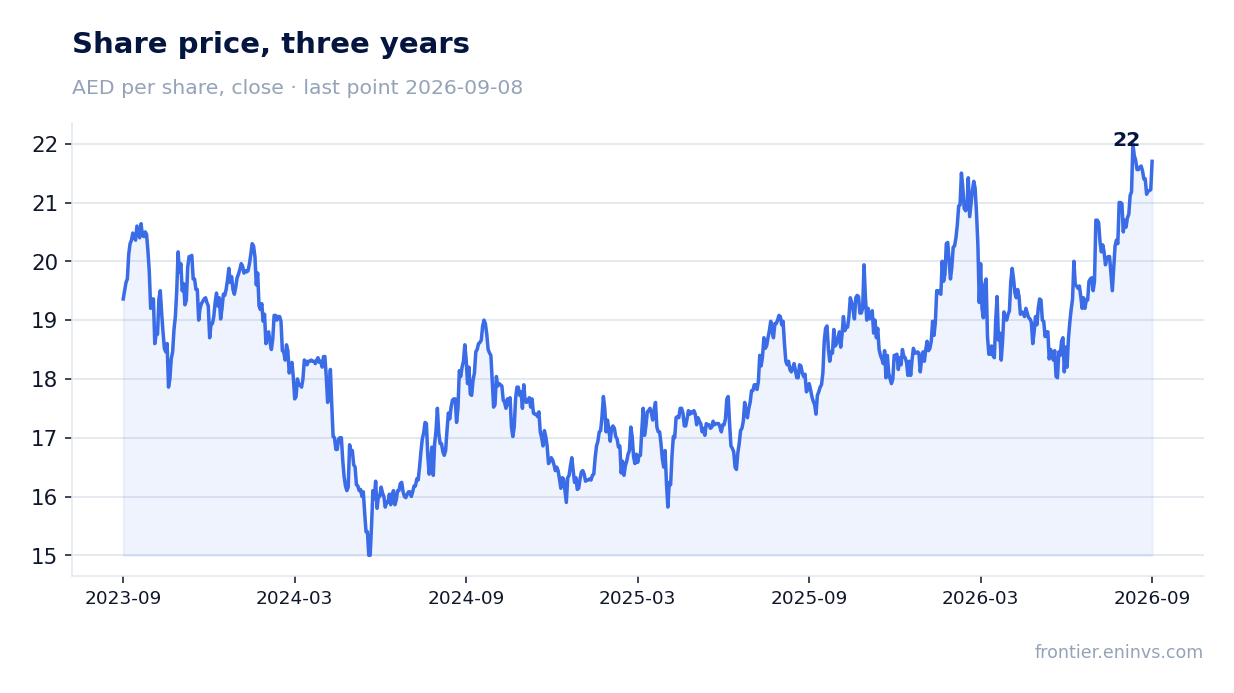
According to the portal's model, which assesses EBITDA growth and target multiple, the fair value of the share is 46% below the current market price. This means the market is pricing in higher growth or margin improvement than the model assumes.
At current multiples of P/E 16.3 and EV/EBITDA 9.7, the share looks expensive relative to its own history, especially given slowing revenue growth and weak cash flow.
Valuation on the latest reported figures
| Metric | Value |
|---|---|
| Market cap | 188 bn AED |
| P/E (LTM) | 16.3 |
| EV/EBITDA (LTM) | 9.7 |
| P/B | 3.04 |
| Net debt / EBITDA (LTM) | 1.31 |
| Operating cash flow (LTM) | 26.1 bn |
| ROE | 20.2% |
Bottom line
The strength of the report is revenue growth, albeit slowing to 6.4%. However, net profit fell 10.1%, operating cash flow turned negative, and debt rose. At current valuation — P/E 16.3 and EV/EBITDA 9.7 — the share looks expensive, and the portal's model indicates a 46% downside. The verdict is unattractive: until cash flow recovers and margins stabilize, there is no reason for a reassessment.
Open the company's financial profile EAND →
See also: market overview · valuation map · stock screeners