Emaar Development: profit grows faster than revenue, but cash flow lags
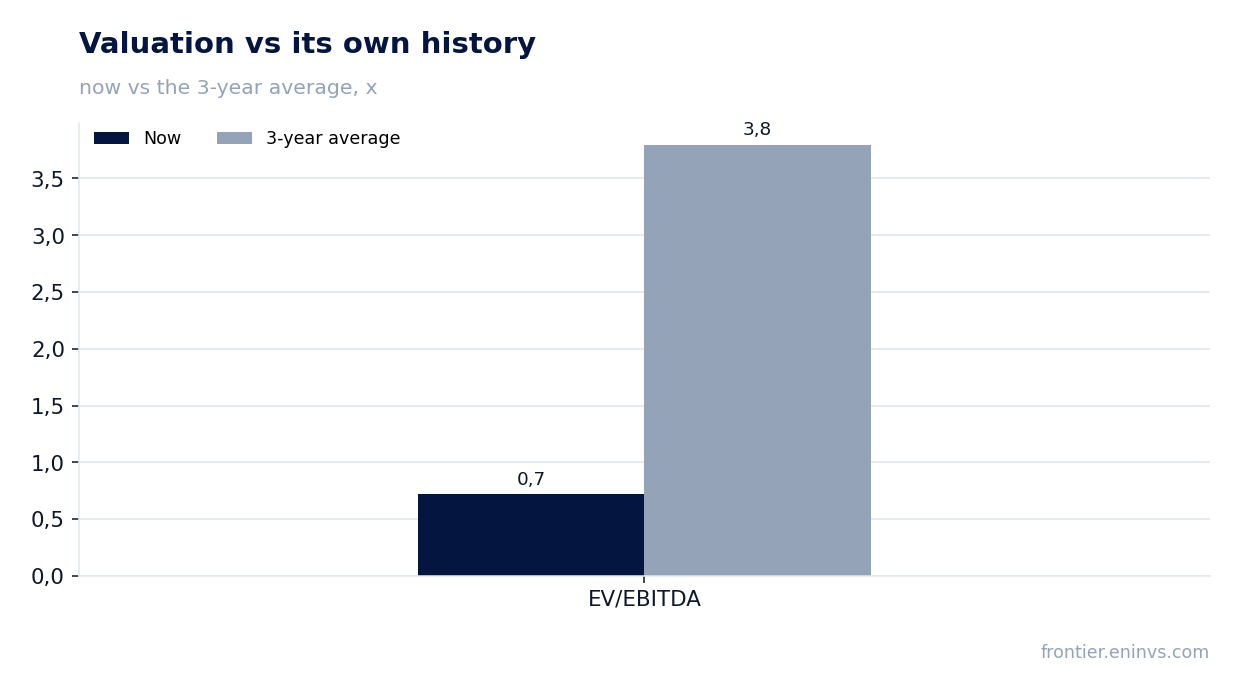
25 августа Emaar Development раскрыла результаты за второй квартал 2026 года: выручка выросла на 32,1% год к году, EBITDA – на 37,4%, чистая прибыль – на 43,6%. Маржа EBITDA достигла 49,7%, чистая маржа – 40,7%. При текущей цене акция выглядит привлекательно: мультипликатор EV/EBITDA составляет 0,72 против среднего за три года 3,80, а дивидендная доходность за последние 12 месяцев – 7,7%.
Key takeaways
— Revenue in Q2 2026 grew 32.1% YoY to AED 6,480.3 million
— EBITDA margin reached 49.7% versus 47.8% a year earlier, driven by revenue growth and operational efficiency
— Net profit grew 43.6% YoY to AED 2,638.9 million, supported by faster EBITDA growth and a low tax base
— Operating cash flow in Q2 2026 was AED 2,850.5 million, below net profit due to higher receivables and prepayments
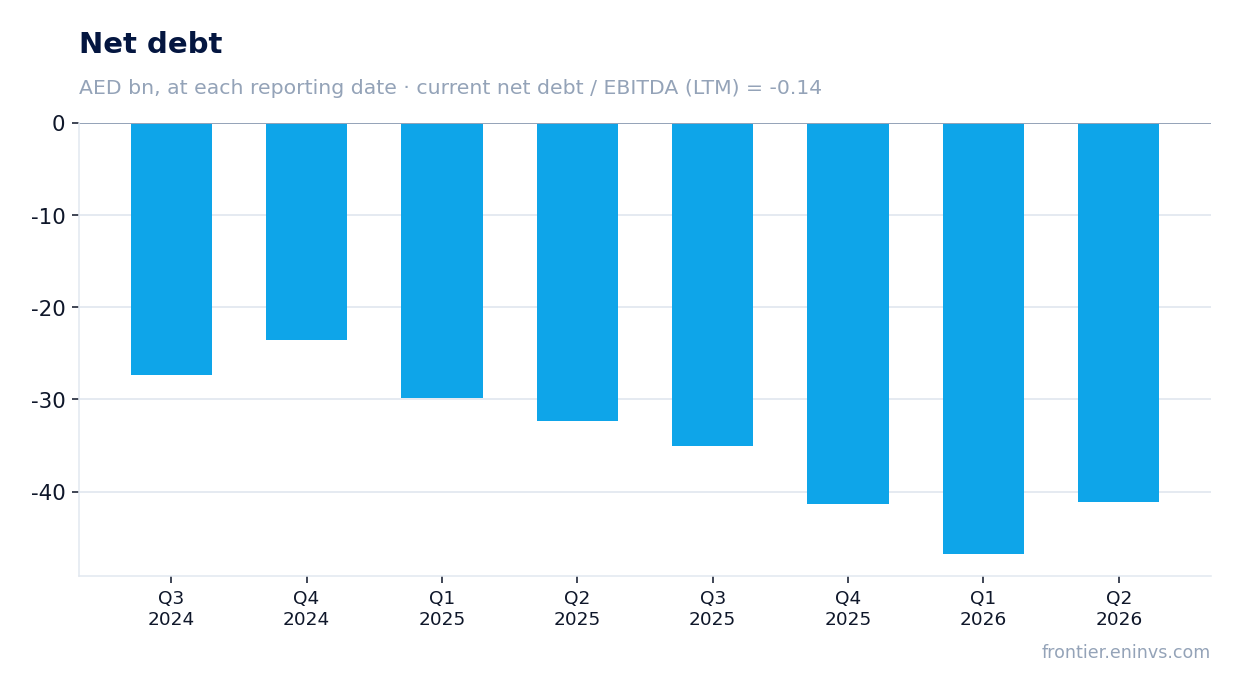
— Net debt is negative: minus AED 8,310.9 million, equivalent to minus 0.14x EBITDA over the last twelve months
— Trailing twelve-month dividend yield is 7.7%, above the market average, making the share attractive for income-oriented investors
— According to the portal's model, the share has +59% upside from the current price, confirming undervaluation
Attractiveness
Key figures, AED bn
| Metric | Q2 2025 | Q2 2026 | Change |
|---|---|---|---|
| Revenue | 4.91 | 6.48 | +32.1% |
| EBITDA | 2.34 | 3.22 | +37.4% |
| Operating profit | 2.34 | 3.22 | +37.7% |
| Net profit | 1.84 | 2.64 | +43.6% |
| Operating cash flow | 6.02 | 2.85 | -52.6% |
| Capex | 0.00 | 0.00 | -36.7% |
| EBITDA margin | 47.8% | 49.7% | +1.9 pp |
| Net margin | 37.5% | 40.7% | +3.2 pp |
Revenue in Q2 2026 grew 32.1% YoY to AED 6,480.3 million
In Q2 2026, Emaar Development's revenue reached AED 6,480.3 million, up 32.1% from the same quarter a year earlier. Growth slowed from Q1 2026's 36.5% but remains robust.
The main driver remains property sales in Dubai, where demand continues to outstrip supply. The company maintains a high pace of new project launches, providing revenue visibility for several quarters ahead.
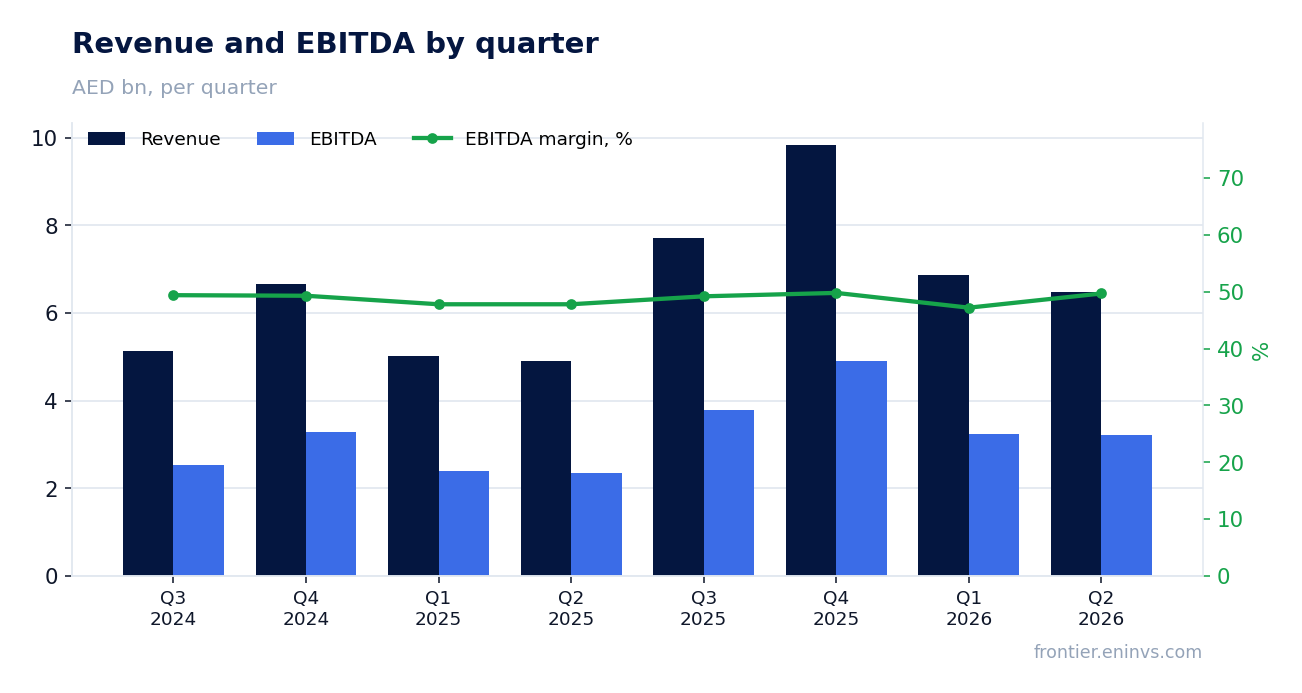
EBITDA margin reached 49.7% versus 47.8% a year earlier, driven by revenue growth and operational efficiency
EBITDA in Q2 2026 grew 37.4% YoY to AED 3,219.7 million, with the EBITDA margin expanding from 47.8% to 49.7%. The margin improvement is driven by revenue growth and cost control.
Operating profit almost matched EBITDA at AED 3,216.7 million, indicating a negligible share of depreciation in the cost structure. This is typical for a developer that outsources most construction work.
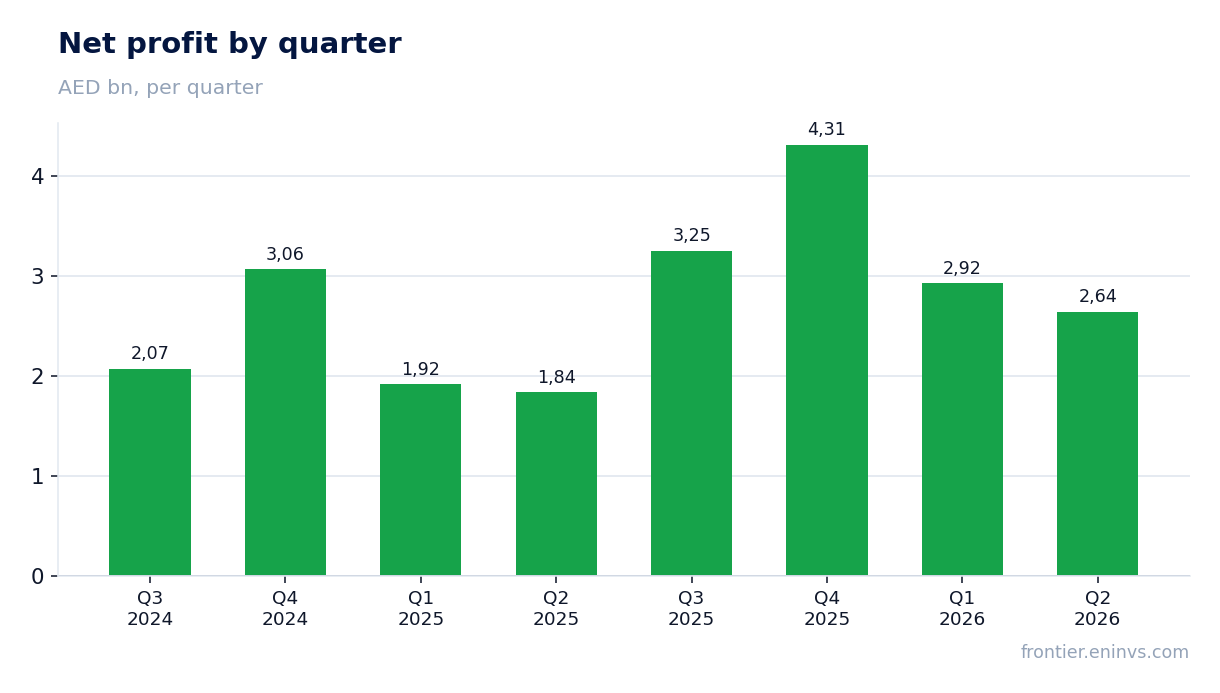
Net profit grew 43.6% YoY to AED 2,638.9 million, supported by faster EBITDA growth and a low tax base
Net profit for Q2 2026 was AED 2,638.9 million, up 43.6% YoY. Profit growth outpaced EBITDA growth due to a low effective tax rate and the absence of significant one-off items.
Net margin reached 40.7% versus 37.5% a year earlier. The company continues to generate high profits amid Dubai's strong property market.
Operating cash flow in Q2 2026 was AED 2,850.5 million, below net profit due to higher receivables and prepayments
Operating cash flow in Q2 2026 was AED 2,850.5 million, below net profit (AED 2,638.9 million). The difference is due to higher receivables and prepayments under contracts, typical for a developer during active sales.
Capital expenditure remains minimal – AED 3.0 million for the quarter, as the company does not build properties itself but hires contractors. Free cash flow is therefore almost equal to operating cash flow.
Net debt is negative: minus AED 8,310.9 million, equivalent to minus 0.14x EBITDA over the last twelve months
At the end of Q2 2026, net debt was minus AED 8,310.9 million, meaning the company has a net cash position. Net debt to EBITDA over the last twelve months is minus 0.14x.
During the quarter, the net cash position decreased by AED 5.7 billion, but over the last twelve months it increased by AED 8.7 billion. The company continues to fund dividend payments and portfolio expansion from its own funds.
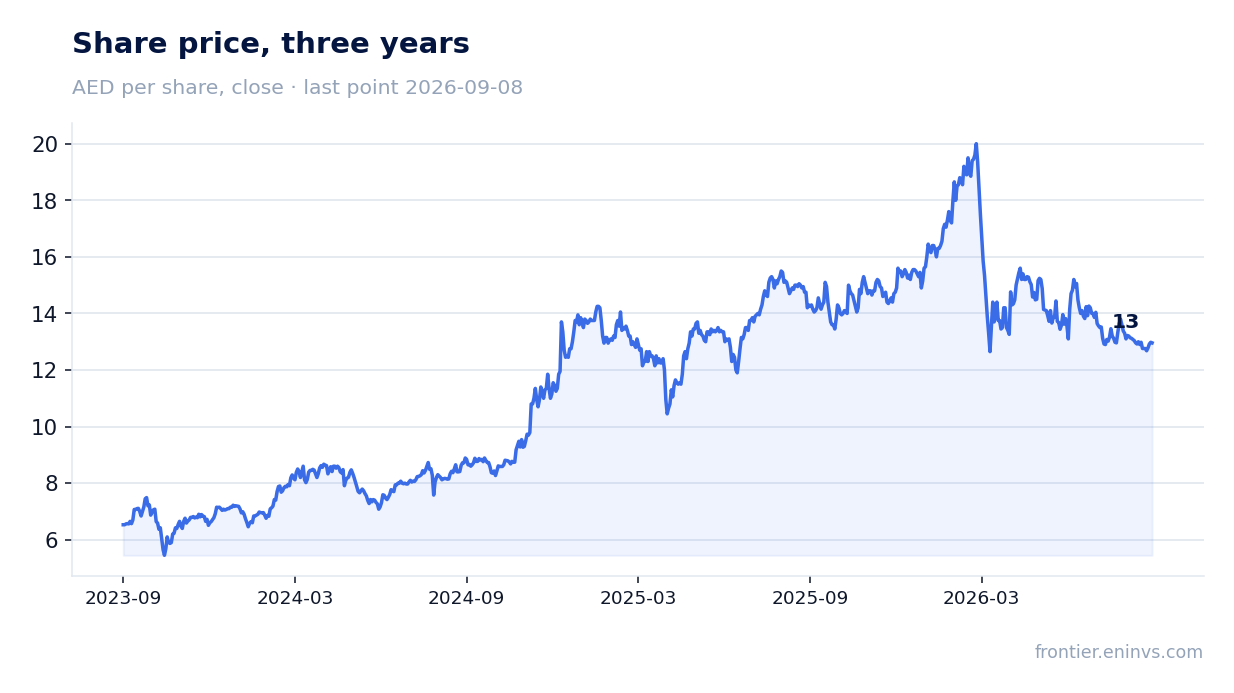
Trailing twelve-month dividend yield is 7.7%, above the market average, making the share attractive for income-oriented investors
Over the last twelve months, Emaar Development paid dividends corresponding to a yield of 7.7% at the current price. This is above the market average, making the share attractive for income-oriented investors.
The company follows a generous dividend policy, paying out a significant portion of profit. If current profitability is maintained and no major acquisitions occur, payouts next year could remain at a comparable level.
A risk to dividends is a potential slowdown in Dubai's property market, which would reduce profit and, consequently, payouts.
According to the portal's model, the share has +59% upside from the current price, confirming undervaluation
Our valuation model, based on EBITDA growth and a target multiple, shows a potential upside of +59% from the current price. This is significantly higher than most market peers.
The current EV/EBITDA multiple is 0.72, well below the three-year average of 3.80. Even considering a slowdown in the property market, the share trades at a discount to its own history.
Valuation on the latest reported figures
| Metric | Value |
|---|---|
| Market cap | 52.0 bn AED |
| P/E (LTM) | 4.0 |
| EV/EBITDA (LTM) | 0.7 |
| P/B | 1.26 |
| Net debt / EBITDA (LTM) | -0.14 |
| Operating cash flow (LTM) | 21.0 bn |
| ROE | 24.9% |
| Dividend yield (12m) | 7.7% |
| EV/EBITDA, 3-year average | 3.8 |
Bottom line
Emaar Development reported strong growth in revenue, EBITDA, and net profit for Q2 2026, with margins continuing to expand. The company maintains a net cash position and pays generous dividends. However, operating cash flow declined year-on-year, which warrants attention. At the current price, the share trades at a discount to its own history and, according to the portal's model, has +59% upside, making it attractive.
Open the company's financial profile EMAARDEV →
See also: market overview · valuation map · stock screeners