Talabat: revenue up 16.3%, but margins compress and the portal's model sees -12%
On August 25, Talabat reported Q2 2026 results. Revenue grew 16.3% YoY to $1,141.1 million, but EBITDA fell 12.4% and net profit 17.9%. At the current price, the share looks rather unattractive: revenue growth does not offset margin compression, and valuation remains rich.
Key takeaways
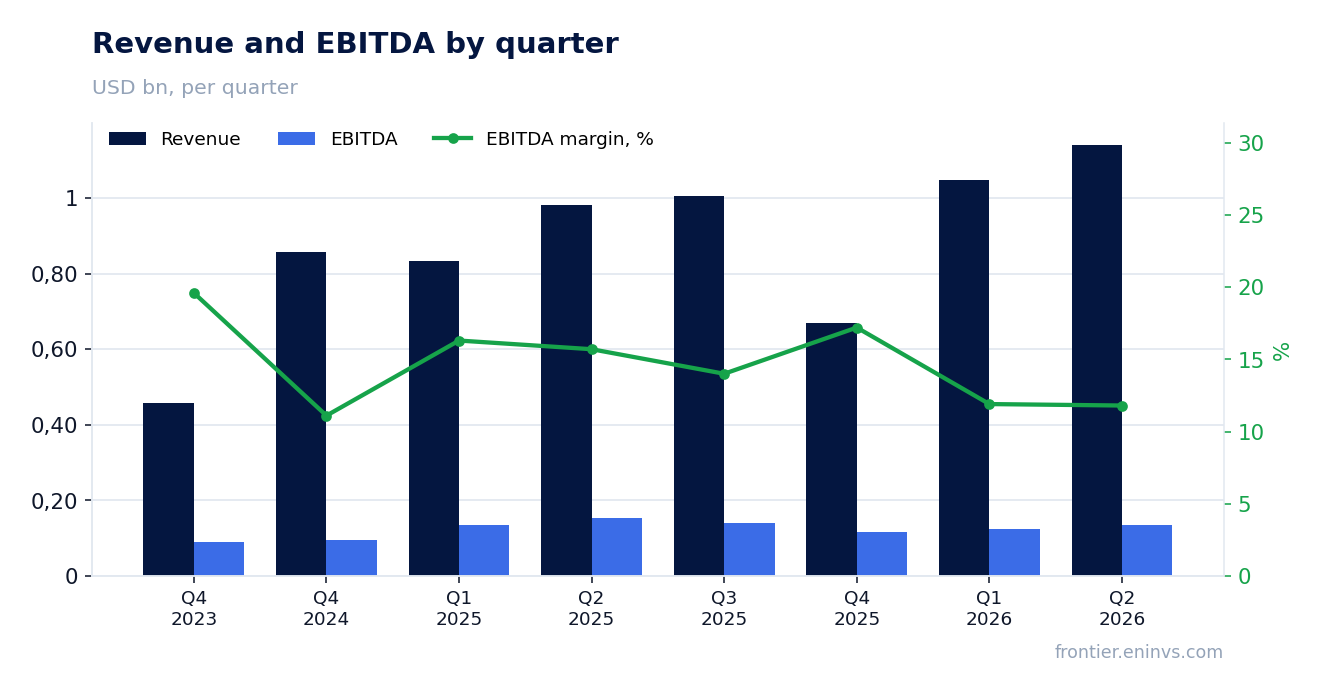
— Q2 2026 revenue grew 16.3% YoY, but EBITDA fell 12.4% – margin compressed from 15.7% to 11.8%
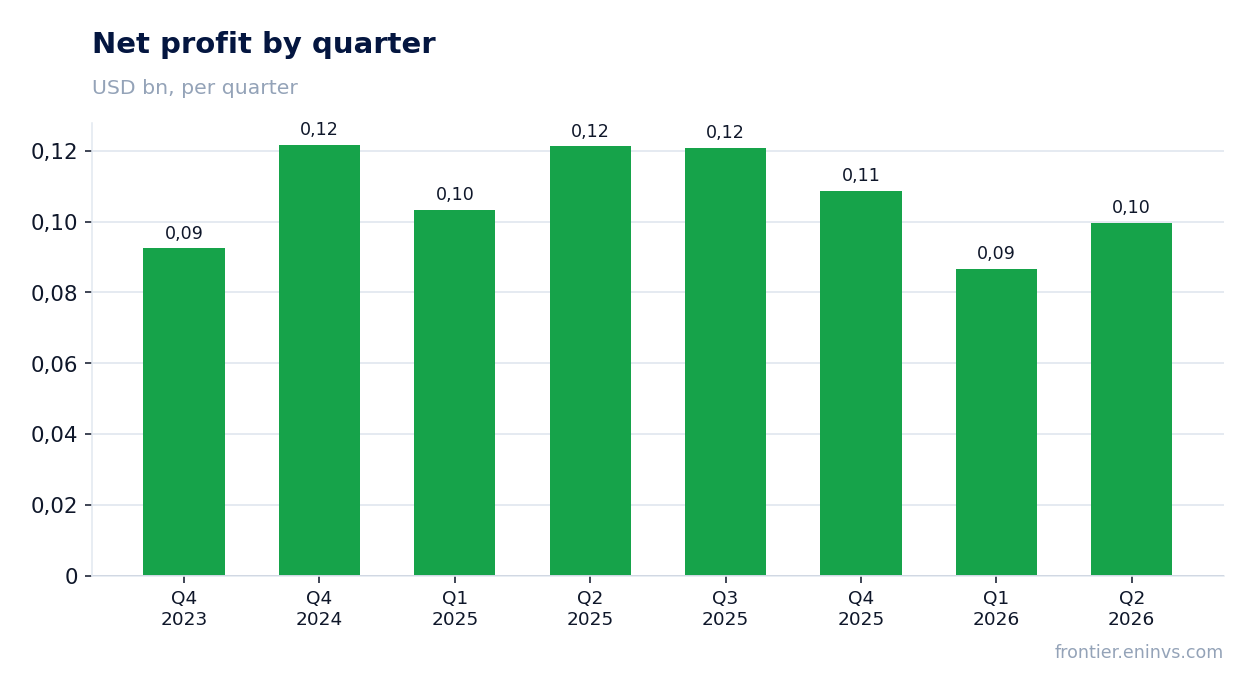
— Q2 2026 net profit fell 17.9% YoY to $99.6 million, with margin down from 12.4% to 8.7%
— Over the last twelve months, the company earned $415.8 million net profit and $514.7 million EBITDA
— Debt burden: net debt is negative at -$620.9 million, or -1.21x EBITDA over the last twelve months
— Trailing twelve-month dividend yield is 5.6% at the current price
— On the portal's model, the share's upside is -12% – valuation is above fair value
— Q2 2026 operating cash flow was $192.9 million, capex $12.6 million
Attractiveness
Key figures, USD bn
| Metric | Q2 2025 | Q2 2026 | Change |
|---|---|---|---|
| Revenue | 0.98 | 1.14 | +16.3% |
| EBITDA | 0.15 | 0.13 | -12.4% |
| Operating profit | 0.15 | 0.11 | -21.5% |
| Net profit | 0.12 | 0.10 | -17.9% |
| Operating cash flow | 0.30 | 0.19 | -35.3% |
| Capex | 0.01 | 0.01 | +45.3% |
| EBITDA margin | 15.7% | 11.8% | -3.9 pp |
| Net margin | 12.4% | 8.7% | -3.7 pp |
Q2 2026 revenue grew 16.3% YoY, but EBITDA fell 12.4% – margin compressed from 15.7% to 11.8%
In Q2 2026, Talabat's revenue reached $1,141.1 million, up 16.3% YoY. However, EBITDA for the same period fell 12.4% to $135.0 million, and the EBITDA margin dropped from 15.7% to 11.8%.
Margin compression amid rising revenue suggests operating costs grew faster than income. The reasons are not disclosed in the report, but it is clear that scale no longer automatically converts into profit.
Q2 2026 net profit fell 17.9% YoY to $99.6 million, with margin down from 12.4% to 8.7%
Net profit for Q2 2026 was $99.6 million, down 17.9% YoY. Net margin contracted from 12.4% to 8.7%.
Declining profit amid rising revenue reflects negative operating leverage: fixed and variable costs grew faster than income. This is the second consecutive quarter of profit decline despite double-digit revenue growth.
Over the last twelve months, the company earned $415.8 million net profit and $514.7 million EBITDA
Over the last twelve months (Q3 2025 through Q2 2026), Talabat's net profit was $415.8 million, and EBITDA – $514.7 million. These figures reflect current profitability but do not show dynamics – that is visible in quarterly reports.
Based on these figures, trailing P/E is 18.1x and EV/EBITDA is 13.4x. These are moderately high multiples for a company whose margin is compressing.
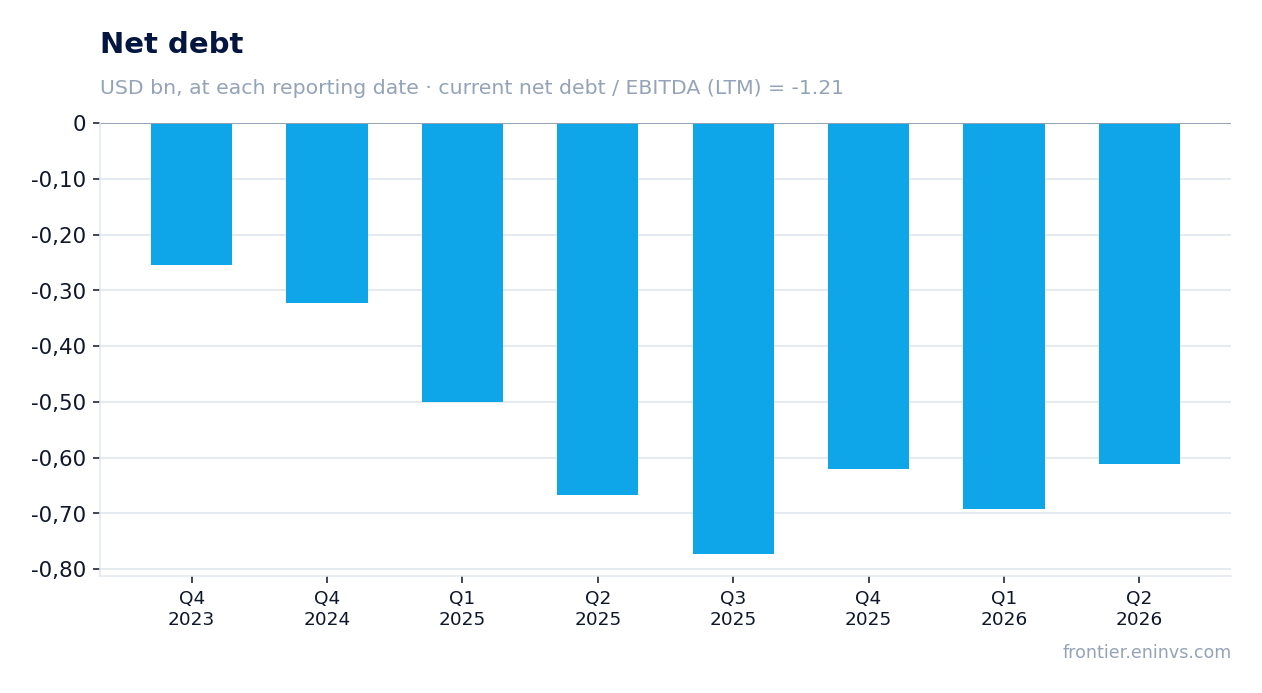
Debt burden: net debt is negative at -$620.9 million, or -1.21x EBITDA over the last twelve months
As of the latest reporting date, Talabat's net debt was -$620.9 million, meaning the company has a net cash position. Net debt to EBITDA over the last twelve months is -1.21x.
During the quarter, net debt changed by +$0.1 billion, and over the last twelve months also by +$0.1 billion, indicating a stable cash position. However, the direction of the leverage change cannot be assessed as the previous ratio value is unavailable.
Trailing twelve-month dividend yield is 5.6% at the current price
Over the last twelve months, Talabat paid dividends providing a yield of 5.6% at the current market capitalization of $7,536.4 million. This is a significant yield, especially given the negative net debt.
However, with margin compression and a 17.9% YoY decline in net profit in Q2 2026, future payouts may come under pressure. The size of dividends will depend on the company's ability to stabilize profitability.
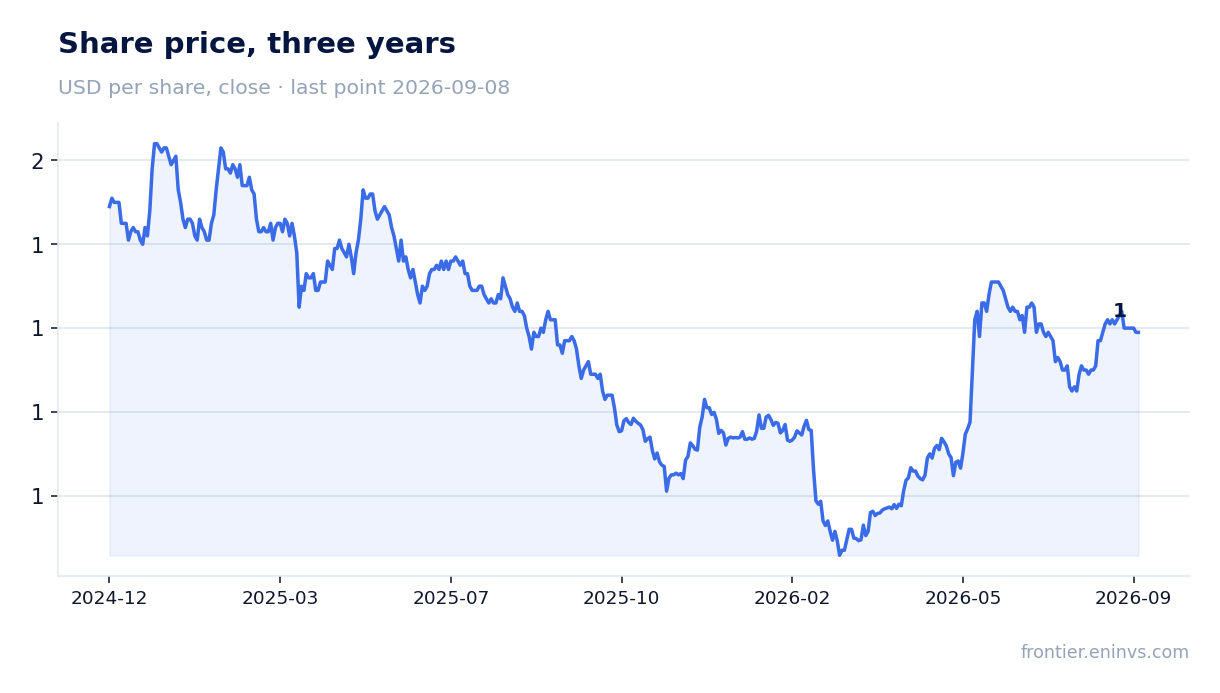
On the portal's model, the share's upside is -12% – valuation is above fair value
According to the portal's model, based on EBITDA growth and target multiple, the share's upside is -12% relative to the current price. This implies the market values the company above fair value per our model.
With trailing P/E of 18.1x and EV/EBITDA of 13.4x, the stock trades at a premium to its own history, especially given margin declining for the second consecutive quarter. A change in verdict would require either a slowdown in margin decline or lower multiples.
Q2 2026 operating cash flow was $192.9 million, capex $12.6 million
In Q2 2026, operating cash flow was $192.9 million, significantly above net profit ($99.6 million). Capex was modest at $12.6 million, resulting in high profit-to-free-cash-flow conversion.
However, over the last twelve months, operating cash flow was only $109.8 million – well below EBITDA ($514.7 million). This discrepancy may indicate significant working capital changes or one-off factors not disclosed in the report.
Valuation on the latest reported figures
| Metric | Value |
|---|---|
| Market cap | 7.54 bn USD |
| P/E (LTM) | 18.1 |
| EV/EBITDA (LTM) | 13.4 |
| P/B | 10.77 |
| Net debt / EBITDA (LTM) | -1.21 |
| Operating cash flow (LTM) | 0.11 bn |
| ROE | 55.5% |
| Dividend yield (12m) | 5.6% |
Bottom line
The strong points of the report are 16.3% revenue growth and a 5.6% dividend yield with negative net debt. However, margin compression from 15.7% to 11.8% in EBITDA and a 17.9% net profit decline in Q2 are worrying signals. With a P/E of 18.1x and 12% downside per the portal's model, the share looks rather unattractive. The key question for holders is whether the company can stabilize profitability or if the current trend continues.
Open the company's financial profile TALABAT →
See also: market overview · valuation map · stock screeners