TECOM: double-digit revenue growth but profit and margin lag behind
TECOM reported results for the second quarter of 2026. Revenue rose 10.8% year-on-year to AED 785.7 mn, EBITDA added 8.8%, and net profit grew 6.6%. Revenue growth slowed from 21.5% a year earlier, while the EBITDA margin declined to 78.0% from 79.3%. At the current price, the shares look neutral: the EV/EBITDA multiple is below its three-year average, but a 5.3% dividend yield and slowing profit growth leave no clear edge.
Key takeaways
— Revenue grew 10.8% year-on-year, but that is half the pace of a year earlier
— EBITDA added 8.8%, while its margin declined to 78.0% from 79.3%
— Net profit increased only 6.6%, lagging revenue
— Free cash flow remains high: operating cash flow of AED 641.1 mn for the quarter
— Leverage at 2.06x EBITDA LTM is moderate for a company with such profitability
— Dividend yield of 5.3% with a payout that could grow alongside profit
— EV/EBITDA of 9.38 is below the three-year average of 9.66, offering limited re-rating potential
Attractiveness
Key figures, AED bn
| Metric | Q2 2025 | Q2 2026 | Change |
|---|---|---|---|
| Revenue | 0.71 | 0.79 | +10.8% |
| EBITDA | 0.56 | 0.61 | +8.8% |
| Operating profit | 0.44 | 0.48 | +8.8% |
| Net profit | 0.38 | 0.40 | +6.6% |
| Operating cash flow | 0.47 | 0.64 | +36.8% |
| EBITDA margin | 79.3% | 78.0% | -1.3 pp |
| Net margin | 53.1% | 51.1% | -2.0 pp |
Revenue grew 10.8% year-on-year, but that is half the pace of a year earlier
In the second quarter of 2026, TECOM's revenue reached AED 785.7 mn, up 10.8% from the same period a year earlier. A year ago, in Q2 2025, growth was 21.5%. The slowdown began in Q4 2025, when the pace fell to 15.7%, and continued in Q1 2026 to 11.0%.
The sequential deceleration in quarterly revenue growth is a steady trend over the past four quarters. This means the company is entering a more mature phase: the low-base effect of previous years has run its course, and further growth will depend on organic development of the property portfolio and occupancy rates.
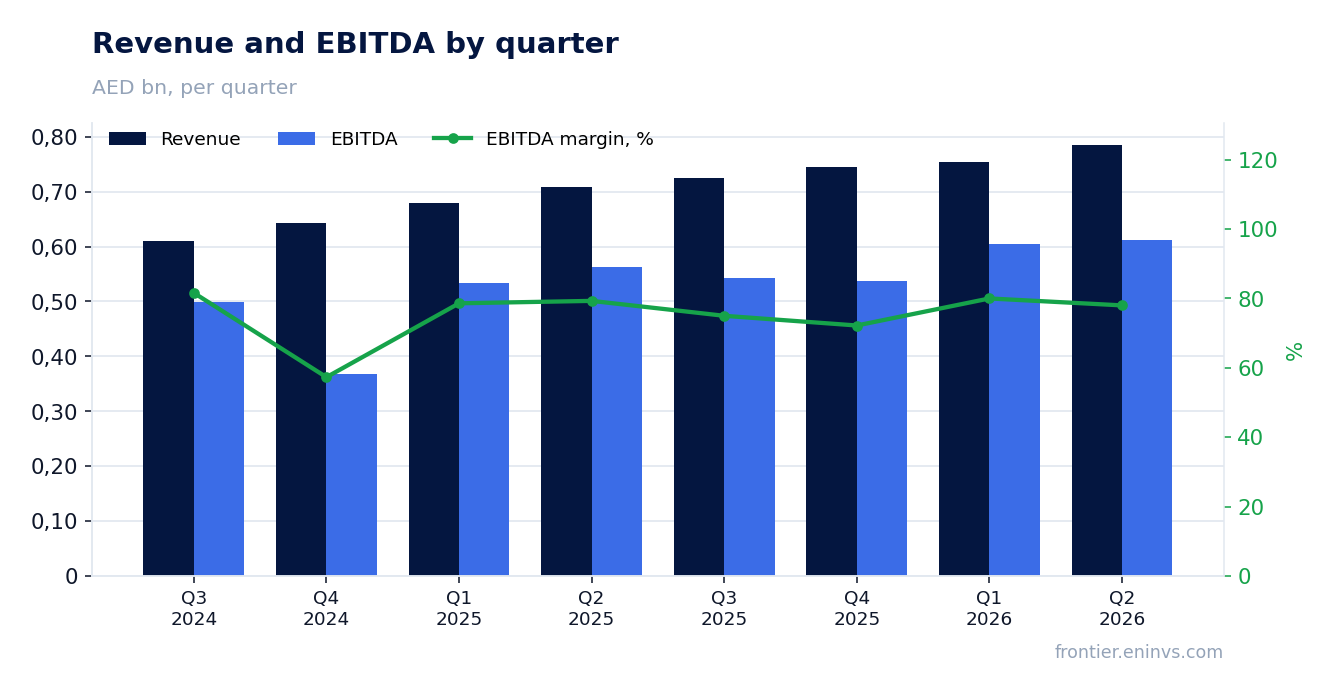
EBITDA added 8.8%, while its margin declined to 78.0% from 79.3%
EBITDA in Q2 2026 rose 8.8% year-on-year to AED 612.6 mn. EBITDA growth lags revenue growth, causing the EBITDA margin to decline to 78.0% from 79.3% a year earlier. That is a drop of 1.3 percentage points.
The margin remains very high – almost 80% of revenue converts into EBITDA before depreciation and interest. Such profitability is typical for real estate leasing companies, where operating costs are relatively low. Nevertheless, the margin decline signals that revenue growth is accompanied by faster cost growth.
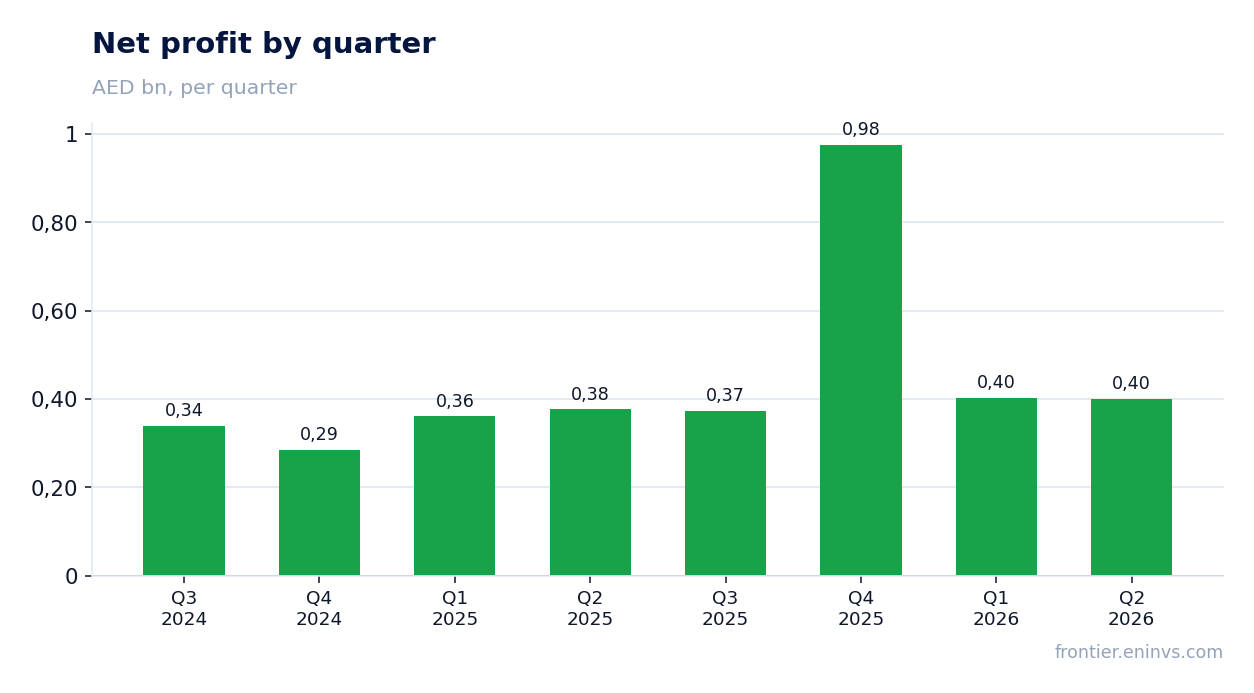
Net profit increased only 6.6%, lagging revenue
Net profit in Q2 2026 was AED 401.3 mn, up 6.6% from a year earlier. Profit growth lags both revenue (+10.8%) and EBITDA (+8.8%). The net margin declined to 51.1% from 53.1% a year earlier.
The lag in net profit is due to faster growth in expenses below operating profit – likely depreciation or interest payments. However, the report does not detail this cause. Importantly, profit is still growing, albeit slower than revenue.
Free cash flow remains high: operating cash flow of AED 641.1 mn for the quarter
Operating cash flow in Q2 2026 was AED 641.1 mn, significantly higher than net profit (AED 401.3 mn). This is due to depreciation, which is a non-cash expense. Over the last 12 months, operating cash flow amounted to AED 2,000.0 mn.
There is no data on capital expenditures in the provided materials, so free cash flow cannot be assessed. However, the high profitability and low capital intensity of the real estate leasing business suggest that free cash flow remains substantial.
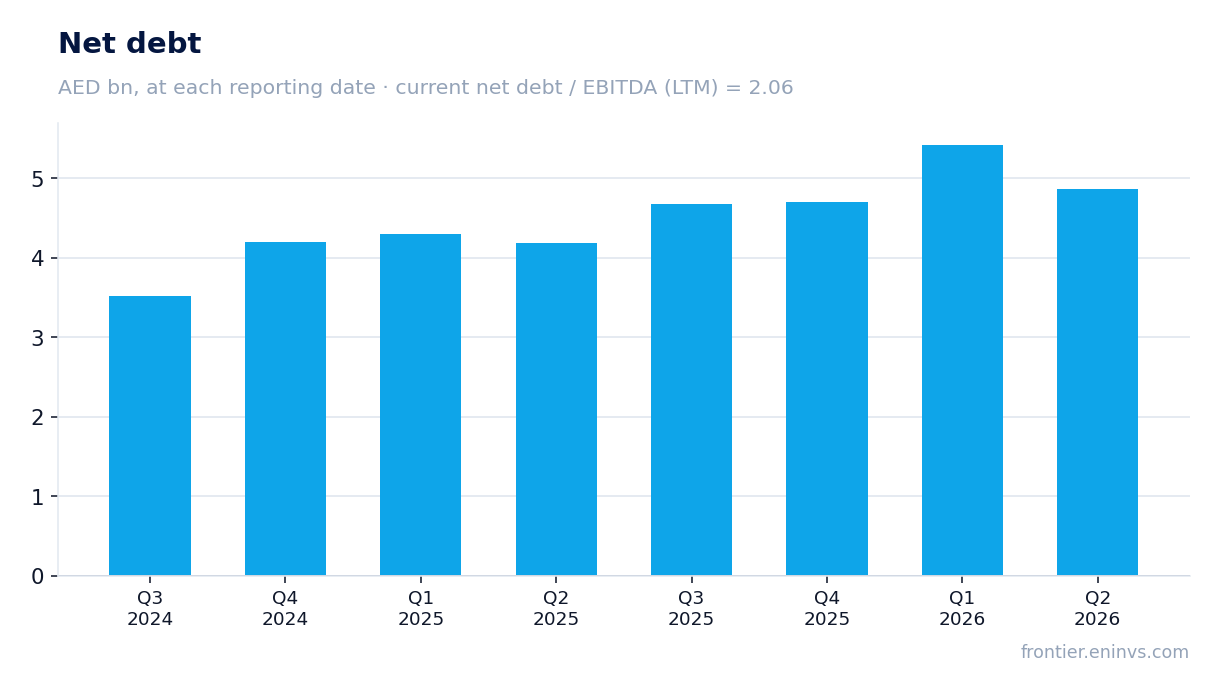
Leverage at 2.06x EBITDA LTM is moderate for a company with such profitability
Net debt at the end of Q2 2026 was AED 4,859.6 mn. The ratio of net debt to EBITDA for the last 12 months is 2.06. This is a moderate level for a company with an EBITDA margin of around 80%.
During the quarter, net debt decreased by AED 0.6 bn compared to the previous reporting date, but over 12 months it increased by AED 0.7 bn. There is no data on the earlier value of the leverage ratio, so its direction of change is not provided.
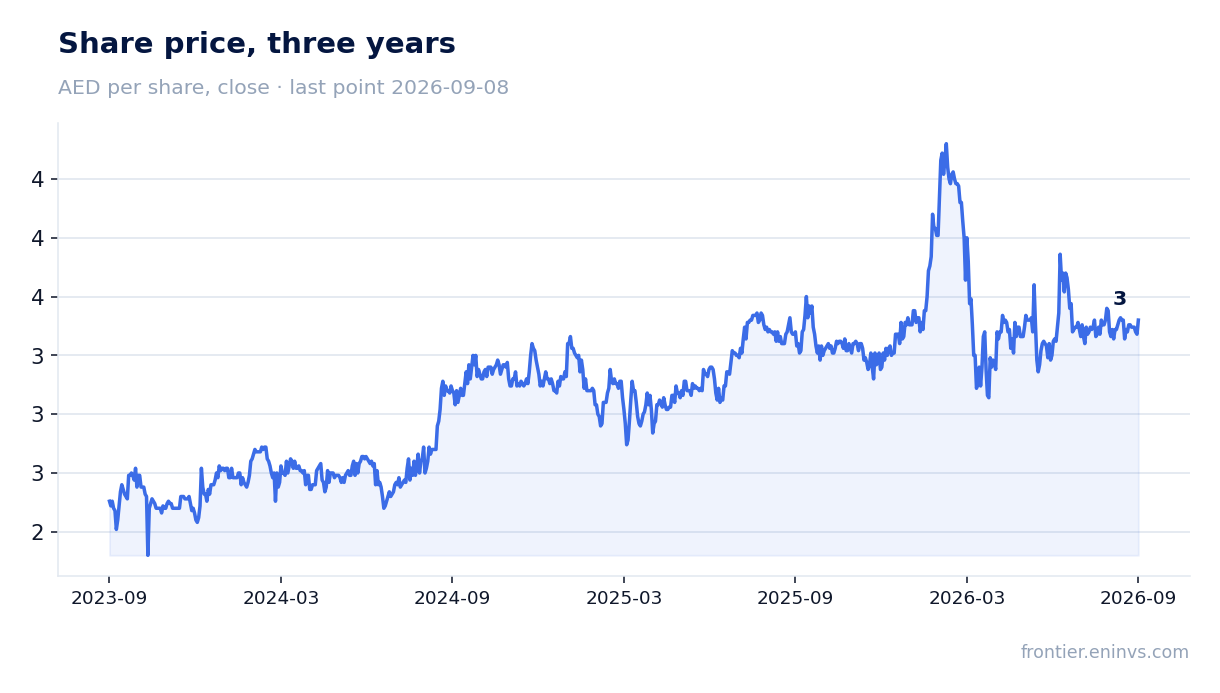
Dividend yield of 5.3% with a payout that could grow alongside profit
The dividend yield over the last 12 months is 5.3%. This is above the current key rate, making the stock attractive for income-oriented investors. The company does not disclose the size of the latest dividend and the payout ratio in the provided materials.
Our estimate of the future dividend is based on current profit and historical yield. If the payout ratio remains at the previous level, the dividend could grow along with profit. However, a decline in net profit or an increase in capital expenditures could lead to smaller payouts.
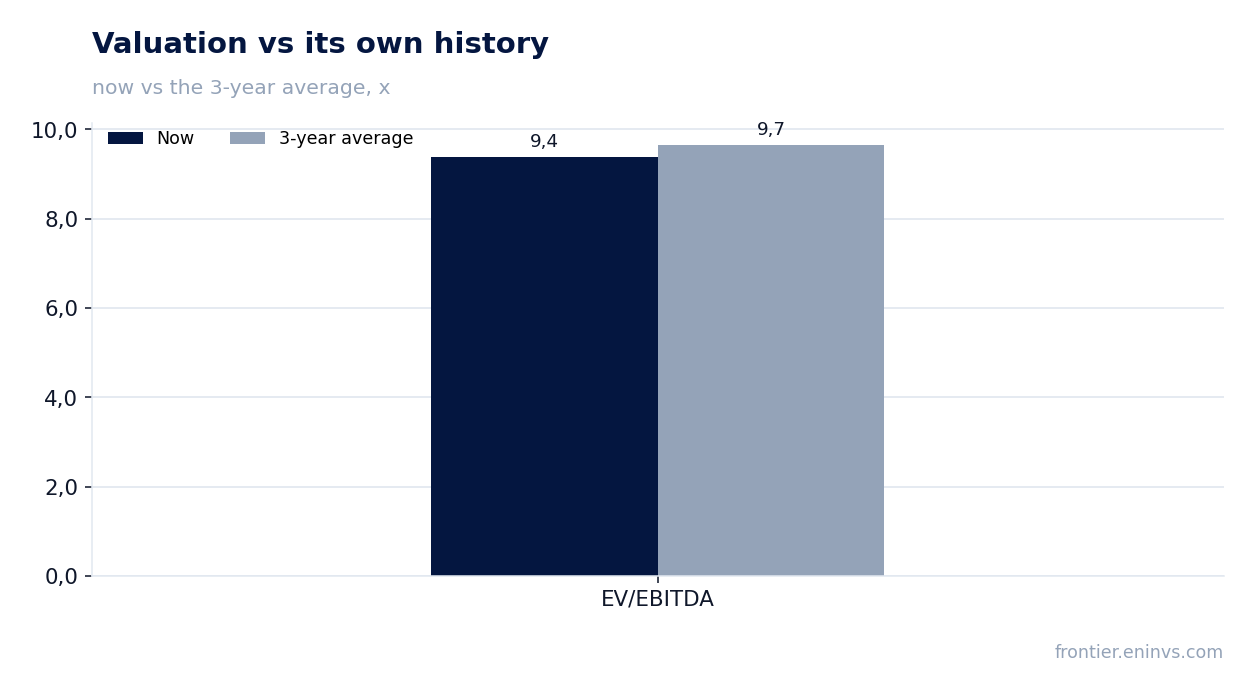
EV/EBITDA of 9.38 is below the three-year average of 9.66, offering limited re-rating potential
The current EV/EBITDA multiple is 9.38, below the three-year average of 9.66. This means the stock trades at a slight discount to its historical valuation. However, the discount is small – about 3%.
According to the portal's model, the upside to fair value is estimated at +7%. This is a moderate potential that does not compensate for the risks of slowing profit growth. A re-rating would require sustained revenue growth and margin recovery.
Valuation on the latest reported figures
| Metric | Value |
|---|---|
| Market cap | 16.7 bn AED |
| P/E (LTM) | 7.8 |
| EV/EBITDA (LTM) | 9.4 |
| P/B | 2.12 |
| Net debt / EBITDA (LTM) | 2.06 |
| Operating cash flow (LTM) | 2.00 bn |
| ROE | 19.9% |
| Dividend yield (12m) | 5.3% |
| EV/EBITDA, 3-year average | 9.7 |
Bottom line
TECOM reported Q2 2026 results: revenue grew 10.8%, but profit and margin lag. The company remains highly profitable with an EBITDA margin of 78.0% and a dividend yield of 5.3%. Leverage is moderate at 2.06x EBITDA. However, slowing growth and margin decline limit the upside. At the current price, the stock is neutrally valued: EV/EBITDA is below the three-year average, but the discount is small, and the portal model's upside is +7%.
Open the company's financial profile TECOM →
See also: market overview · valuation map · stock screeners