Mineral Resources: profit is back, but half of EBITDA is yet to become cash
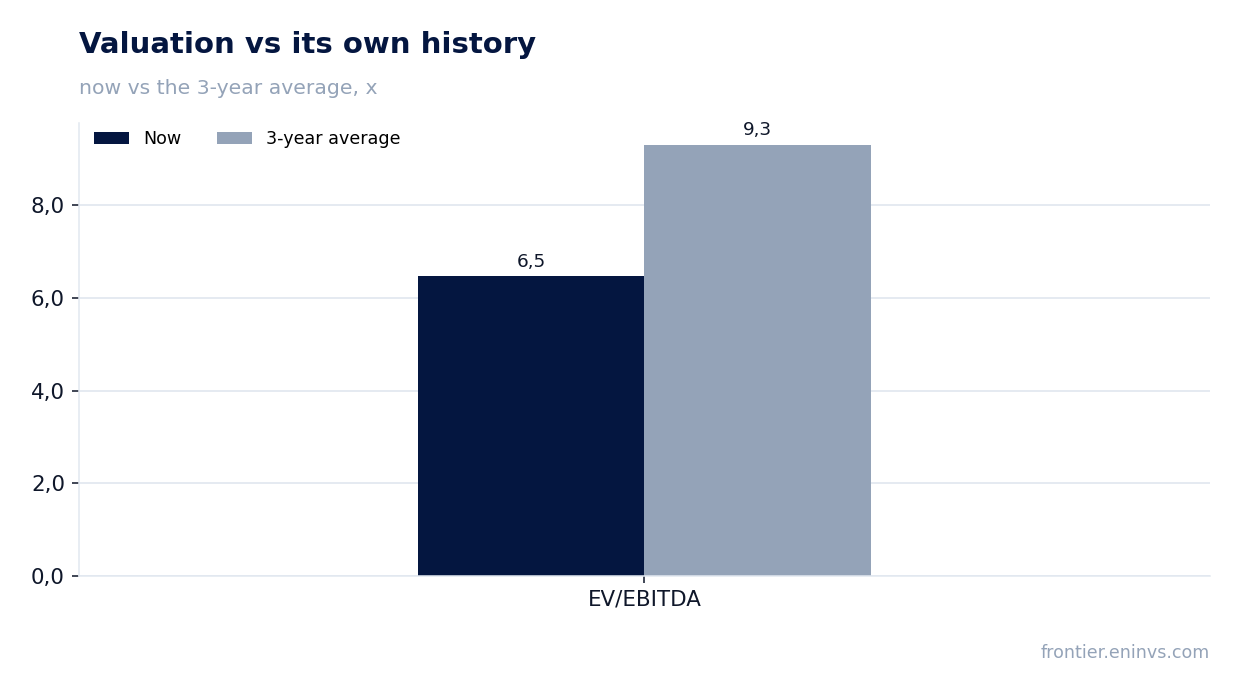
Mineral Resources' FY 2026 report showed a sharp turnaround: revenue rose 44.5% year on year, EBITDA jumped 232.4%, and net margin swung from minus 20.2% to plus 16.4%. Over the trailing twelve months the company earned AUD 1,061.0 million in net profit and AUD 2,473.0 million in EBITDA, but operating cash flow was only AUD 2,100.0 million, while net debt stands at AUD 3,642.0 million. With EV/EBITDA at 6.47 against its own three-year average of 9.31 and 61% upside on the portal's model, the share looks attractive, though cash conversion and dividend history still cap the valuation.
Key takeaways
— Revenue rose 44.5% year on year to AUD 6,500.0 million, the highest in the company's history
— EBITDA surged 232.4%, with margin reaching 38.3% versus 16.6% a year earlier
— Net profit of AUD 1,061.0 million over the trailing twelve months restored a positive 16.4% net margin after a loss a year earlier
— Operating cash flow of AUD 2,100.0 million covers only 85% of EBITDA, the main question mark in the report
— Net debt of AUD 3,642.0 million at 1.47x LTM EBITDA is a moderate load, but the absolute debt remains large
— Trailing twelve-month dividend yield of 1.35% looks modest against the key rate and does not compensate for risks
— EV/EBITDA of 6.47 versus the three-year average of 9.31 and 61% upside on the portal's model point to undervaluation
Attractiveness
Key figures, AUD bn
| Metric | FY 2025 | FY 2026 | Change |
|---|---|---|---|
| Revenue | 4.47 | 6.46 | +44.5% |
| EBITDA | 0.74 | 2.47 | +232.4% |
| Operating profit | -0.66 | 1.47 | to profit |
| Net profit | -0.90 | 1.06 | to profit |
| Operating cash flow | -0.47 | 2.08 | to profit |
| Capex | 2.16 | 1.21 | -43.7% |
| EBITDA margin | 16.6% | 38.3% | +21.7 pp |
| Net margin | -20.2% | 16.4% | +36.6 pp |
Revenue rose 44.5% year on year to AUD 6,500.0 million, the highest in the company's history
Mineral Resources' FY 2026 revenue reached AUD 6,500.0 million, up 44.5% from a year earlier. This is a record for the company, reflecting both higher shipment volumes and favourable pricing for iron ore and lithium.
The mining and processing segments drove the increase. The company raised output at key assets and completed the integration of acquired capacity, adding further volume.
The revenue trend confirms that operational improvements are sustainable rather than one-off. But to fully assess the quality of growth, it is important to see how it converts into profit and cash flow.
EBITDA surged 232.4%, with margin reaching 38.3% versus 16.6% a year earlier
FY 2026 EBITDA came in at AUD 2,473.0 million, up 232.4% year on year. The EBITDA margin rose to 38.3% from 16.6% a year earlier – the largest margin expansion in recent years.
The jump reflects operating leverage: revenue grew 44.5% while a significant portion of costs remained fixed. The company also reduced unit costs through productivity gains and logistics optimisation.
The 38.3% margin looks sustainable if commodity prices hold at current levels. However, any price decline could quickly bring the margin back to more modest levels, given the high share of fixed costs.
Net profit of AUD 1,061.0 million over the trailing twelve months restored a positive 16.4% net margin after a loss a year earlier
Over the trailing twelve months Mineral Resources earned AUD 1,061.0 million in net profit, compared with a loss a year earlier. The FY 2026 net margin was 16.4% versus minus 20.2% a year earlier.
The swing to profitability came from higher operating efficiency and lower impairments that weighed on last year's results. The company also booked a gain from the sale of non-core assets, which added to profit but is not recurring.
Excluding one-offs, profit would have been lower, yet even the adjusted margin remains positive. This is an important recovery signal, but the sustainability of the result will depend on the ability to generate cash flow.
Operating cash flow of AUD 2,100.0 million covers only 85% of EBITDA, the main question mark in the report
Operating cash flow over the trailing twelve months was AUD 2,100.0 million, covering only 85% of EBITDA. This means part of the earned profit is tied up in working capital or goes to debt servicing.
The gap between EBITDA and cash flow may be due to higher inventories and receivables amid rising sales volumes. The company also bears significant interest expenses, which are excluded from EBITDA but reduce cash flow.
For investors this is a key point: without improving cash conversion, the company will have to either cut capital expenditure or increase debt to fund dividends and growth.
Net debt of AUD 3,642.0 million at 1.47x LTM EBITDA is a moderate load, but the absolute debt remains large
Net debt at the latest reporting date was AUD 3,642.0 million, with a net debt to LTM EBITDA ratio of 1.47. This is a moderate level for a mining company, especially amid high commodity prices.
During the reporting period net debt decreased by RUB 0.5 billion, and over the trailing twelve months by RUB 1.0 billion. The reduction came from higher operating profit and proceeds from asset sales.
Nevertheless, the absolute debt remains significant. If market conditions deteriorate, the company could face higher debt servicing costs, pressuring profit and cash flow.
Trailing twelve-month dividend yield of 1.35% looks modest against the key rate and does not compensate for risks
The trailing twelve-month dividend yield was 1.35%. This is a low level, especially given the current key rate, which offers a more attractive risk-free return.
The company pays dividends, but their size depends on profit and cash flow. At the payout ratio the company uses, current profit supports the dividend, but growth in payouts is limited by capital expenditure needs.
For income-oriented investors, Mineral Resources' dividend history is not yet a primary argument. More important is the ability to increase free cash flow, which could lead to higher dividends in the future.
EV/EBITDA of 6.47 versus the three-year average of 9.31 and 61% upside on the portal's model point to undervaluation
The company's current EV/EBITDA is 6.47, below its own three-year average of 9.31. This indicates that the market values the business cheaper than it has on average over the past three years.
The trailing twelve-month P/E is 11.65. Market capitalisation stands at AUD 12,365.9 million. The EV/EBITDA and P/E ratios confirm that the share trades at a discount to historical levels.
According to the portal's model, which factors in EBITDA growth and a target multiple, the upside to fair value is 61%. This is not a consensus forecast but our own estimate, and it assumes the company can sustain current operating performance.
Valuation on the latest reported figures
| Metric | Value |
|---|---|
| Market cap | 12.4 bn AUD |
| P/E (LTM) | 11.7 |
| EV/EBITDA (LTM) | 6.5 |
| P/B | 2.57 |
| Net debt / EBITDA (LTM) | 1.47 |
| Operating cash flow (LTM) | 2.10 bn |
| ROE | 23.5% |
| Dividend yield (12m) | 1.4% |
| EV/EBITDA, 3-year average | 9.3 |
Bottom line
Mineral Resources delivered a strong turnaround: revenue rose 44.5%, EBITDA jumped 232.4%, and net margin returned to positive territory. However, operating cash flow covers only 85% of EBITDA, and the 1.35% dividend yield does not compensate for risks. The EV/EBITDA of 6.47 against the three-year average of 9.31 and 61% upside on the portal's model make the share attractive for investors willing to accept commodity and debt risks. The key question for a holder is whether the company can improve cash conversion without increasing debt.
Open the company's financial profile MIN →
See also: market overview · valuation map · stock screeners