First Majestic Silver: profit doubled, but revenue slowed and the portal model sees 61% downside
On August 25, First Majestic Silver reported second-quarter 2026 results. Revenue rose 56.5% year on year to $414.2 million, EBITDA jumped 119.8% to $247.4 million, and net profit more than doubled, up 122.5% to $125.9 million. The EBITDA margin expanded to 60.2% from 42.9% a year earlier, while net debt remains negative at $484.7 million, meaning cash exceeds debt. In our view, the shares look unattractive: EV/EBITDA LTM is 9.79, the portal model implies 61% downside to fair value, and revenue growth decelerated from 95.5% in the first quarter to 56.5% in the second, pointing to fading momentum.
Key takeaways
— Revenue rose 56.5% year on year, but that is half the pace of the previous quarter
— EBITDA margin climbed to 60.2% on higher silver and gold prices
— Net profit jumped 122.5%, but operating cash flow lags EBITDA
— Negative net debt of $484.7 million is a cushion, not leverage
— Capex rose to $59.5 million but remains below operating cash flow
— Dividend yield of 0.19% does not compensate for re-rating risk
— EV/EBITDA LTM of 9.79 and the portal model point to 61% downside to fair value
Attractiveness
Key figures, USD bn
| Metric | Q2 2025 | Q2 2026 | Change |
|---|---|---|---|
| Revenue | 0.26 | 0.41 | +56.5% |
| EBITDA | 0.11 | 0.25 | +119.8% |
| Operating profit | 0.04 | 0.20 | +403.0% |
| Net profit | 0.06 | 0.13 | +122.5% |
| Operating cash flow | 0.09 | 0.21 | +131.8% |
| Capex | 0.05 | 0.06 | +20.1% |
| EBITDA margin | 42.9% | 60.2% | +17.3 pp |
| Net margin | 21.4% | 30.4% | +9.0 pp |
Revenue rose 56.5% year on year, but that is half the pace of the previous quarter
In the second quarter of 2026, First Majestic Silver's revenue reached $414.2 million, up 56.5% year on year. That marks a clear deceleration from the first quarter, when growth was 95.5%, and from the fourth quarter of 2025, when it was 172.0%. The slowdown comes against a high base: second-quarter 2025 revenue was $264.7 million.
The sequential decline from the first quarter of 2026 ($480.9 million) reflects both seasonal factors and, likely, lower sales volumes or a change in production mix. However, without operational details from the report, the exact cause cannot be pinpointed. Importantly, even with the slowdown, annual growth remains double-digit and is supported by high precious metal prices.
For investors, the key question is the sustainability of this growth. If silver and gold prices hold at current levels, revenue may stabilise, but further deceleration in growth will inevitably weigh on profit and valuation.
EBITDA margin climbed to 60.2% on higher silver and gold prices
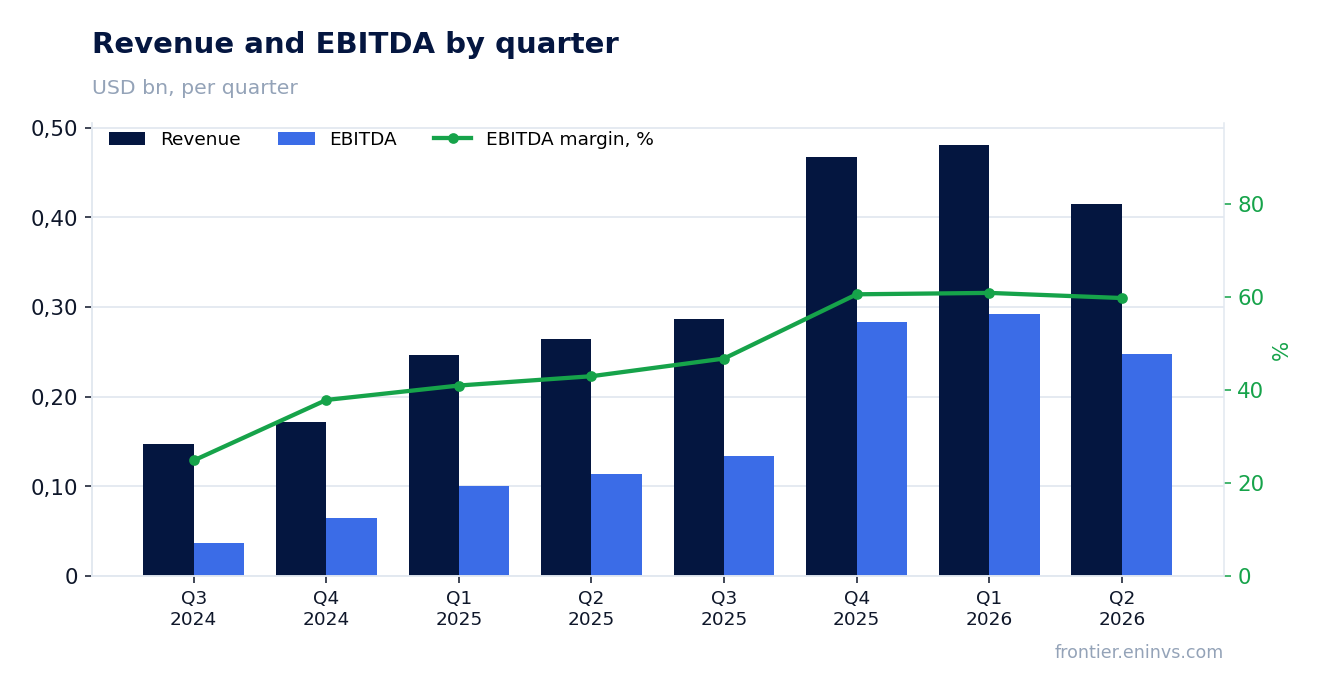
EBITDA in the second quarter of 2026 reached $247.4 million, up 119.8% year on year. The EBITDA margin hit 60.2%, compared with 42.9% a year earlier. This margin expansion is primarily driven by favourable precious metal prices, which significantly boosted operating leverage.
Operating profit also rose sharply, to $198.6 million, confirming effective cost control. However, without a detailed breakdown of expenses, it is difficult to assess how sustainable this margin is. If metal prices correct, the margin could quickly revert to historical levels.
Nevertheless, the current margin is among the highest in recent years, making the company attractive from an operational efficiency standpoint, but it also introduces cyclical risk.
Net profit jumped 122.5%, but operating cash flow lags EBITDA
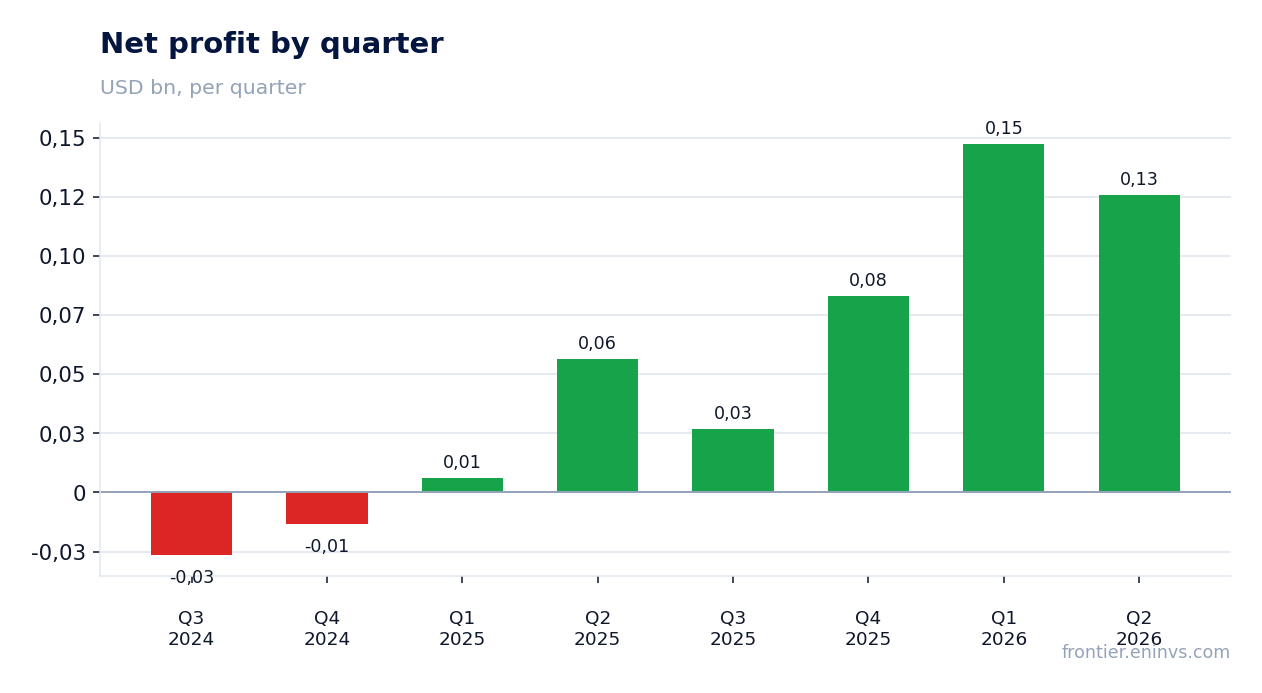
Net profit in the second quarter of 2026 was $125.9 million, up 122.5% year on year. The net margin rose to 30.4% from 21.4%. However, operating cash flow for the same period was $208.9 million, noticeably below EBITDA of $247.4 million.
The gap between EBITDA and operating cash flow could stem from working capital increases, tax payments, or other non-cash items. Without a detailed breakdown, the exact cause is unclear, but the fact that cash flow lags profit is a cautionary signal.
For investors, it is important that profit growth is not fully converting into cash. This could limit the company's ability to fund dividends and capex without increasing debt, although the current net cash position provides some flexibility.
Negative net debt of $484.7 million is a cushion, not leverage
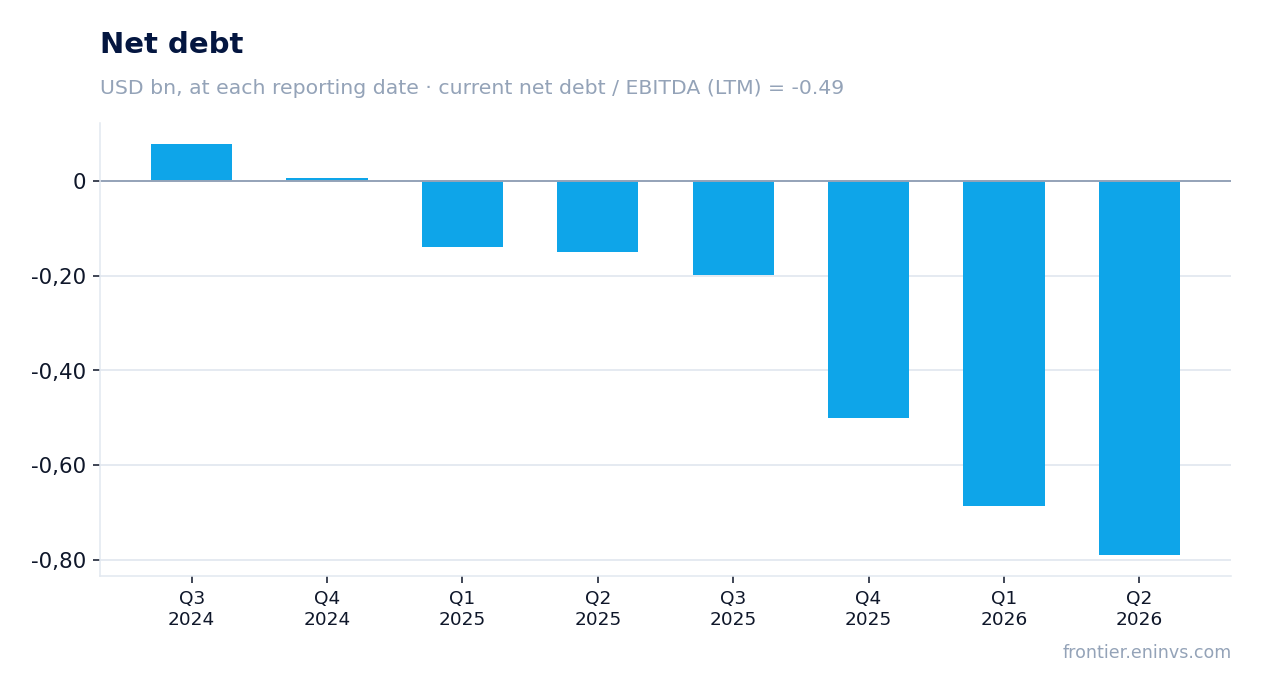
As of the end of the second quarter of 2026, First Majestic Silver's net debt stood at negative $484.7 million, meaning cash and equivalents exceed debt. This provides a substantial financial cushion. The net debt to EBITDA LTM ratio is negative 0.49, confirming the absence of leverage.
Over the past 12 months, net debt decreased by RUB 0.6 billion, and by RUB 0.1 billion compared with the previous reporting date. This dynamic reflects strong operating cash flow and possibly debt repayment.
Negative net debt is rare for a mining company and is a positive factor that reduces financial risks. However, it also means the company is not using debt leverage for growth, which may limit return on capital.
Capex rose to $59.5 million but remains below operating cash flow
Capital expenditures in the second quarter of 2026 were $59.5 million, up from $49.5 million a year earlier. The increase may be tied to project development or maintenance of existing capacity. At the same time, operating cash flow of $208.9 million comfortably covers capex.
Free cash flow (operating cash flow minus capex) remains positive at approximately $149.4 million. This allows the company to fund dividends and maintain its cash cushion without raising debt.
Higher capex is an investment in future growth, but it also reduces current returns. If metal prices remain high, these investments will pay off, but if prices reverse, they could become a burden.
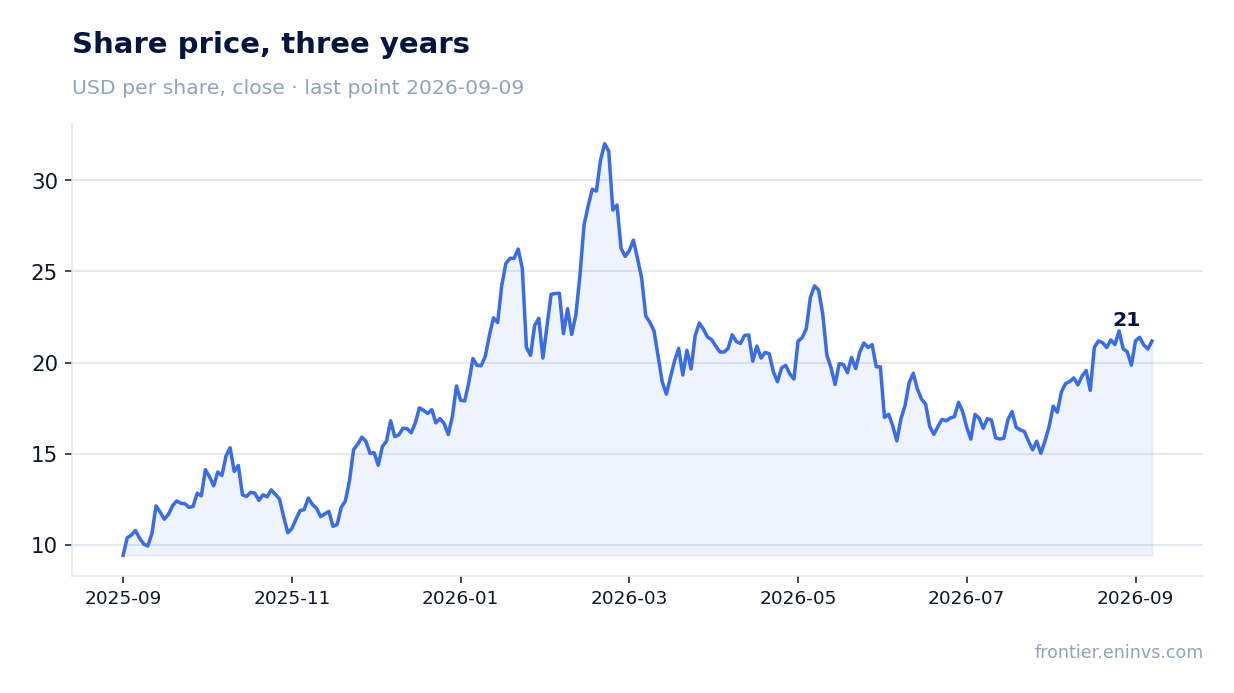
Dividend yield of 0.19% does not compensate for re-rating risk
First Majestic Silver pays dividends, but the trailing 12-month yield is only 0.19%. This is extremely low and offers little appeal to income-oriented investors. For comparison, the key rate in Russia is significantly higher, making the company's dividend story unattractive.
The company does not disclose its dividend policy in the provided facts, so it is impossible to assess its payout ratio. However, with LTM net profit of $383.5 million and a market capitalisation of $10.2 billion, even a significant increase in payouts would unlikely push the yield above 1-2%.
The dividend is not a driver for an investment decision in this stock. The main risk is further deceleration in profit growth and a decline in metal prices, which could lead to a drop in the share price.
EV/EBITDA LTM of 9.79 and the portal model point to 61% downside to fair value
First Majestic Silver's current valuation on EV/EBITDA LTM is 9.79. This is not extreme in isolation, but combined with decelerating revenue and profit growth, it appears stretched. The portal model, which re-prices EBITDA at current commodity prices against a target EV/EBITDA, implies 61% downside to fair value.
The company's market capitalisation is $10.2 billion, and LTM net profit is $383.5 million, corresponding to a P/E of 26.5. This is a high level for a mining company, especially given the cyclical nature of the industry. Return on equity (ROE) is 17.2%, which is decent but does not justify the current valuation.
A comparison with its own three-year history is not available in the provided facts, but the current multiple is likely above its average. If metal prices correct, profit could fall, pushing the multiple even higher and increasing pressure on the shares.
Valuation on the latest reported figures
| Metric | Value |
|---|---|
| Market cap | 10.2 bn USD |
| P/E (LTM) | 26.5 |
| EV/EBITDA (LTM) | 9.8 |
| P/B | 3.68 |
| Net debt / EBITDA (LTM) | -0.49 |
| Operating cash flow (LTM) | 0.53 bn |
| ROE | 17.2% |
| Dividend yield (12m) | 0.2% |
Bottom line
First Majestic Silver delivered strong second-quarter 2026 results: revenue rose 56.5%, EBITDA jumped 119.8%, net profit more than doubled, and the EBITDA margin reached 60.2%. However, growth is decelerating, operating cash flow lags EBITDA, and the dividend yield of 0.19% offers little appeal. Valuation looks stretched: EV/EBITDA LTM of 9.79 and the portal model imply 61% downside to fair value. At the current price, the shares look unattractive, and a change in verdict would require either sustained cash flow growth or a significant price correction.
Open the company's financial profile AG →
See also: market overview · valuation map · stock screeners