Alamos Gold: profit up 69.6%, but cash flow did not keep pace
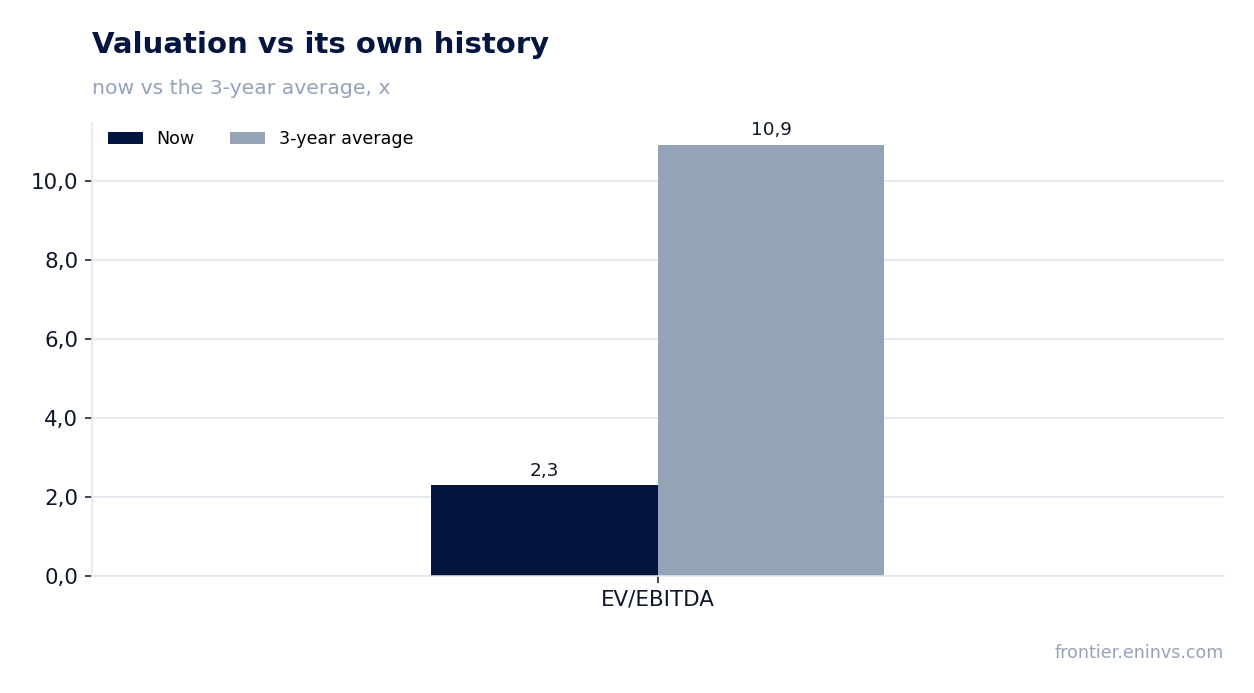
Alamos Gold reported second-quarter 2026 results. Revenue rose 35.6% year on year to $594.1 million, EBITDA by 51.3% to $406.8 million, and net profit by 69.6% to $270.4 million. The EBITDA margin climbed to 68.5% from 61.4% a year earlier, while operating cash flow stayed almost flat at $231.8 million versus $199.5 million. At an EV/EBITDA of 2.3 against its own three-year average of 10.9, the share looks rather attractive, although the portal's model points to a 13% downside to fair value.
Key takeaways
— Revenue rose 35.6% year on year to $594.1 million, but was almost flat quarter on quarter
— EBITDA margin climbed to 68.5% as gold prices outpace costs
— Net profit added 69.6% to $270.4 million, but cash flow grew only 16%
— Capex of $183.7 million almost matches operating cash flow of $231.8 million
— Net debt is negative at $427.5 million, with net debt/EBITDA LTM at -0.27
— EV/EBITDA of 2.3 versus a three-year average of 10.9 – a discount to its own history
— Dividend yield of 0.22% does not compensate for risks, but does not burden either
Attractiveness
Key figures, USD bn
| Metric | Q2 2025 | Q2 2026 | Change |
|---|---|---|---|
| Revenue | 0.44 | 0.59 | +35.6% |
| EBITDA | 0.27 | 0.41 | +51.3% |
| Operating profit | 0.22 | 0.36 | +65.3% |
| Net profit | 0.16 | 0.27 | +69.6% |
| Operating cash flow | 0.20 | 0.23 | +16.2% |
| Capex | 0.12 | 0.18 | +50.8% |
| EBITDA margin | 61.4% | 68.5% | +7.1 pp |
| Net margin | 36.4% | 45.5% | +9.1 pp |
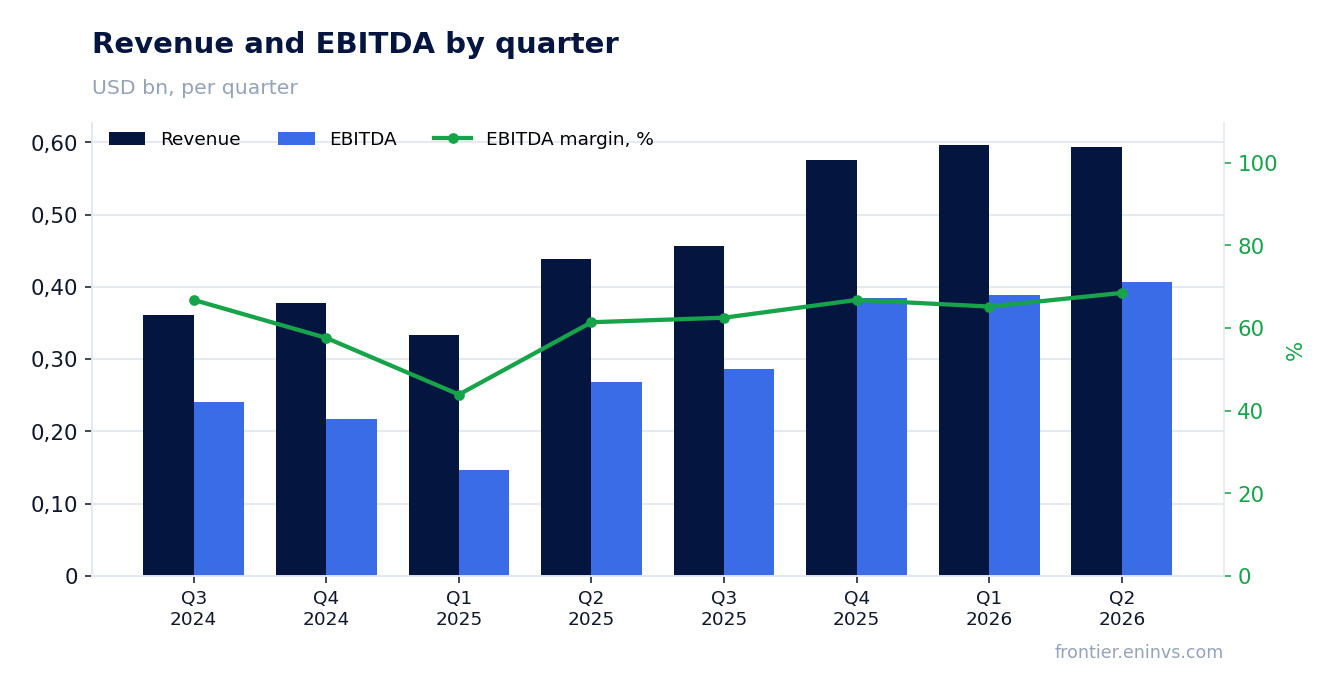
Revenue rose 35.6% year on year to $594.1 million, but was almost flat quarter on quarter
In the second quarter of 2026, Alamos Gold's revenue reached $594.1 million, up 35.6% year on year. The growth was driven mainly by gold prices: the average realised price increased, while production volumes remained stable. Compared with the first quarter of 2026, revenue was almost unchanged – $596.7 million versus $594.1 million – indicating a plateau after several quarters of rapid growth.
Annual growth slowed: in the first quarter of 2026 it was 79.2%, in the second – 35.6%. This is not a reversal but a high-base effect: in the second quarter of 2025 revenue had already jumped 31.8%. Sequential quarters of 2025–2026 show a sustained level above $550 million, confirming the ability to generate stable income even with a slight price decline.
Further growth would require either another spike in gold prices or higher production. Neither is evident in the report, so revenue is likely to remain near current levels.
EBITDA margin climbed to 68.5% as gold prices outpace costs
EBITDA in the second quarter of 2026 was $406.8 million, up 51.3% year on year. The EBITDA margin reached 68.5% versus 61.4% a year earlier. Such margin growth means revenue rose faster than costs: when gold prices increase, fixed costs remain unchanged while variable costs grow more slowly.
Operating profit rose to $357.3 million from $216.2 million a year earlier. The gap between EBITDA and operating profit – depreciation – remains significant but does not increase proportionally with revenue. This confirms that the price factor, not lower unit costs, is the main contributor to profit growth.
A margin of 68.5% is very high for gold mining. It reflects favourable market conditions. If gold prices correct, the margin could compress, but for now the trend remains upward.
Net profit added 69.6% to $270.4 million, but cash flow grew only 16%
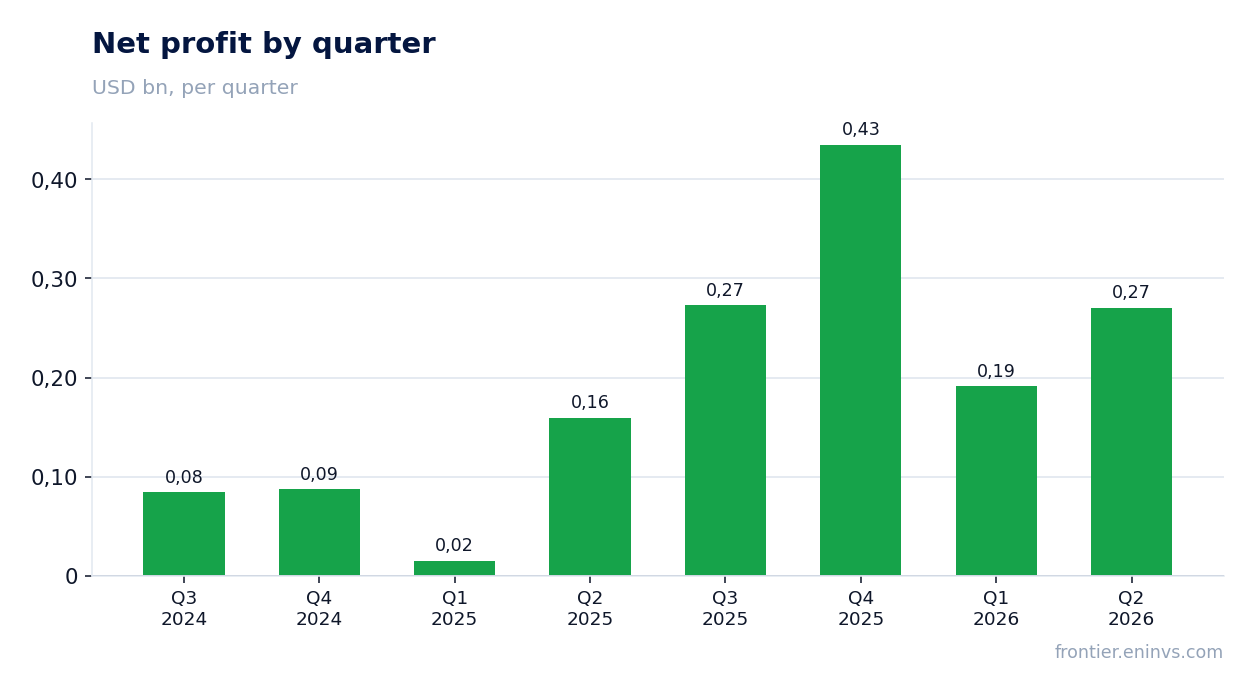
Net profit in the second quarter of 2026 was $270.4 million, up 69.6% year on year. The net margin rose to 45.5% from 36.4%. However, operating cash flow grew only to $231.8 million from $199.5 million, or 16%. The gap between profit and cash flow is explained by working capital growth and tax payments.
Over the trailing twelve months, net profit was $1,169.9 million, while operating cash flow was $795.3 million. Such a discrepancy is typical for mining companies, where a significant portion of profit is reinvested in inventories and receivables. Nevertheless, the ability to generate cash flow remains key to financing dividends and capital expenditures.
Investors should monitor working capital dynamics: if it continues to grow, cash flow may lag profit further.
Capex of $183.7 million almost matches operating cash flow of $231.8 million
Capital expenditures in the second quarter of 2026 were $183.7 million, up 51% from $121.8 million a year earlier. This is a substantial increase that almost completely absorbs operating cash flow of $231.8 million. Free cash flow therefore remains small – about $48 million for the quarter.
The rise in capex may be related to expansion projects or maintaining current capacity. With high gold prices, the company is increasing investments to boost future production. However, this limits the scope for additional dividends or share buybacks.
If capital expenditures remain at this level, free cash flow will stay moderate, which could restrain dividend growth.
Net debt is negative at $427.5 million, with net debt/EBITDA LTM at -0.27
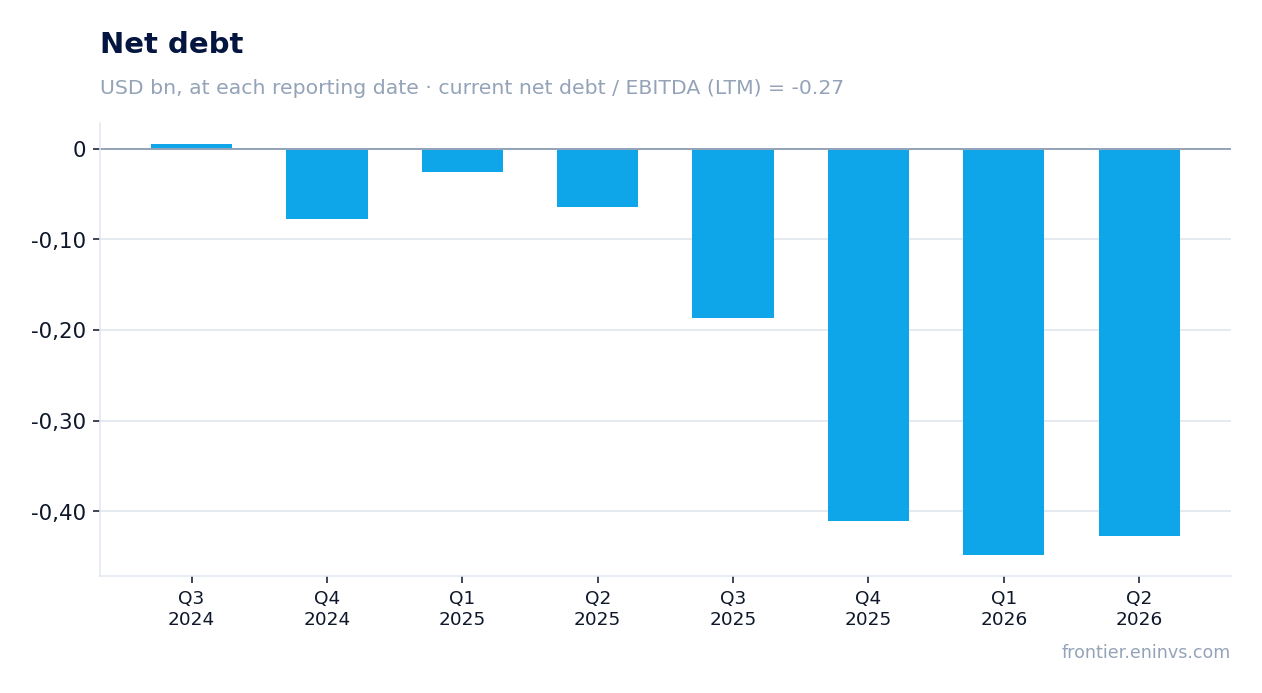
At the end of the second quarter of 2026, Alamos Gold's net debt was negative at -$427.5 million. This means cash and equivalents exceed debt obligations. Over the trailing twelve months, net debt decreased by $0.4 billion, reflecting strong operating cash flow.
The net debt/EBITDA LTM ratio is -0.27. A negative value indicates that the company has a net cash position rather than debt burden. This provides a margin of safety and the ability to finance investments without borrowing.
Given high gold prices, the company is likely to maintain its net cash position unless it makes major acquisitions.
EV/EBITDA of 2.3 versus a three-year average of 10.9 – a discount to its own history
The current EV/EBITDA LTM multiple is 2.3, significantly below the three-year average of 10.9. This gap is explained both by EBITDA growth over the trailing twelve months and by the company's relatively low market valuation. The P/E LTM is 3.2, also indicating undervaluation compared with historical levels.
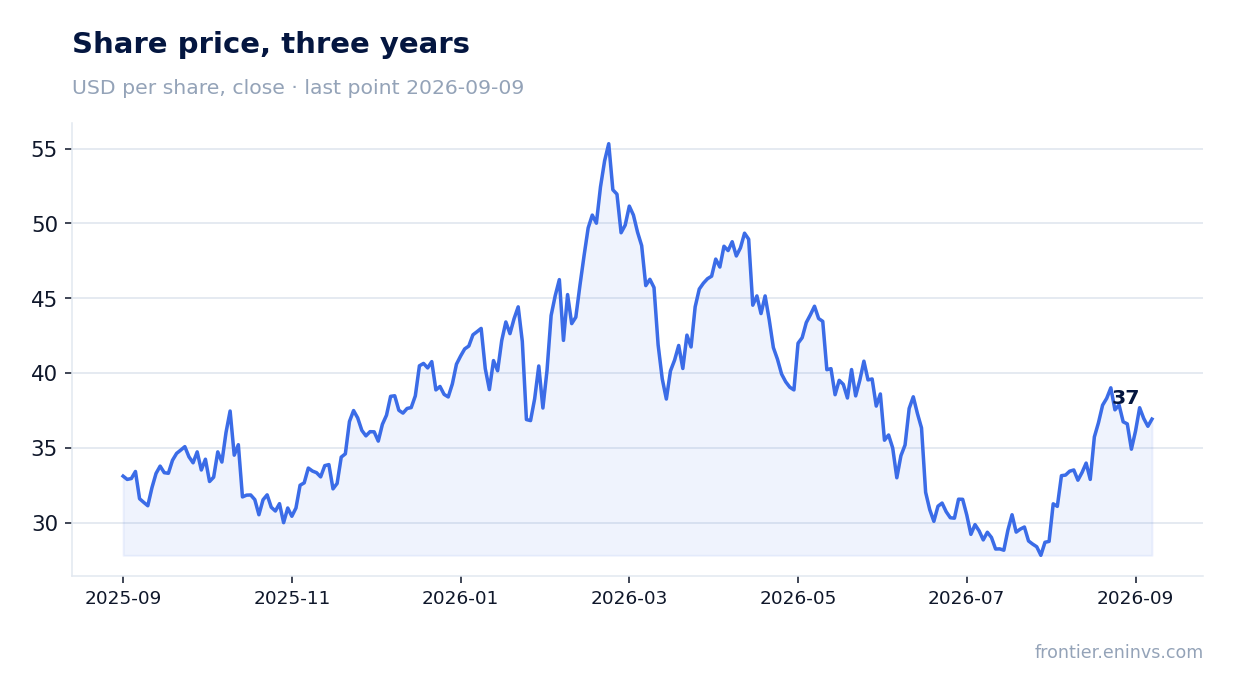
Market capitalisation is $3.8 billion, and an EV/EBITDA of 2.3 is very low for a gold miner with high margins and a net cash position. However, the portal's model, which re-prices EBITDA at current commodity prices at the target EV/EBITDA, puts fair value 13% below the current price. This means the market already prices in high gold prices, and further gains require them to exceed expectations.
Thus, the share trades at a discount to its own history, but the portal's model indicates limited upside. A re-rating would require either sustained gold price growth or higher production.
Dividend yield of 0.22% does not compensate for risks, but does not burden either
The dividend yield over the trailing twelve months is 0.22%. This is a very low level that does not play a significant role in the share's total return. The company pays modest dividends, preferring to direct most of its profit towards development and maintaining financial stability.
With LTM net profit of $1,169.9 million and a market capitalisation of $3.8 billion, dividend payments amount to about $8.2 million per year. This is less than 1% of profit, indicating a conservative dividend policy. Given high capital expenditures and production growth, such a policy is justified.
For income-oriented investors, the share is not of interest. However, the low dividend burden means the company retains flexibility to finance growth and potentially increase payouts in the future if gold prices remain high.
Valuation on the latest reported figures
| Metric | Value |
|---|---|
| Market cap | 3.80 bn USD |
| P/E (LTM) | 3.2 |
| EV/EBITDA (LTM) | 2.3 |
| P/B | 0.85 |
| Net debt / EBITDA (LTM) | -0.27 |
| Operating cash flow (LTM) | 0.80 bn |
| ROE | 23.0% |
| Dividend yield (12m) | 0.2% |
| EV/EBITDA, 3-year average | 10.9 |
Bottom line
Bottom line: Alamos Gold delivered a strong quarter – revenue up 35.6%, EBITDA up 51.3%, net profit up 69.6%, with an EBITDA margin of 68.5%. However, operating cash flow grew only 16%, and capital expenditures almost matched it. The company has a net cash position of $427.5 million and trades at an EV/EBITDA of 2.3 versus a three-year average of 10.9. The portal's model indicates a 13% downside to fair value, suggesting the market has already priced in high gold prices. The share looks rather attractive due to the discount to its own history and a strong balance sheet, but further growth requires new drivers.
Open the company's financial profile AGI →
See also: market overview · valuation map · stock screeners