The Andersons: record Renewables quarter and 45Z credits, but revenue keeps declining

On August 3, 2026, The Andersons reported results for the second quarter of 2026. Net income came in at $56.6 million, up 619.9% year over year, on revenue of $3,097.7 million (–1.2% YoY). The main driver was the Renewables segment, which posted record profit thanks to 45Z tax credits and strong demand. The shares look rather attractive: multiples are moderate, the balance sheet is solid, but revenue is stagnating, and the portal's model implies a 16% downside.
Key takeaways
— Net income multiplied by 7 thanks to a record Renewables quarter and 45Z credits of $24 million
— Revenue declines for the second consecutive quarter: –1.2% YoY in Q2 2026 after –1.2% in Q1 2026
— EBITDA margin doubled to 4.5% from 1.8% a year earlier, but remains low
— Operating cash flow in Q2 was $487.9 million — the best quarter in two years
— Net debt fell to $519.9 million, Net debt/EBITDA LTM ratio at 1.9
— Capex rose to $75.6 million for the quarter, the company invests in expansion and decarbonization
— Shares trade at P/E LTM 15.5 and EV/EBITDA LTM 10.8, the portal's model implies –16% potential
Attractiveness
Key figures, USD bn
| Metric | Q2 2025 | Q2 2026 | Change |
|---|---|---|---|
| Revenue | 3.14 | 3.10 | -1.2% |
| EBITDA | 0.06 | 0.14 | +142.2% |
| Operating profit | 0.02 | 0.05 | +101.2% |
| Net profit | 0.01 | 0.06 | +619.9% |
| Operating cash flow | 0.30 | 0.49 | +63.0% |
| Capex | 0.05 | 0.08 | +54.8% |
| EBITDA margin | 1.8% | 4.5% | +2.7 pp |
| Net margin | 0.3% | 1.8% | +1.5 pp |
Net income multiplied by 7 thanks to a record Renewables quarter and 45Z credits of $24 million
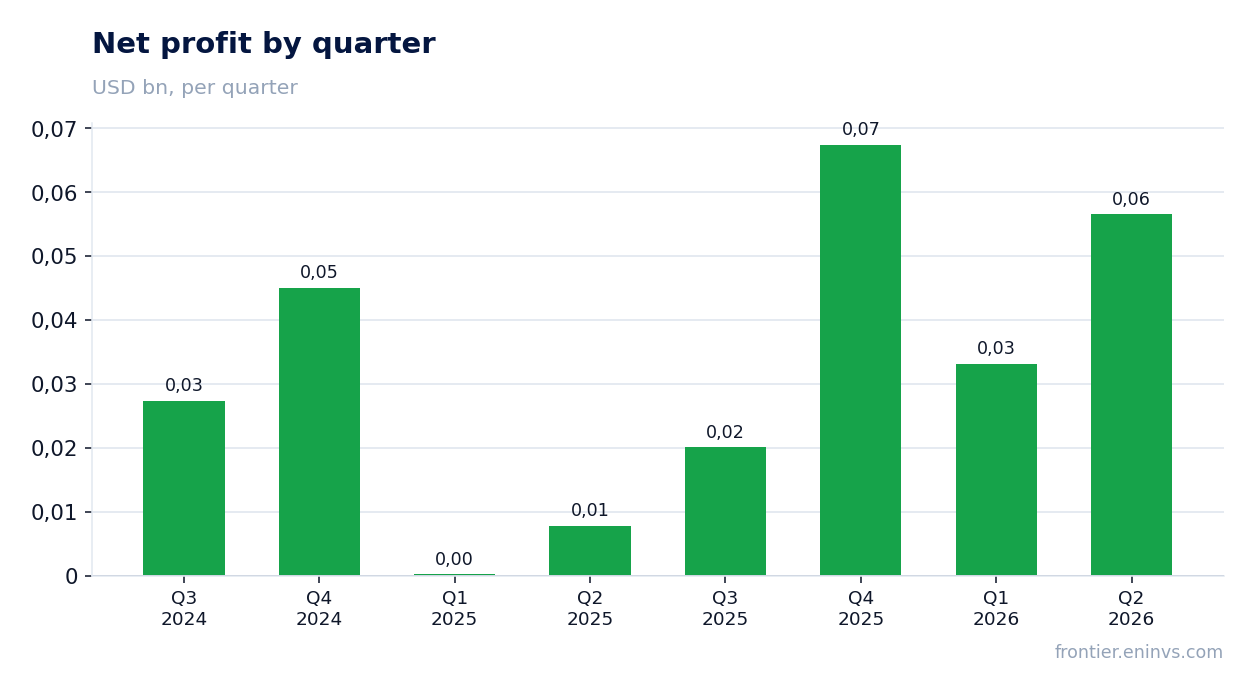
In Q2 2026, The Andersons' net income was $56.6 million versus $7.9 million a year earlier. The 619.9% increase was driven primarily by the Renewables segment, which posted record pretax income of $65 million (adjusted: $88 million). The company directly attributes the result to record plant production, strong merchandising, and 45Z tax credits, which contributed $24 million in the quarter.
In Agribusiness, pretax income rose from $18.9 million to $19.9 million, which the company explains by improved fertilizer margins. The Other segment posted a loss of $17.5 million, worse than the $11.5 million a year earlier, but this was partly offset by one-off items.
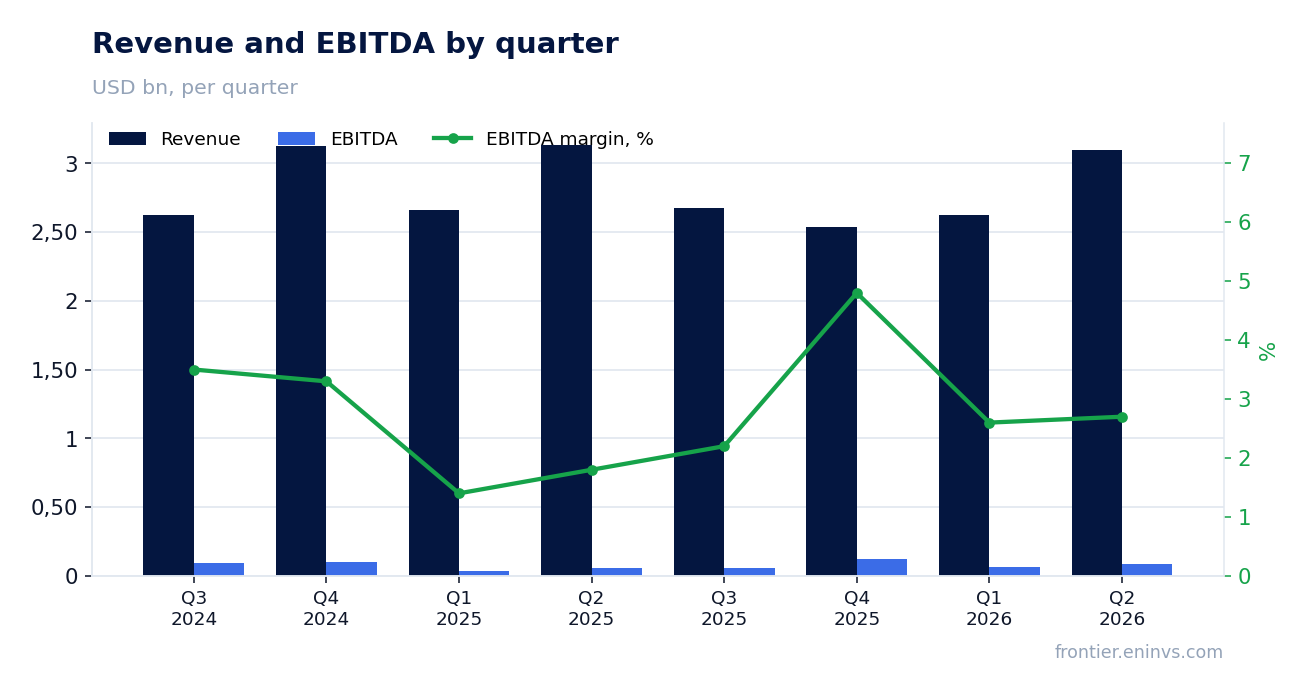
Revenue declines for the second consecutive quarter: –1.2% YoY in Q2 2026 after –1.2% in Q1 2026
Revenue in Q2 2026 was $3,097.7 million, down 1.2% year over year. This is the second consecutive quarterly decline: in Q1 2026, the drop was also 1.2%. In 2025, the dynamics were mixed, ranging from –18.8% in Q4 to +12.2% in Q2.
The revenue decline occurs alongside strong profit growth, indicating structural changes in the business mix: Renewables is increasing its share with high margins, while Agribusiness, where revenue is higher but margins are lower, is shrinking. The company notes that in Agribusiness, fertilizer volumes declined but margins improved.
EBITDA margin doubled to 4.5% from 1.8% a year earlier, but remains low
EBITDA for Q2 2026 grew 142.2% year over year to $84.6 million, resulting in a margin of 4.5% versus 1.8% a year earlier. The margin improvement stems from better results in Renewables and Agribusiness, as well as the effect of 45Z credits, which directly increase EBITDA.
However, the margin remains low in absolute terms: The Andersons' business is largely commodity trading with thin margins. Even doubling the metric leaves it at a level sensitive to fluctuations in grain and ethanol prices.
Operating cash flow in Q2 was $487.9 million — the best quarter in two years
In Q2 2026, operating cash flow reached $487.9 million versus $299.3 million a year earlier. This is the best quarterly result in at least two years. The company attributes this to strong earnings and working capital release: inventories declined and receivables decreased.
Over the trailing twelve months, operating cash flow was $321.9 million, notably higher than net income of $157.2 million — earnings quality is good, cash actually comes in.
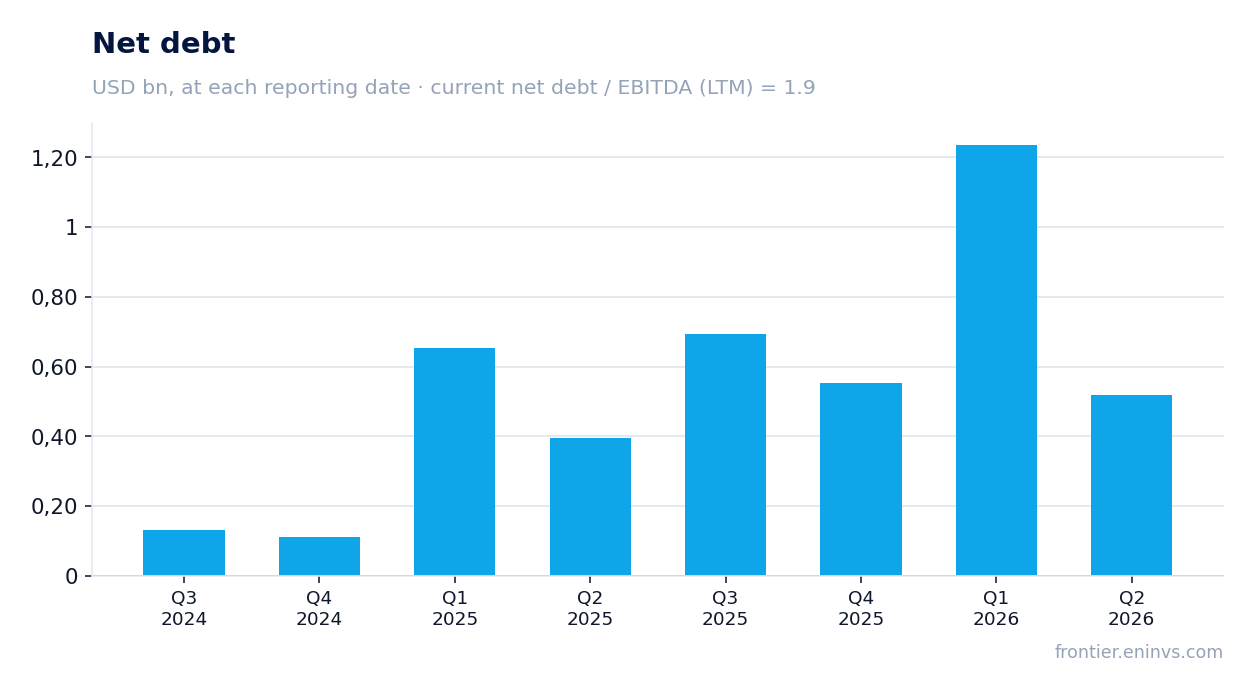
Net debt fell to $519.9 million, Net debt/EBITDA LTM ratio at 1.9
At the end of Q2 2026, net debt stood at $519.9 million, notably lower than at the end of Q1 ($1,236.7 million). The debt reduction was made possible by strong operating cash flow and working capital release.
The net debt / EBITDA ratio for the trailing twelve months is 1.9, in line with the company's target of less than 2.5. CFO Brian Valentine confirmed that the balance sheet provides flexibility to support the growth strategy.
Capex rose to $75.6 million for the quarter, the company invests in expansion and decarbonization
Capital expenditures in Q2 2026 were $75.6 million versus $48.8 million a year earlier. The increase is related to investments in capacity expansion and strategic initiatives, including the decarbonization project at the Clymers, Indiana ethanol facility and the development of export capabilities at the Port of Houston.
Despite higher capex, free cash flow remains positive: operating cash flow of $487.9 million comfortably covers investments. The dividend yield over the trailing twelve months is 1.1%, modest, but the company prefers to reinvest in growth.
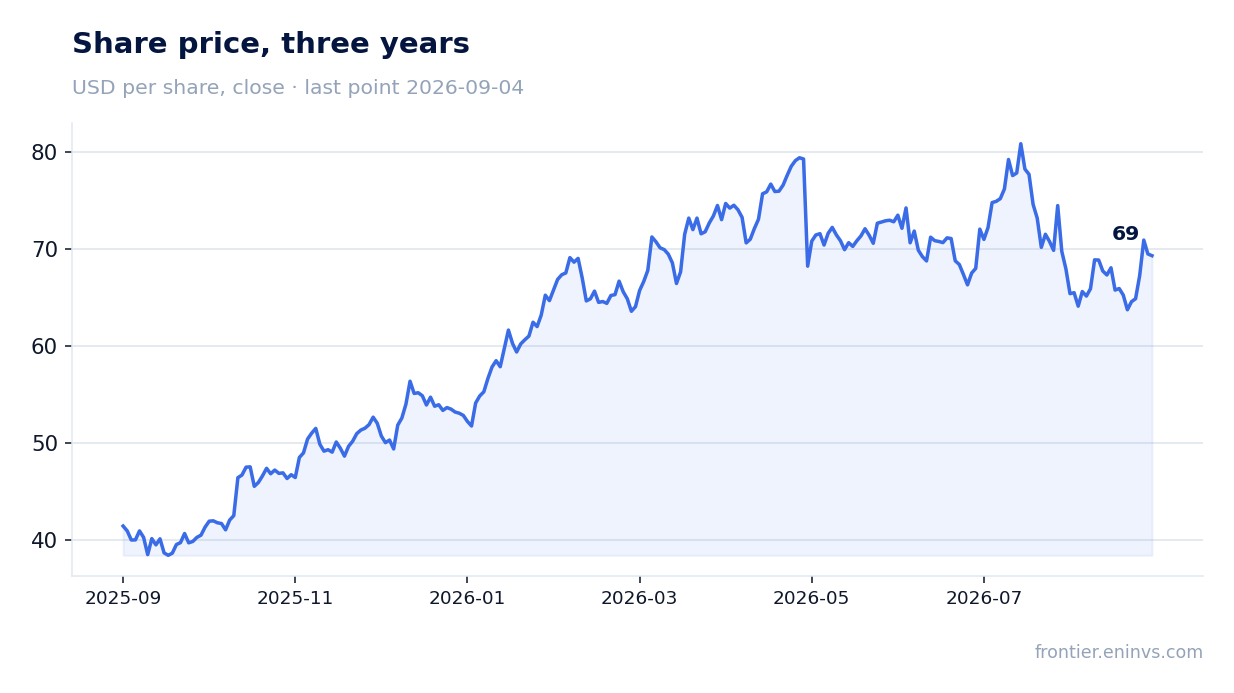
Shares trade at P/E LTM 15.5 and EV/EBITDA LTM 10.8, the portal's model implies –16% potential
The Andersons' market capitalization is $2,440.5 million. The P/E LTM multiple is 15.5, EV/EBITDA LTM is 10.8. These are moderate values for a company with improving profitability and a solid balance sheet, but not cheap.
Our portal's model, which re-prices EBITDA at current commodity prices and applies a target EV/EBITDA, shows the share has a downside to its fair value of 16%. This means the current price already reflects much of the positive expectations. The share is held in the Global Commodities (potential) strategy on the portal, reflecting its fit with the strategy's screen, but this is not a recommendation.
Valuation on the latest reported figures
| Metric | Value |
|---|---|
| Market cap | 2.44 bn USD |
| P/E (LTM) | 15.5 |
| EV/EBITDA (LTM) | 10.8 |
| P/B | 1.85 |
| Net debt / EBITDA (LTM) | 1.90 |
| Operating cash flow (LTM) | 0.32 bn |
| ROE | 17.5% |
| Dividend yield (12m) | 1.1% |
Bottom line
The quarter was strong: profit multiplied by 7, operating cash flow hit a two-year high, and debt declined. However, the drivers were 45Z credits and record Renewables results — these factors may be one-off or dependent on regulatory support. Revenue is stagnating, and the portal's model suggests the shares are overvalued by 16%. At P/E 15.5 and EV/EBITDA 10.8, the shares look rather attractive for a long-term investor, but upside is limited unless ethanol market conditions improve or new credits emerge.
Open the company's financial profile ANDE →
See also: market overview · valuation map · stock screeners