BRF S.A.: double-digit revenue growth, but quarterly profit and margin declined
BRF S.A. reported second-quarter 2026 results. Revenue rose 14.1% year on year to USD 3,144.4 million, EBITDA added 10.3%, while net profit fell 18.6% to USD 107.3 million. The EBITDA margin was 15.5% versus 16.0% a year earlier, and the net margin was 3.4% versus 4.8%. At the current price, the shares look neutral: leverage of 1.47x EBITDA and EV/EBITDA of 2.99 appear low, but the profit decline and the portal model's negative fair-value estimate (–32%) offset each other.
Key takeaways
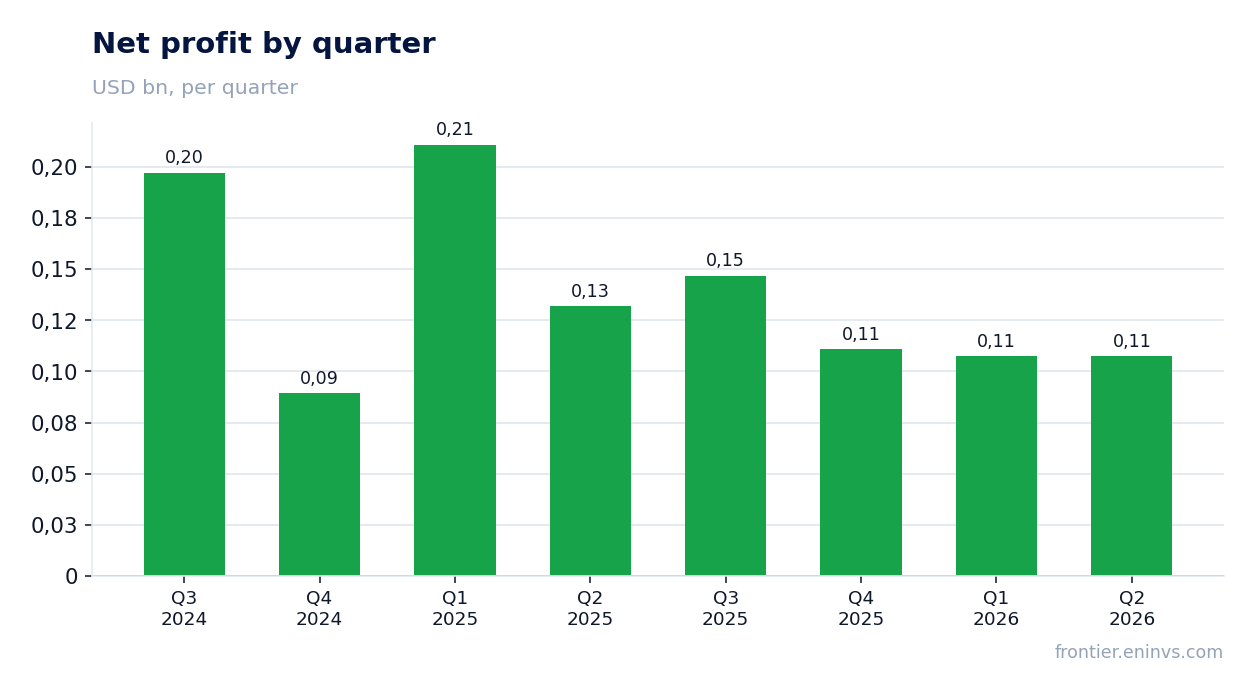
— Q2 2026 revenue rose 14.1% year on year to USD 3,144.4 million, but net profit fell 18.6% to USD 107.3 million
— The quarterly EBITDA margin declined to 15.5% from 16.0% a year earlier, and the net margin to 3.4% from 4.8%
— Leverage stands at 1.47x EBITDA, while net debt over 12 months increased by USD 1.9 billion
— Operating cash flow over the last 12 months was USD 1,900.0 million, with quarterly capital expenditure of USD 212.8 million
— According to the portal's model, the shares are 32% above fair value, limiting upside potential
— Dividend history and policy are not disclosed in the provided facts, so the dividend factor is not included in the assessment
Attractiveness
Key figures, USD bn
| Metric | Q2 2025 | Q2 2026 | Change |
|---|---|---|---|
| Revenue | 2.76 | 3.14 | +14.1% |
| EBITDA | 0.44 | 0.49 | +10.3% |
| Operating profit | 0.28 | 0.30 | +5.2% |
| Net profit | 0.13 | 0.11 | -18.6% |
| Operating cash flow | 0.46 | 0.48 | +4.1% |
| Capex | 0.20 | 0.21 | +8.3% |
| EBITDA margin | 16.0% | 15.5% | -0.5 pp |
| Net margin | 4.8% | 3.4% | -1.4 pp |
Q2 2026 revenue rose 14.1% year on year to USD 3,144.4 million, but net profit fell 18.6% to USD 107.3 million
BRF S.A.'s revenue in Q2 2026 was USD 3,144.4 million, up 14.1% from a year earlier. This extends a strong growth streak: revenue rose 10.7% in Q1 2026 and 68.6% in Q4 2025. Top-line growth has now continued for four consecutive quarters, indicating persistent favourable market conditions.
However, quarterly net profit fell 18.6% year on year to USD 107.3 million. This divergence between revenue and profit points to cost pressures or higher non-operating expenses. Operating profit for the quarter was USD 298.2 million, up from USD 283.4 million a year earlier, but net profit came in lower due to factors outside operations.
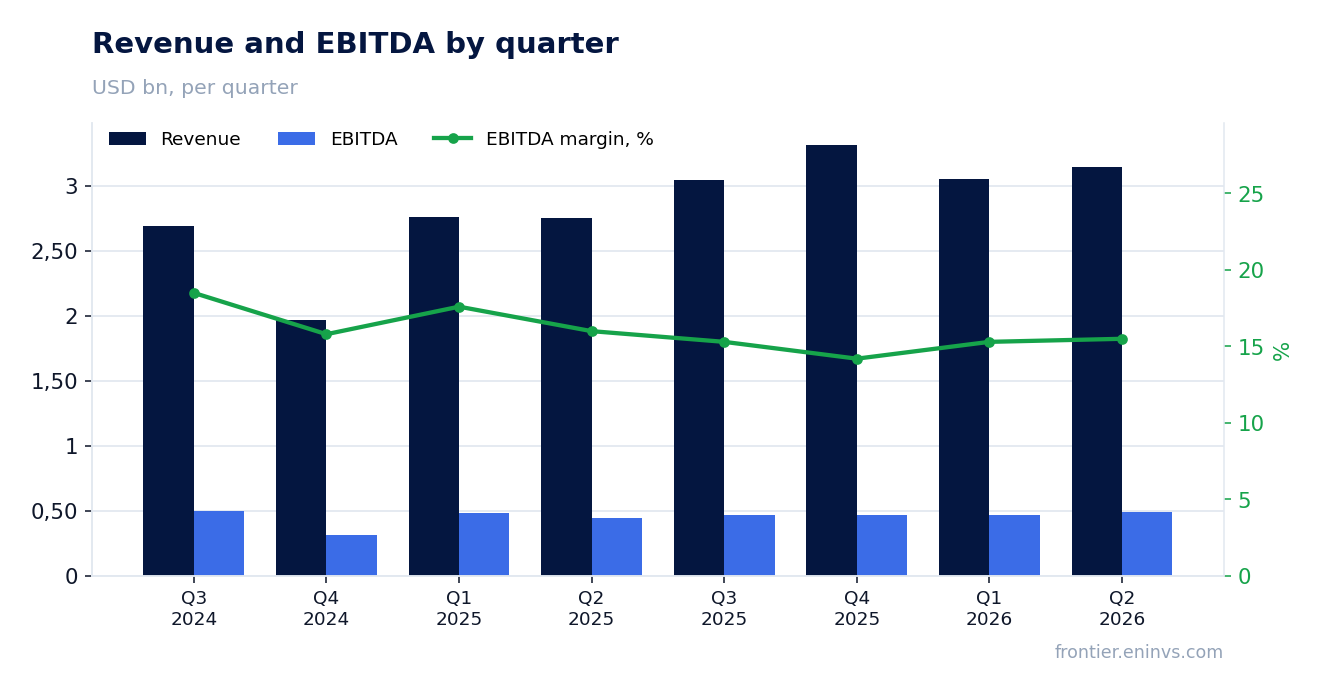
The quarterly EBITDA margin declined to 15.5% from 16.0% a year earlier, and the net margin to 3.4% from 4.8%
Q2 2026 EBITDA was USD 487.5 million, up 10.3% year on year. However, the EBITDA margin declined to 15.5% from 16.0% a year earlier. This means revenue growth did not fully translate into EBITDA growth – revenue rose 14.1% while EBITDA rose only 10.3%.
The net margin contracted more sharply, to 3.4% from 4.8% a year earlier. This decline reflects an 18.6% drop in net profit while revenue grew 14.1%. It points to higher expenses below operating profit, possibly interest or taxes.
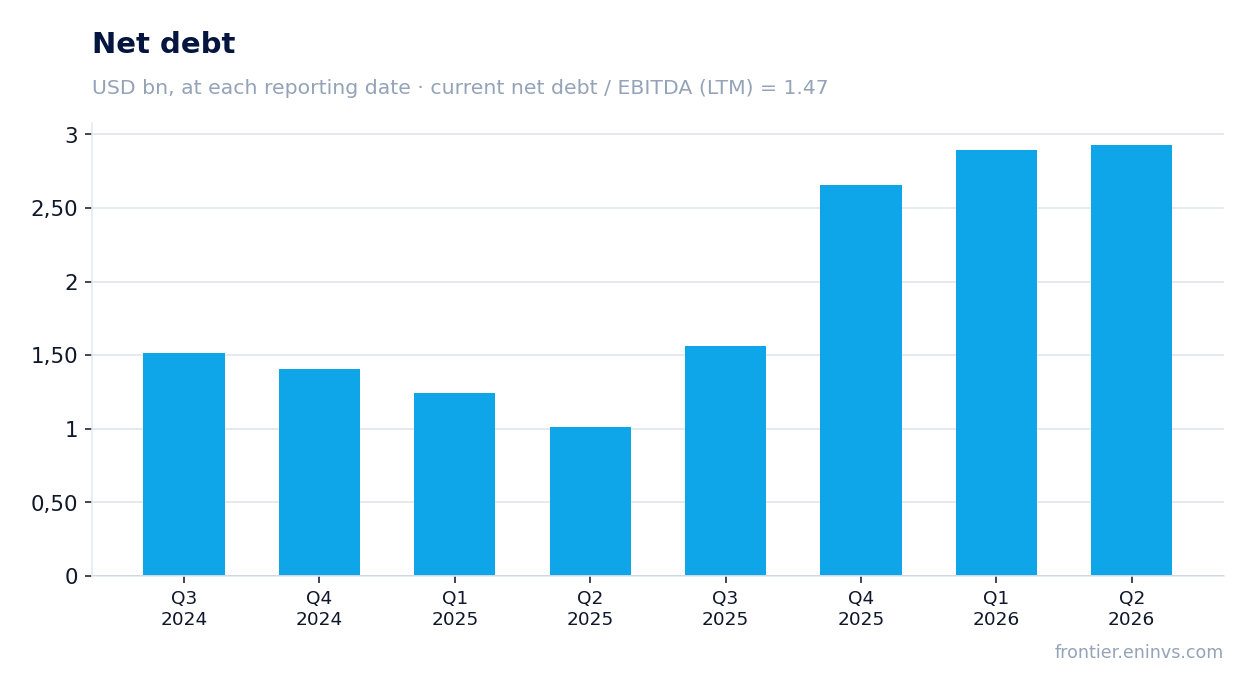
Leverage stands at 1.47x EBITDA, while net debt over 12 months increased by USD 1.9 billion
BRF S.A.'s net debt at the end of Q2 2026 was USD 2,929.9 million, up USD 1.9 billion over the last 12 months. The net debt to EBITDA ratio for the trailing twelve months stands at 1.47. This is a moderate burden that does not raise immediate concerns, but the absolute increase in debt warrants attention.
The rise in net debt occurred alongside revenue and EBITDA growth, which kept the ratio at 1.47. However, if debt continues to grow at this pace, it could limit the company's financial flexibility.
Operating cash flow over the last 12 months was USD 1,900.0 million, with quarterly capital expenditure of USD 212.8 million
Operating cash flow over the trailing twelve months was USD 1,900.0 million. This is below the sum of operating cash flows for the previous four quarters, which may indicate deteriorating cash conversion. In Q2 2026, operating cash flow was USD 480.5 million, up from USD 461.7 million a year earlier.
Capital expenditure in Q2 2026 was USD 212.8 million, up from USD 196.4 million a year earlier. The increase in capex may reflect investments in maintenance or expansion. Free cash flow for the quarter was therefore approximately USD 267.7 million.
According to the portal's model, the shares are 32% above fair value, limiting upside potential
According to the portal's model, the fair value of BRF S.A. shares is 32% below the current market price. This means that, in our assessment, the shares trade at a premium to fair value. The model incorporates current commodity prices and a target EV/EBITDA multiple.
The current trailing twelve-month EV/EBITDA multiple is 2.99, and the P/E is 5.78. These values appear low, but the portal's model indicates that the market has already priced in a favourable scenario. The decline in profit and margin could lead to further valuation correction.
Dividend history and policy are not disclosed in the provided facts, so the dividend factor is not included in the assessment
The provided facts do not include information on BRF S.A.'s dividend payments for previous periods or its dividend policy. Therefore, we cannot assess dividend yield or the sustainability of payouts.
For income-oriented investors, this creates uncertainty. Without data on the payout ratio and payment history, it is impossible to judge the attractiveness of the shares from a dividend perspective.
Valuation on the latest reported figures
| Metric | Value |
|---|---|
| Market cap | 2.73 bn USD |
| P/E (LTM) | 5.8 |
| EV/EBITDA (LTM) | 3.0 |
| P/B | 1.00 |
| Net debt / EBITDA (LTM) | 1.47 |
| Operating cash flow (LTM) | 1.90 bn |
| ROE | 14.1% |
Bottom line
Bottom line: BRF S.A. delivered strong revenue growth of 14.1% year on year, but net profit fell 18.6% and the EBITDA margin narrowed to 15.5%. Leverage remains moderate at 1.47x EBITDA, yet net debt increased by USD 1.9 billion over 12 months. According to the portal's model, the shares are 32% above fair value, limiting upside potential. At the current price, the shares look neutral: positive operating metrics are offset by lower profit and a negative model valuation.
Open the company's financial profile BRFS →
See also: market overview · valuation map · stock screeners