Black Stone Minerals: a third of Q2 profit is an unrealised hedge revaluation while production declines
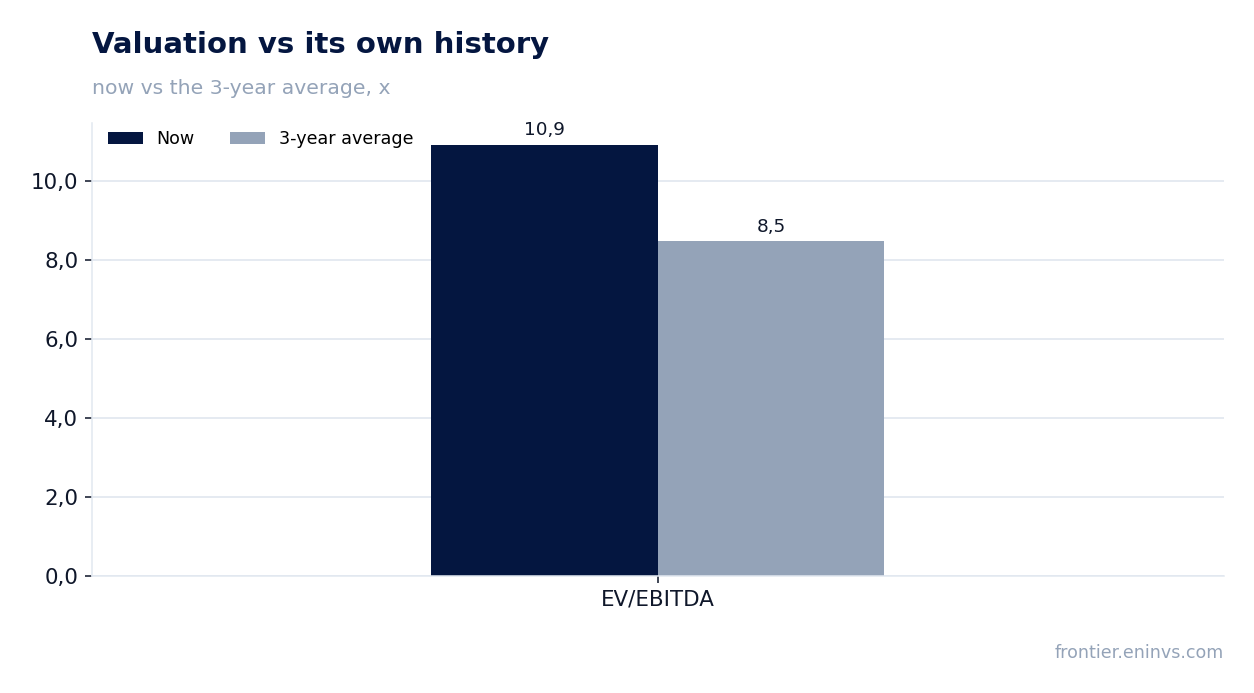
On 4 August Black Stone Minerals reported second-quarter 2026 results. Revenue fell 23.4% year on year to $122.1 million, EBITDA declined 29.5% to $92.6 million and net income slipped 11.4% to $106.4 million. Yet $35.6 million of that profit is an unrealised paper gain on derivative revaluation, while mineral and royalty production dropped 9% from the prior quarter. The shares trade at 11.1 times trailing earnings and 10.9 times trailing EBITDA against a three-year average of 8.5 times EBITDA, making the stock unattractive at the current level.
Key takeaways
— Revenue fell 23.4% year on year but doubled quarter on quarter on oil
— EBITDA margin compressed to 75.8% from 82.4% a year earlier on higher G&A
— A third of net income is a $35.6 million unrealised gain on hedges
— Mineral and royalty production fell 9% from Q1 on Haynesville weakness
— Distribution rose 7% to $0.32 per unit with 1.18x coverage
— Debt rose to $196 million but fell to $168 million by end-July
— EV/EBITDA of 10.9 is above the three-year average of 8.5
Attractiveness
Key figures, USD bn
| Metric | Q2 2025 | Q2 2026 | Change |
|---|---|---|---|
| Revenue | 0.16 | 0.12 | -23.4% |
| EBITDA | 0.13 | 0.09 | -29.5% |
| Operating profit | 0.12 | 0.08 | -31.9% |
| Net profit | 0.12 | 0.11 | -11.4% |
| Operating cash flow | 0.08 | 0.09 | +15.5% |
| Capex | 0.00 | 0.03 | +17361.9% |
| EBITDA margin | 82.4% | 75.8% | -6.6 pp |
| Net margin | 75.3% | 87.1% | +11.8 pp |
Revenue fell 23.4% year on year but doubled quarter on quarter on oil
Revenue from contracts with customers in Q2 2026 was $122.1 million, down 23.4% from Q2 2025. However, compared to Q1 2026, revenue more than doubled from $59.4 million. This gap is explained by the first quarter being weak on both oil prices and volumes, while in Q2 the average realised price rose 17% year on year to $37.82 per barrel of oil equivalent.
Oil and condensate contributed the bulk of revenue at $75.2 million, or 65% of the total. A year earlier oil revenue was $55.8 million. The rise in oil prices from $64.67 to $87.08 per barrel outweighed lower production. Natural gas and NGLs brought in $40.3 million versus $46.2 million a year earlier, reflecting lower Haynesville volumes.
Lease bonus and other income rose to $6.7 million from $4.7 million a year earlier. This is a small but growing revenue stream independent of current commodity prices. Overall, the revenue mix shifted towards oil, which drove the quarterly increase but did not offset the annual decline caused by lower overall volumes.
EBITDA margin compressed to 75.8% from 82.4% a year earlier on higher G&A
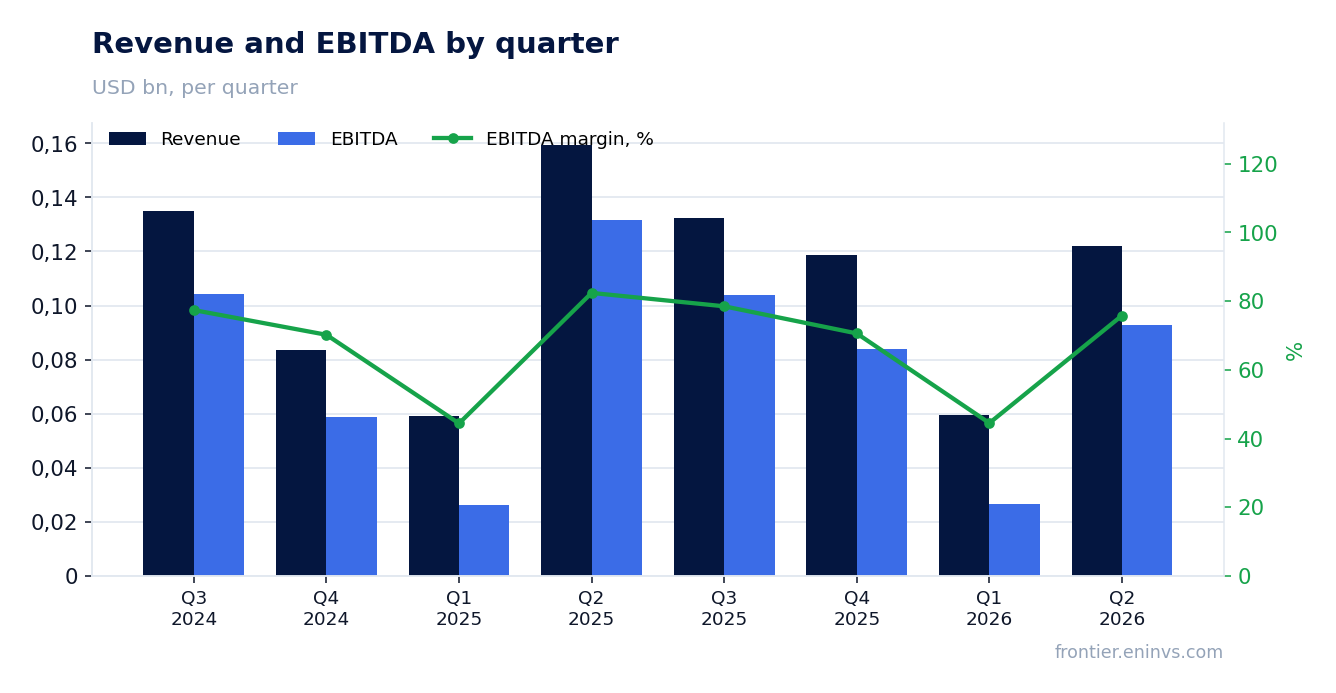
EBITDA in Q2 2026 was $92.6 million, down 29.5% year on year. With revenue of $122.1 million, the EBITDA margin was 75.8% versus 82.4% in Q2 2025. The 6.6 percentage point compression came not from production costs but from higher G&A and exploration expenses.
General and administrative expenses rose to $16.1 million from $13.9 million a year earlier, or from $4.42 to $5.27 per barrel of oil equivalent. Exploration expenses jumped to $4.8 million from $1.7 million, largely due to seismic data costs, which the company now excludes from EBITDA. Production costs and ad valorem taxes, by contrast, fell to $6.1 million from $9.0 million, reflecting lower production.
Thus, the pressure on margin came from discretionary items – G&A and exploration – rather than operational efficiency. If these expenses normalise, the margin could recover, but for now the trend is negative.
A third of net income is a $35.6 million unrealised gain on hedges
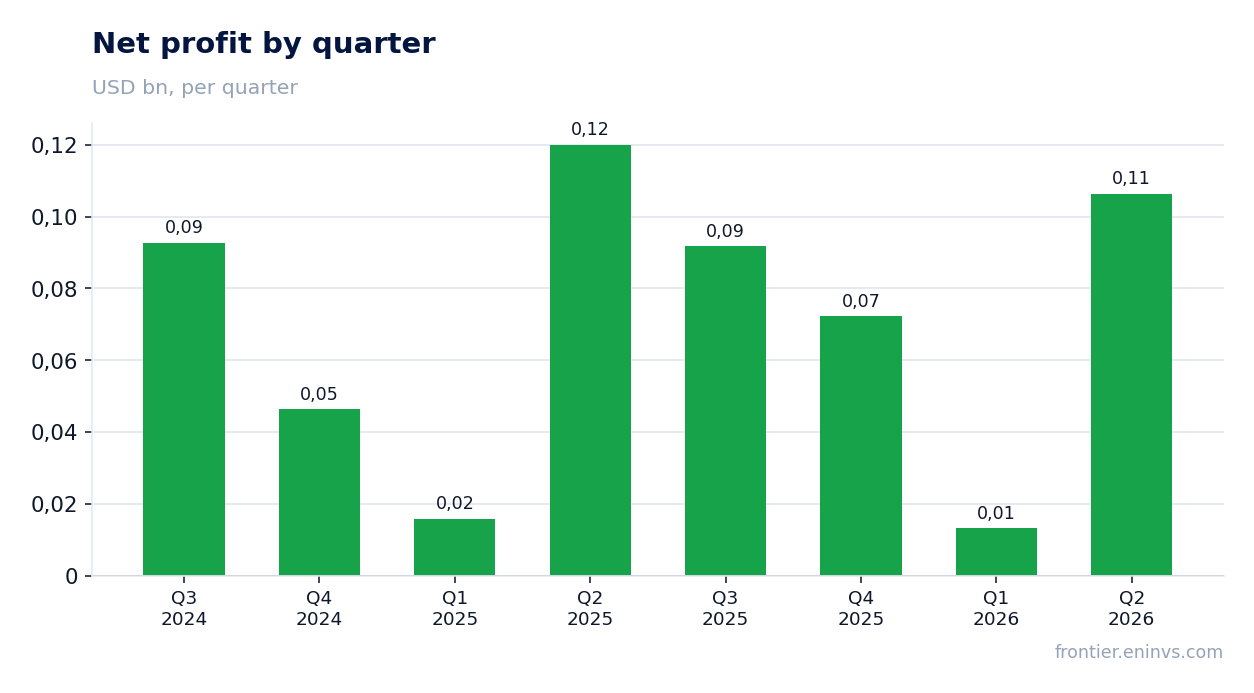
Net income in Q2 2026 was $106.4 million, down 11.4% from Q2 2025. However, the decline would have been much sharper without a $35.6 million unrealised gain on derivative revaluation. This gain is paper-only – it reflects changes in the fair value of hedge contracts, not actual cash receipts.
Excluding this unrealised gain, net income would have been about $70.8 million, down 41% from $120.0 million a year earlier. Realised hedge settlements resulted in a loss of $8.8 million. Thus, the hedging programme overall added $26.8 million to profit, but this is mostly a non-cash effect.
For investors, it is important to separate operating profit from derivative volatility. The company itself reports Adjusted EBITDA of $91.3 million, which is closer to cash flow. That figure rose 6.7% year on year, indicating that operations remain profitable despite the revenue decline.
Mineral and royalty production fell 9% from Q1 on Haynesville weakness
Mineral and royalty production in Q2 2026 averaged 32.5 MBoe/d, down 9% from Q1 2026 and 2% below Q2 2025. Total production including working-interest volumes was 33.5 MBoe/d. The decline was primarily due to lower natural gas volumes in the Haynesville.
Working-interest production also fell to 1.0 MBoe/d from 1.1 MBoe/d in Q1 and 1.4 MBoe/d a year earlier. This is a small portion but it continues to shrink. The company attributes the decline to natural well depletion and reduced operator activity.
Nevertheless, the company notes progress in developing new areas. Adamas Energy (formerly Aethon) drilled 14 wells in the past programme year, of which 6 have been turned to sales. Revenant Energy spudded two additional wells in Q2. Caturus Energy began drilling a pilot well in Cherokee County. These projects could support production in the future, but for now the current trend is downward.
Distribution rose 7% to $0.32 per unit with 1.18x coverage
The board approved a quarterly distribution of $0.32 per unit, up 7% from the prior quarter. Annualised, this is $1.28 per unit. The payment will be made on 13 August 2026 to unitholders of record as of 6 August. The distribution coverage ratio was 1.18x, meaning cash flow comfortably covers the payout.
Distributable cash flow for the quarter was $80.4 million, up 5.6% from Q2 2025. This occurred despite lower revenue, thanks to reduced production costs and higher Adjusted EBITDA. The company maintains a conservative balance sheet approach, increasing payouts with coverage above 1x.
The trailing 12-month dividend yield is 8.19% on the share price. This is above the key rate, making the stock attractive for income investors. However, the distribution could be cut if commodity prices fall or production continues to decline.
Debt rose to $196 million but fell to $168 million by end-July
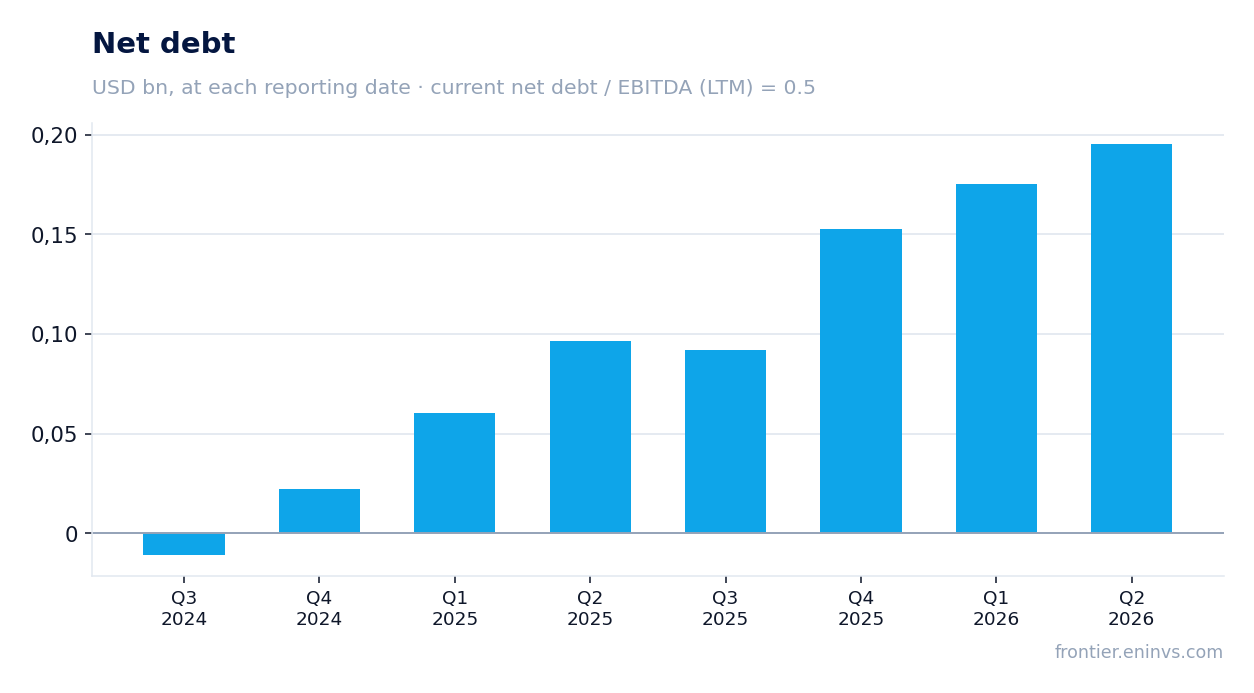
At the end of Q2 2026, total debt under the credit facility was $196.0 million, with cash of $1.7 million. This is higher than at the end of Q1, when debt was $175.4 million. The increase was driven by funding $37.2 million of mineral interest acquisitions during the quarter.
However, by 31 July 2026, debt had fallen to $168.0 million and cash had risen to $1.9 million. This indicates strong cash flow in July. The company confirmed compliance with all financial covenants. The borrowing base was reaffirmed at $580.0 million, with total commitments at $375.0 million.
The net debt to EBITDA ratio for the trailing 12 months is 0.5x. This is a low level, giving the company flexibility for further acquisitions. Interest expense rose to $3.8 million from $2.3 million a year earlier due to higher debt and rates.
EV/EBITDA of 10.9 is above the three-year average of 8.5
The current EV/EBITDA for the trailing 12 months is 10.9. This is notably above the three-year average of 8.5. The 28% gap suggests the market values the company more richly than historically. The trailing P/E is 11.1, which may also be above historical levels, but we do not have a three-year average for that multiple.
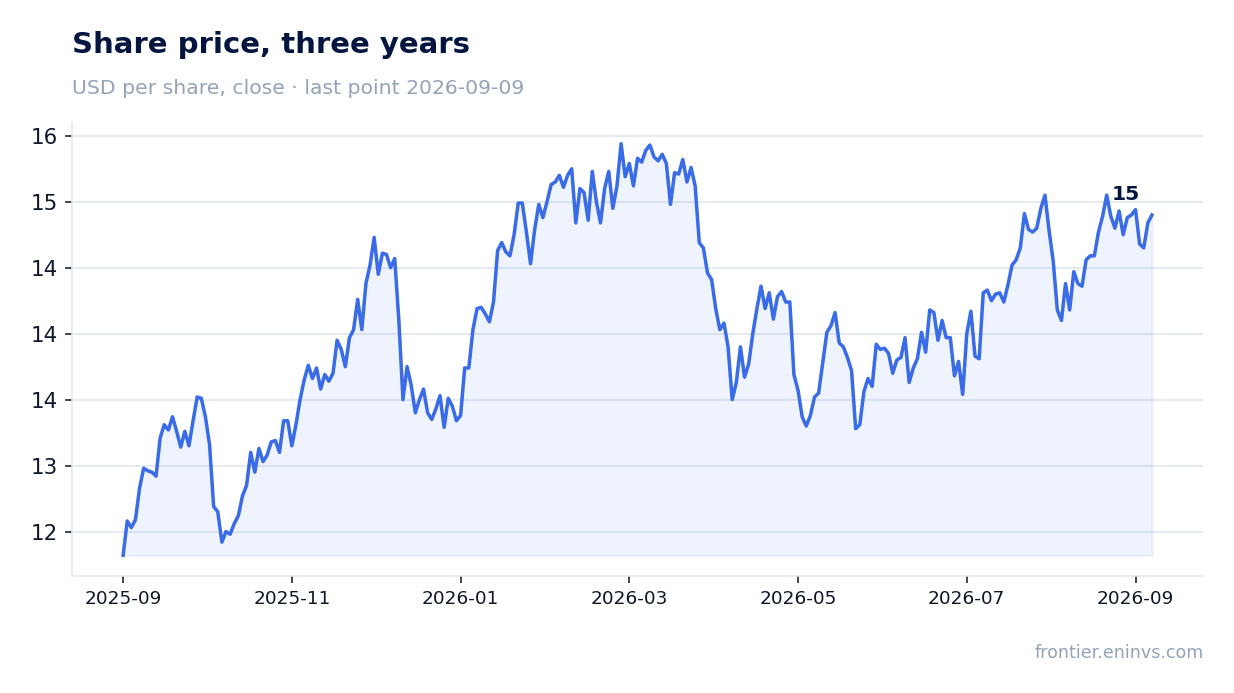
Market capitalisation at the time of the report is $3.15 billion. The share price before the release was $15.05, fell 1.8% on the release day, and has declined a further 1.0% from the release to 9 September. The market reaction was muted despite the distribution increase.
According to the portal's model, which re-prices EBITDA at current commodity prices at the target EV/EBITDA, the upside to fair value is minus 68%. This means that even with current commodity prices, the stock appears overvalued. We do not provide a target price, but note that the multiple is above its historical average and the model points to a significant downside.
Valuation on the latest reported figures
| Metric | Value |
|---|---|
| Market cap | 3.15 bn USD |
| P/E (LTM) | 11.1 |
| EV/EBITDA (LTM) | 10.9 |
| P/B | 3.81 |
| Net debt / EBITDA (LTM) | 0.50 |
| Operating cash flow (LTM) | 0.31 bn |
| ROE | 110.0% |
| Dividend yield (12m) | 8.2% |
| EV/EBITDA, 3-year average | 8.5 |
Bottom line
In Q2 2026 Black Stone Minerals reported year-on-year declines in revenue and EBITDA, but quarter-on-quarter growth on higher oil prices. Net income fell less than operating metrics due to a $35.6 million unrealised hedge gain, which is non-cash. The distribution was raised 7% with 1.18x coverage, supporting dividend appeal. However, the EV/EBITDA multiple of 10.9 exceeds the three-year average of 8.5, and the portal model indicates a 68% downside to fair value. The key question for a holder is whether the company can halt production declines and justify the current valuation.
Open the company's financial profile BSM →
See also: market overview · valuation map · stock screeners