Cameco: Q2 profit down 92%, yet valuation still implies growth

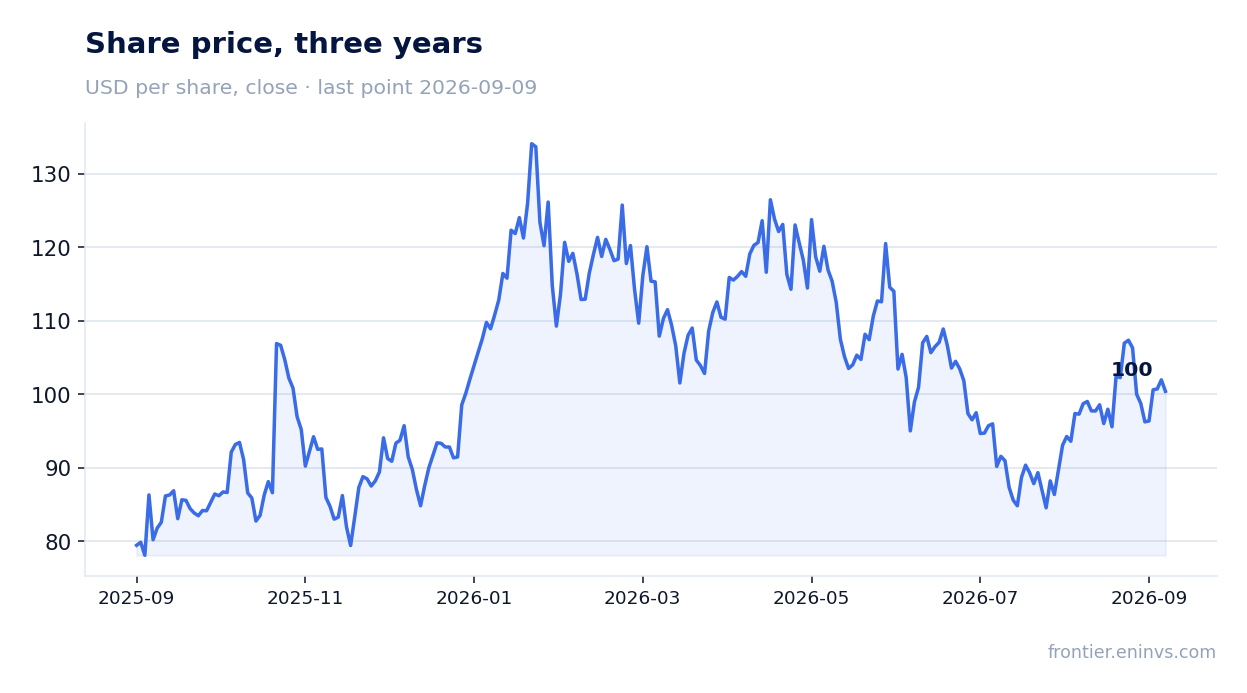
On August 31, Cameco reported Q2 2026 results: revenue fell 5.6% YoY to $592.7 million, EBITDA dropped 47.4% to $106.6 million, and net profit plunged 92.0% to $18.4 million. Despite this performance, shares trade at an EV/EBITDA multiple of 72.8 versus a three-year average of 45.4, making them unattractive at the current price.
Key takeaways
— Q2 revenue fell 5.6% YoY to $592.7 million, after growing 9.0% in Q1
— EBITDA dropped 47.4% YoY to $106.6 million, with margin contracting from 28.8% to 16.0%
— Net profit in Q2 was only $18.4 million versus $229.6 million a year earlier
— Operating cash flow for the quarter was $95.4 million, but $675.4 million over the trailing twelve months
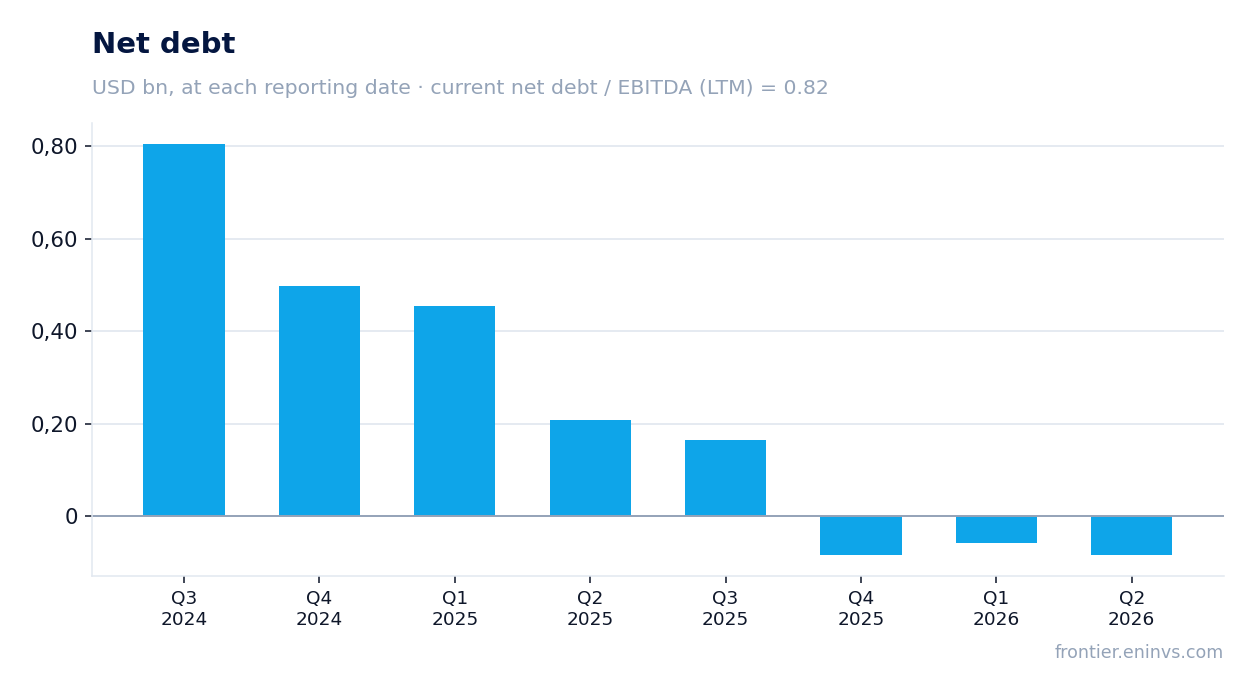
— Net debt on the balance sheet is $499.4 million, with net debt/EBITDA at 0.82
— Dividend yield over the trailing twelve months is just 0.17%, below the key rate
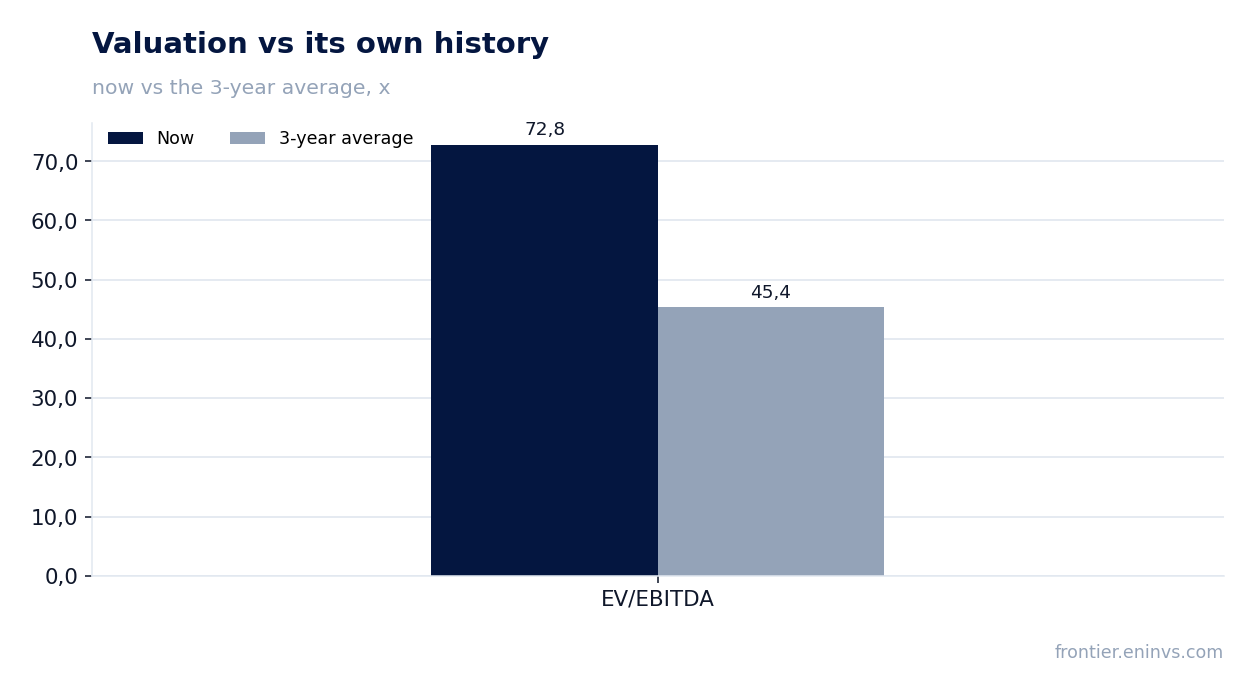
— Valuation: EV/EBITDA of 72.8 versus three-year average of 45.4, and the portal's model implies 81% downside
Attractiveness
Key figures, USD bn
| Metric | Q2 2025 | Q2 2026 | Change |
|---|---|---|---|
| Revenue | 0.63 | 0.59 | -5.6% |
| EBITDA | 0.18 | 0.10 | -47.4% |
| Operating profit | 0.12 | 0.05 | -54.5% |
| Net profit | 0.23 | 0.02 | -92.0% |
| Operating cash flow | 0.33 | 0.10 | -71.3% |
| Capex | 0.05 | — | — |
| EBITDA margin | 28.8% | 16.0% | -12.8 pp |
| Net margin | 36.6% | 3.1% | -33.5 pp |
Q2 revenue fell 5.6% YoY to $592.7 million, after growing 9.0% in Q1
In Q2 2026, Cameco's revenue was $592.7 million, 5.6% lower than a year earlier. This is the first negative annual growth rate in four quarters: in Q1 2026 growth was +9.0%, and in Q2 2025 it was +43.6%.
The revenue decline occurred amid lower sales volumes and uranium prices, although the company did not disclose segment details. Over the trailing twelve months, revenue was $2,500.0 million, reflecting generally stable demand, but quarterly dynamics point to a slowdown.
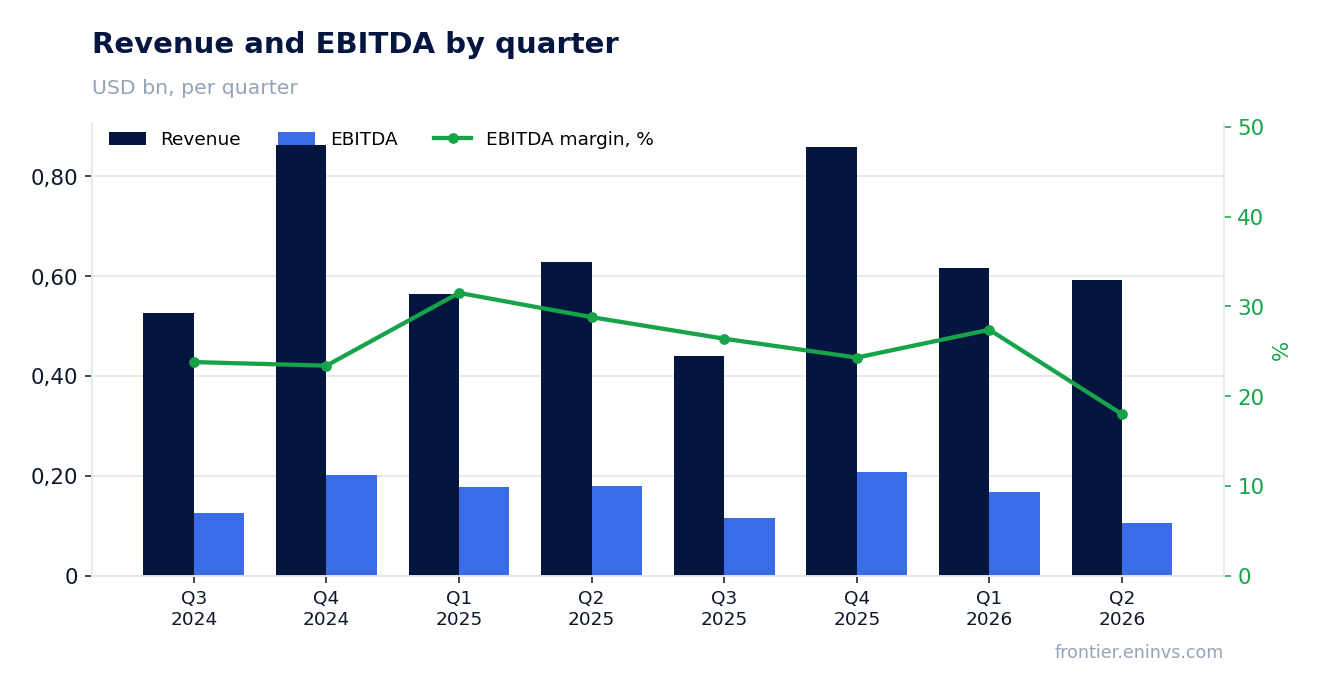
EBITDA dropped 47.4% YoY to $106.6 million, with margin contracting from 28.8% to 16.0%
EBITDA in Q2 2026 was $106.6 million, 47.4% lower than a year earlier. EBITDA margin fell from 28.8% to 16.0% – a significant deterioration in operating efficiency.
The main reason was a combination of lower revenue and, likely, higher unit costs. Over the trailing twelve months, EBITDA was $607.7 million, roughly in line with a year ago, but quarterly dynamics show continued margin pressure.
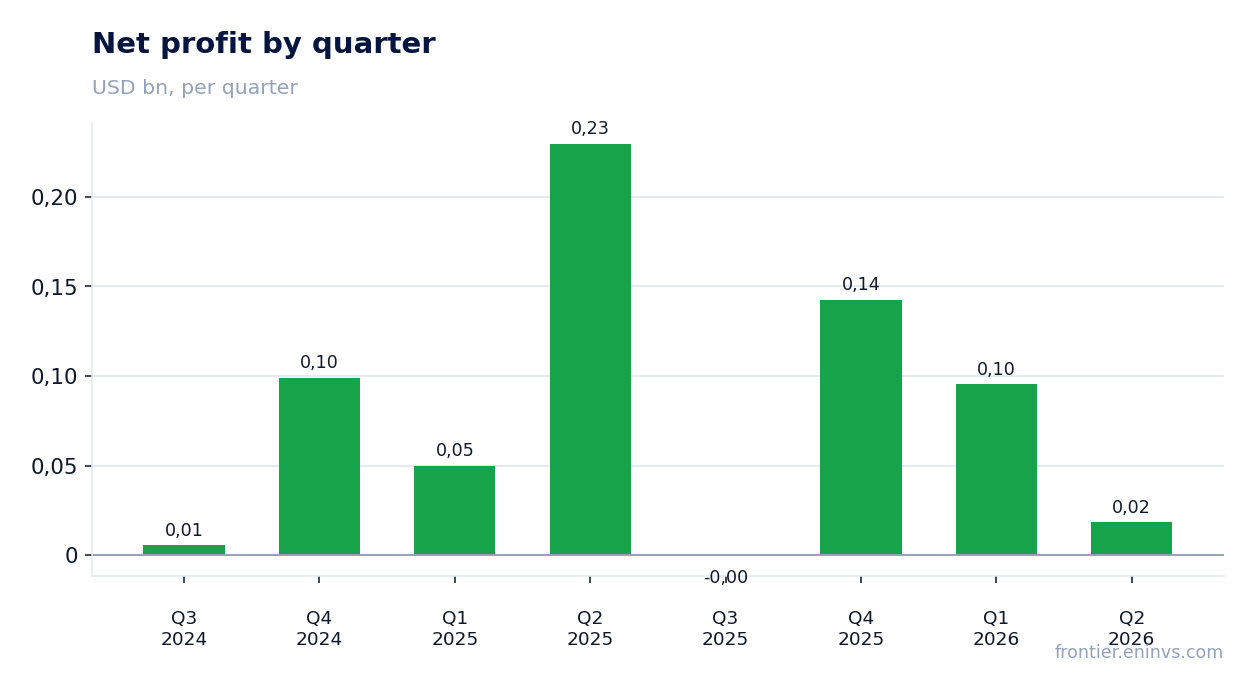
Net profit in Q2 was only $18.4 million versus $229.6 million a year earlier
Net profit in Q2 2026 fell 92.0% YoY to $18.4 million. A year earlier, profit was $229.6 million, an abnormally high level, likely due to one-off gains.
Over the trailing twelve months, net profit was $256.0 million, implying a net margin of about 10%. However, in Q2, net margin was only 3.1% versus 36.6% a year earlier, indicating a lack of sustainable profitability at current price levels.
Operating cash flow for the quarter was $95.4 million, but $675.4 million over the trailing twelve months
In Q2 2026, operating cash flow was $95.4 million, significantly lower than $332.9 million a year earlier. However, over the trailing twelve months, operating cash flow reached $675.4 million, covering capital expenditures and dividends.
Capital expenditures in Q2 were not disclosed, but in previous quarters they ranged from $40 to $78 million. Given the operating cash flow over 12 months, the company generates sufficient funds to finance investments, although quarterly volatility is significant.
Net debt on the balance sheet is $499.4 million, with net debt/EBITDA at 0.82
As of the latest balance sheet date, Cameco's net debt was $499.4 million. The net debt/EBITDA ratio over the trailing twelve months is 0.82, a moderate level, although higher than in previous quarters when the company had negative net debt.
Over the past 12 months, net debt decreased by $0.5 billion, reflecting cash generation. However, in Q2 2026, net debt was -$84.5 million (i.e., cash exceeded debt), but on the balance sheet it rose to $499.4 million – likely due to seasonal factors or investments.
Dividend yield over the trailing twelve months is just 0.17%, below the key rate
Over the trailing twelve months, Cameco paid dividends corresponding to a yield of 0.17% at the current price. This is an extremely low level, not competitive even with risk-free returns.
At such a yield, dividends are not a reason to buy shares. Payments are likely to be maintained, but their size is insignificant for income-oriented investors.
Valuation: EV/EBITDA of 72.8 versus three-year average of 45.4, and the portal's model implies 81% downside
The current EV/EBITDA multiple is 72.8, significantly above the three-year average (45.4). Even considering long-term growth in uranium demand, this valuation looks stretched, especially amid falling EBITDA.
According to the portal's model, with EBITDA re-priced to current uranium prices and applying a target EV/EBITDA, the share's downside potential is -81% from the current market price. This implies that the market is pricing in either significant profit growth or a prolonged period of high uranium prices.
P/E over the trailing twelve months is 170.9, also indicating extremely high valuation. Even if profit recovers to 2025 levels, the current price suggests years of growth.
Valuation on the latest reported figures
| Metric | Value |
|---|---|
| Market cap | 43.7 bn USD |
| P/E (LTM) | 170.9 |
| EV/EBITDA (LTM) | 72.8 |
| P/B | 9.41 |
| Net debt / EBITDA (LTM) | 0.82 |
| Operating cash flow (LTM) | 0.68 bn |
| ROE | 1.4% |
| Dividend yield (12m) | 0.2% |
| EV/EBITDA, 3-year average | 45.4 |
Bottom line
In Q2 2026, Cameco delivered weak results: revenue fell 5.6%, EBITDA nearly halved, and net profit dropped 92%. Operating cash flow over 12 months remains positive, but quarterly dynamics are volatile. Net debt is moderate, yet dividend yield is negligible. The key question for a holder is whether the current valuation (EV/EBITDA 72.8 versus average 45.4) justifies expectations of future growth, especially when the portal's model implies 81% downside. Verdict – unattractive.
Open the company's financial profile CCJ →
See also: market overview · valuation map · stock screeners