Coeur Mining: Q2 profit fell 54% on record revenue as a $140m non-cash Rainy River inventory charge bit

On 5 August Coeur Mining reported second-quarter 2026 results. Revenue hit a record $1,085.6m (+125.9% YoY), adjusted EBITDA reached $478.3m (+124% YoY) and free cash flow $387.5m (+165% YoY). GAAP net income was only $121.9m versus $246.8m in the prior quarter: a $140m non-cash purchase-price-allocation charge on Rainy River stockpile inventory wiped out the effect of record revenue. The shares look neutral: the EV/EBITDA multiple of 7.9x is below its own three-year average of 14.8x, but the portal model puts upside to fair value at minus 11%, and the 0.1% dividend yield offers no support.
Key takeaways
— Revenue rose 125.9% YoY to $1,085.6m, with gold contributing 64%
— Adjusted EBITDA grew 124% YoY, but the margin only reached 44.1%
— Net income fell 54% QoQ on a $140m non-cash Rainy River inventory charge
— Operating cash flow reached $513.2m while capex rose to $125.7m
— Net debt is negative at $1,042.0m, with a negative leverage ratio
— The 0.1% dividend yield on a $0.02 per share payment offers no support
— EV/EBITDA of 7.9x versus its own three-year average of 14.8x – a discount to history
Attractiveness
Key figures, USD bn
| Metric | Q2 2025 | Q2 2026 | Change |
|---|---|---|---|
| Revenue | 0.48 | 1.09 | +125.9% |
| EBITDA | 0.20 | 0.48 | +137.3% |
| Operating profit | 0.14 | 0.22 | +54.5% |
| Net profit | 0.07 | 0.12 | +72.3% |
| Operating cash flow | 0.21 | 0.51 | +148.0% |
| Capex | 0.06 | 0.13 | +106.7% |
| EBITDA margin | 41.9% | 44.1% | +2.2 pp |
| Net margin | 14.7% | 11.2% | -3.5 pp |
Revenue rose 125.9% YoY to $1,085.6m, with gold contributing 64%
Second-quarter 2026 revenue reached $1,085.6m, up 125.9% from $480.7m in Q2 2025. The growth came from the first full quarter after the New Gold acquisition closed on 20 March 2026: New Afton and Rainy River, which contributed only eleven days of production in Q1, operated for the full three months. Revenue rose 27% quarter over quarter.
Gold accounted for 64% of revenue – $695.0m – silver 30% ($321.6m) and copper 6% ($69.0m). Gold production hit a record 163,490 ounces (+51% YoY), silver 4.4 million ounces (flat QoQ) and copper 11.4 million pounds. Realized prices declined: gold to $4,140/oz (-6% QoQ) and silver to $71.18/oz (-14%).
US and Canadian operations generated about 68% of revenue. The new Canadian assets added $438.1m ($133.3m from New Afton and $304.8m from Rainy River), while the five legacy operations contributed $647.5m combined. The revenue record was achieved despite lower prices – on volumes.
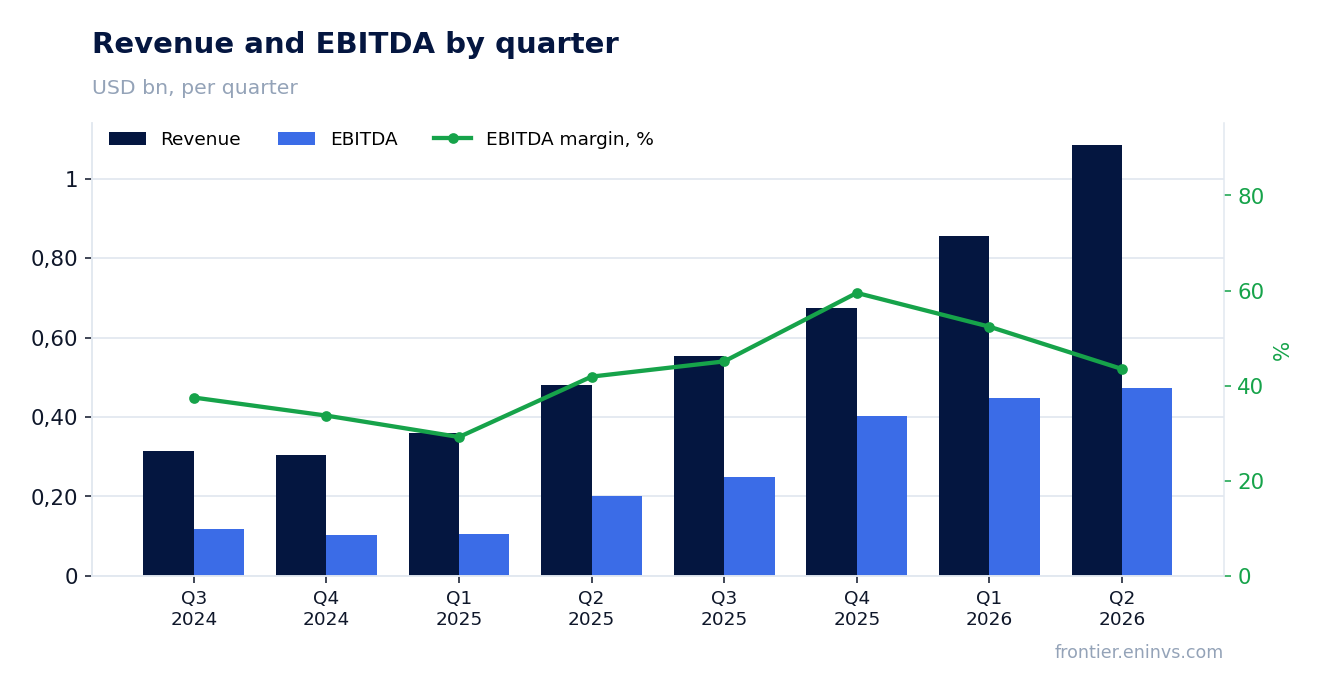
Adjusted EBITDA grew 124% YoY, but the margin only reached 44.1%
Second-quarter 2026 adjusted EBITDA reached $478.3m versus $213.8m a year earlier – up 124%. But the EBITDA margin only rose to 44.1% from 41.9% a year earlier: cost growth almost ate the scale effect. Costs applicable to sales rose to $549.7m from $229.5m a year earlier – more than double – reflecting the inclusion of the new Canadian assets and higher reagent and energy prices.
The main hit to profit was non-cash: a $140m purchase-price-allocation charge on Rainy River stockpile inventory. This added $834 per ounce to gold CAS and $2,036 per ounce to Rainy River's CAS. Without it, adjusted EBITDA would have been higher and net income closer to adjusted.
Adjusted net income was $122.6m, or $0.12 per share – almost matching GAAP net income. This means the entire gap with the prior quarter is explained by the non-cash charge, not by deteriorating operations.
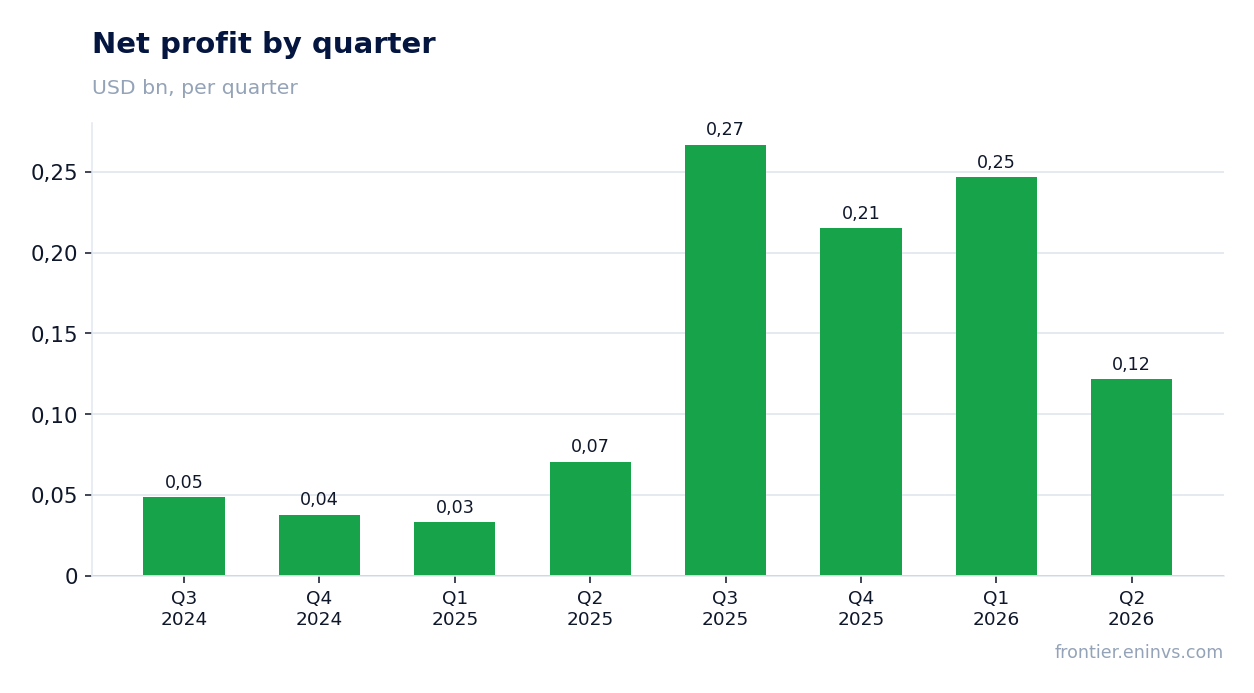
Net income fell 54% QoQ on a $140m non-cash Rainy River inventory charge
GAAP net income in Q2 2026 was $121.9m, or $0.12 per share – 54% below Q1 2026 ($246.8m) but 72.3% above Q2 2025 ($70.7m). The main reason for the QoQ decline is the $140m non-cash charge on Rainy River inventory arising from the New Gold purchase-price allocation.
This charge is not operational: it reflects the revaluation of stockpile inventory at fair value on the acquisition date. Adjusted net income – $122.6m – is almost identical to GAAP net income, confirming that without this charge profit would have been substantially higher.
The net margin fell to 11.2% from 14.7% a year earlier. The gap with the 44.1% EBITDA margin is explained not only by the charge but also by higher depreciation after the new assets came online, as well as $93m of income tax expense.
Operating cash flow reached $513.2m while capex rose to $125.7m
Second-quarter 2026 operating cash flow was $513.2m versus $340.8m in Q1 and $207.0m a year earlier. The growth came from a full quarter of New Afton and Rainy River operations and lower tax payments. Free cash flow reached $387.5m – up 45% QoQ and 165% YoY.
Capex rose to $125.7m from $74.1m in Q1. Of this, $105m was sustaining and $21m development, including $26m of capitalised stripping at Rainy River. The capex increase reflects the integration of the new Canadian assets and the need to sustain production.
The company ended the quarter with cash and short-term investments of $1,052.3m – nearly ten times the year-earlier level and double the end-2025 balance. This provides a cushion to fund the share buyback programme and dividends.
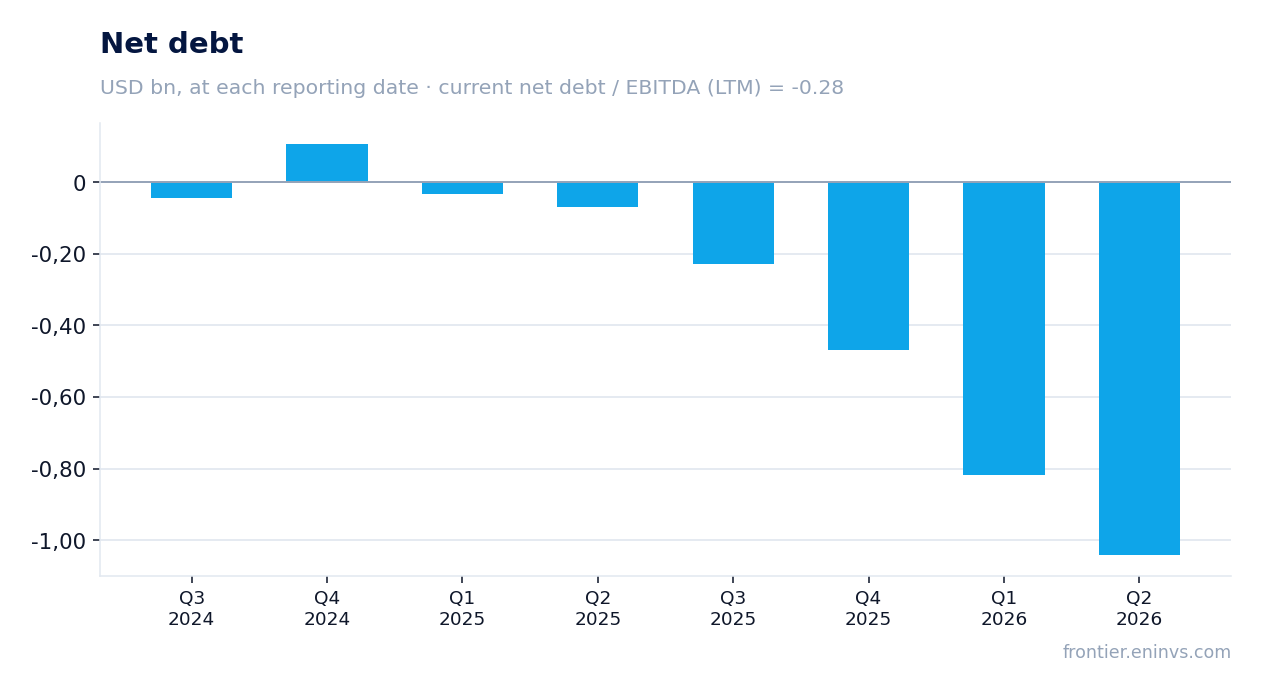
Net debt is negative at $1,042.0m, with a negative leverage ratio
Net debt at the end of Q2 2026 was minus $1,042.0m – the company has more cash than debt. Total debt was $705.3m, down $56.1m from the prior quarter. During the quarter the company eliminated $39m of capital leases.
The net debt / EBITDA ratio for the trailing twelve months is minus 0.28. This is a level, not a direction: the prior value is not in the facts, so it is impossible to say whether leverage rose or fell. The negative value reflects the substantial cash pile accumulated after the New Gold acquisition closed.
Interest expense is not disclosed as a separate line in the source, but with this level of debt and cash cushion it is not a significant factor for profit. The key question is how the company will deploy the accumulated liquidity: buybacks, dividends or new acquisitions.
The 0.1% dividend yield on a $0.02 per share payment offers no support
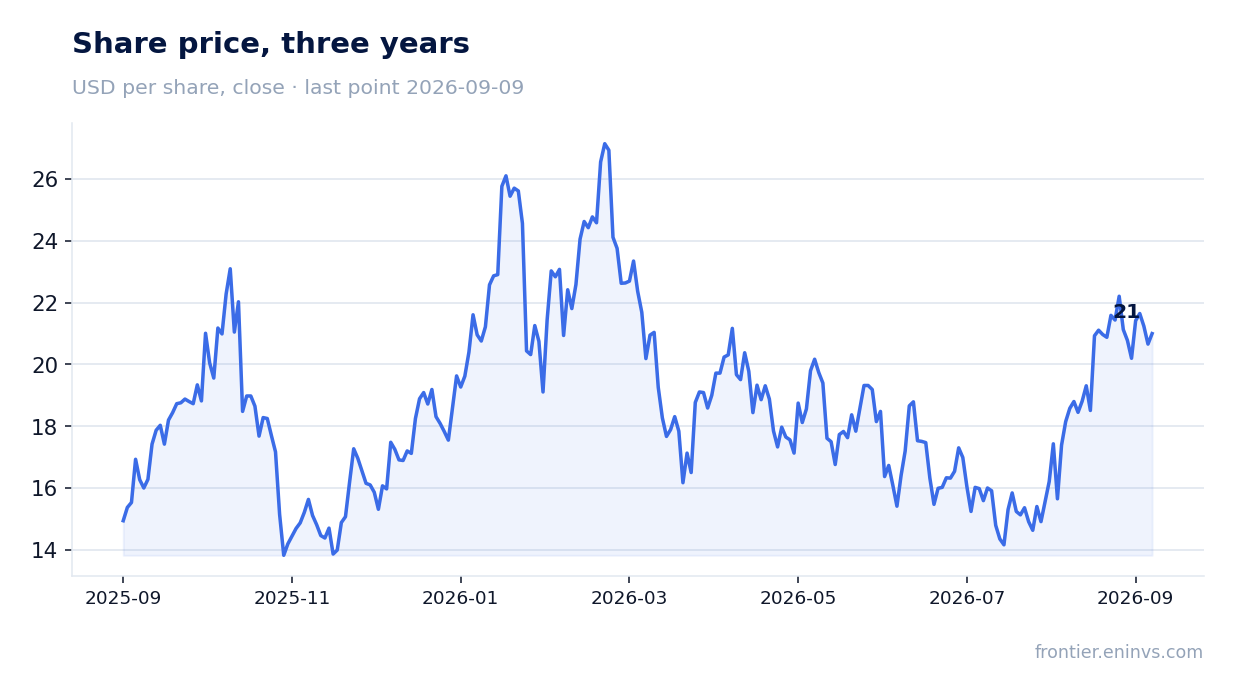
In June 2026 Coeur paid its first semi-annual dividend of $0.02 per share. At the current price this gives a dividend yield of about 0.1% – a level that offers no support to the shares and is not a factor in the investment decision. For comparison, the US key rate is substantially higher, and a 0.1% yield does not even cover inflation.
The company also launched a share buyback programme: from mid-May to 31 July it repurchased $121m of stock, or 6.7 million shares. This is a more significant channel of capital return than dividends and supports the share price. However, the programme is not an obligation and can be suspended.
Our estimate for the 2026 dividend is $0.04 per share (two semi-annual payments of $0.02). This is our estimate, not company guidance. It is based on the announced policy and expected free cash flow of $1.5bn. The risk of a lower payout is linked to falling gold and silver prices and a possible increase in capex at the new assets.
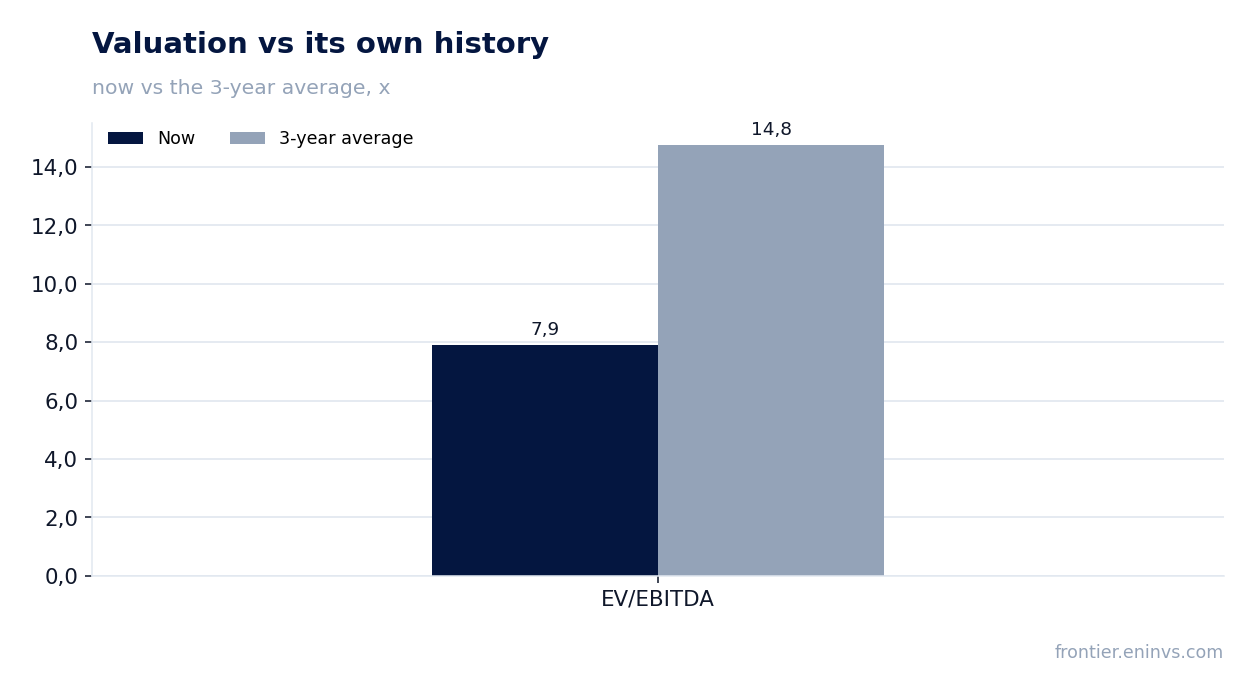
EV/EBITDA of 7.9x versus its own three-year average of 14.8x – a discount to history
The trailing twelve-month EV/EBITDA multiple is 7.9x versus its own three-year average of 14.8x. The shares trade substantially below their historical valuation – a discount of almost half. This reflects both the EBITDA growth after the New Gold acquisition and continued market scepticism about the sustainability of gold and silver prices.
The trailing twelve-month P/E is 15.9x, which also looks moderate for a mining company with growing revenue. However, trailing twelve-month net income includes non-cash charges that distort the picture. Return on equity (ROE) is 4.7%, which is low and reflects the large equity base after the acquisition.
The portal model puts upside to fair value at minus 11%. This is our own model, not market consensus. It re-prices EBITDA at current commodity prices against the target EV/EBITDA. The negative upside means that at current metal prices the share looks rather overvalued relative to the model, despite the discount to its historical multiple.
Valuation on the latest reported figures
| Metric | Value |
|---|---|
| Market cap | 13.5 bn USD |
| P/E (LTM) | 15.9 |
| EV/EBITDA (LTM) | 7.9 |
| P/B | 4.07 |
| Net debt / EBITDA (LTM) | -0.28 |
| Operating cash flow (LTM) | 0.89 bn |
| ROE | 4.7% |
| Dividend yield (12m) | 0.1% |
| EV/EBITDA, 3-year average | 14.8 |
Bottom line
Coeur Mining's Q2 2026 is a story of record revenue and record operating cash flow that failed to translate into record profit because of a $140m non-cash Rainy River inventory charge. The strong points are the New Gold integration, gold production of 163,490 ounces and negative net debt of $1,042.0m. The weak points are the 54% QoQ fall in net income and lower metal prices, which have already led to revised guidance at the new Canadian assets. The question for a holder now is not operational performance but whether the company can sustain cash flow at lower prices and justify its current valuation, which the portal model puts at minus 11% to fair value.
Open the company's financial profile CDE →
See also: market overview · valuation map · stock screeners