Calumet: revenue up 40.8%, but the quarterly loss was entirely non-cash
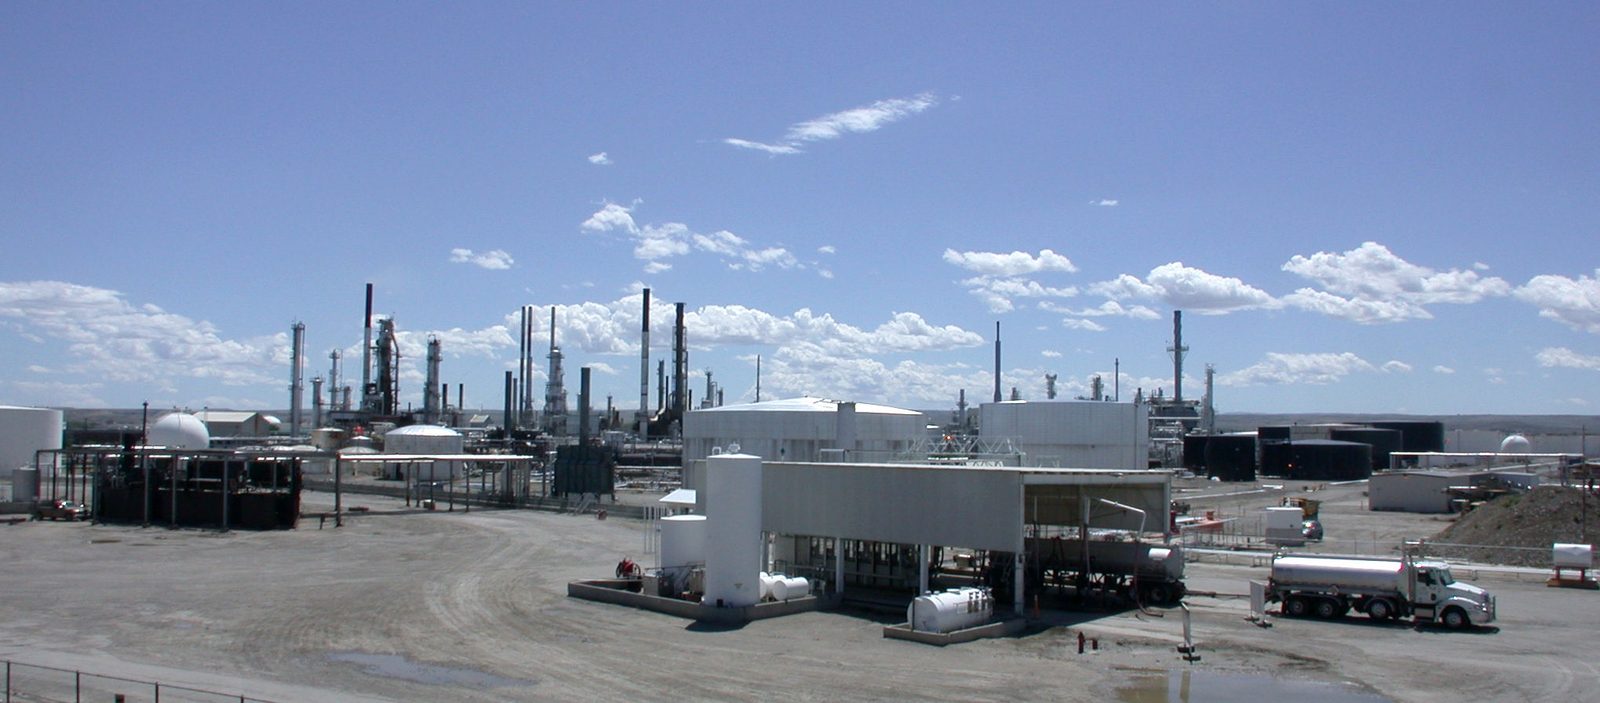
On 7 August Calumet reported second-quarter 2026 results. Revenue rose 40.8% year on year to $1,445.1 million, Adjusted EBITDA with Tax Attributes reached $175.2 million versus $76.5 million a year earlier, and the net loss narrowed to $95.9 million from $147.9 million. The loss was almost entirely non-cash – a $163.6 million RINs charge and derivative mark-to-market – while Specialty Products and Solutions delivered a record quarterly EBITDA of $161.7 million. The shares look neutral: the specialty-chemicals turnaround is real, but 9.92x LTM net debt/EBITDA and 32.8x LTM EV/EBITDA leave no room for error.
Key takeaways
— Revenue rose 40.8% year on year, with almost all the growth coming from specialty chemicals
— The $95.9 million loss was created by non-cash items, not operational weakness
— Specialty Products and Solutions posted record EBITDA of $161.7 million on a global specialty-products shortage
— Performance Brands margins compressed on price lag and a $7.3 million LIFO impact
— Montana/Renewables turned positive on EBITDA with Tax Attributes after completing the first phase of MaxSAF 150
— Leverage at 9.92x LTM EBITDA is coming down but remains high relative to cash flow
— The 32.8x LTM EV/EBITDA valuation leaves no room for error
Attractiveness
Key figures, USD bn
| Metric | Q2 2025 | Q2 2026 | Change |
|---|---|---|---|
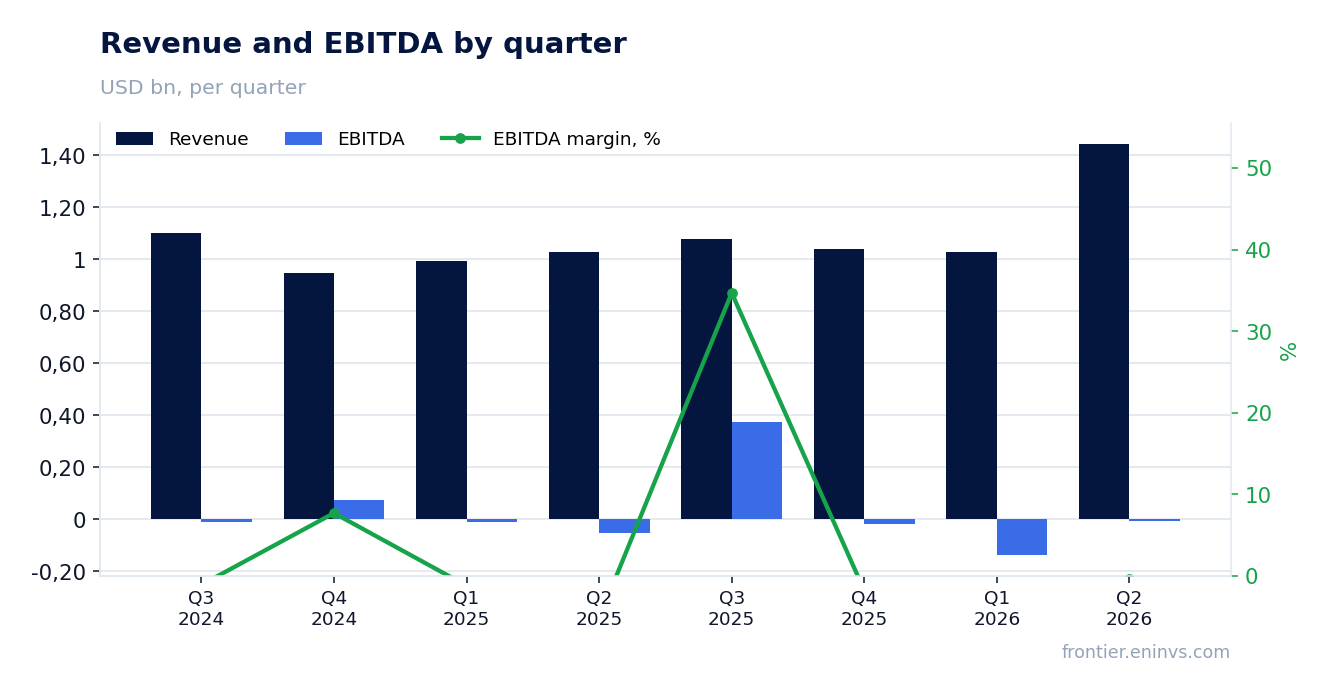
| Revenue | 1.03 | 1.45 | +40.8% |
| EBITDA | -0.05 | -0.01 | — |
| Operating profit | -0.10 | -0.04 | — |
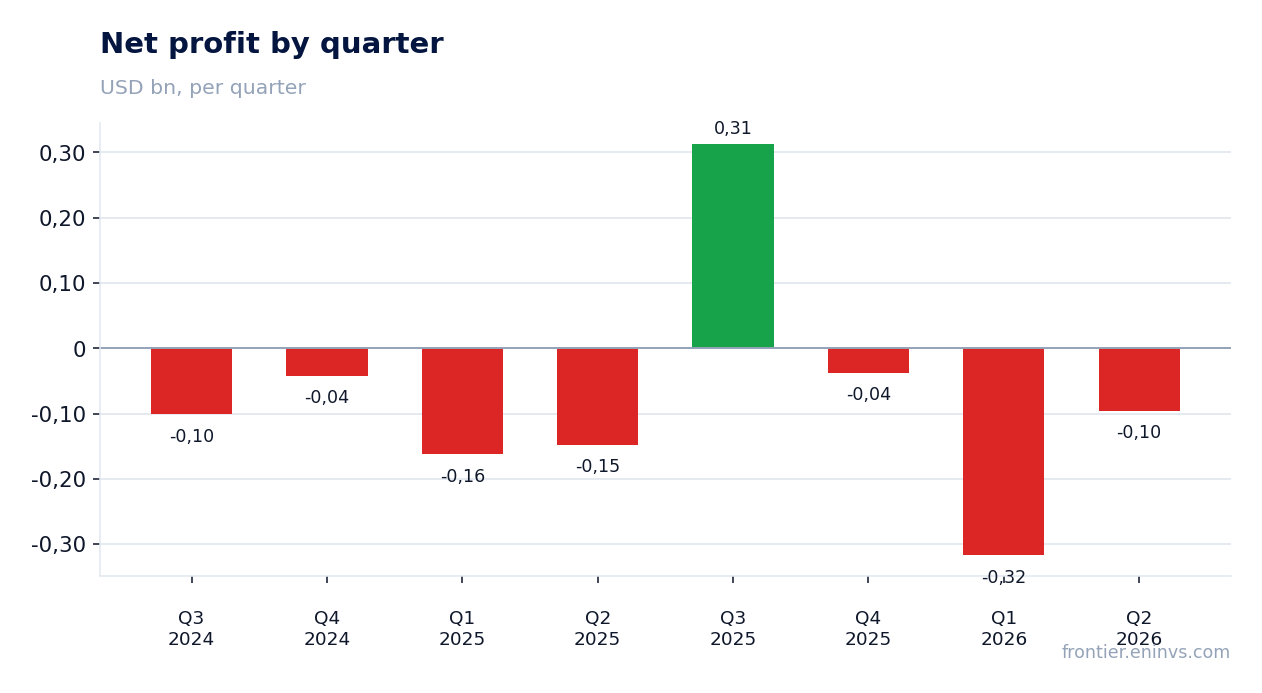
| Net profit | -0.15 | -0.10 | — |
| Operating cash flow | 0.00 | 0.09 | +3450.0% |
| Capex | 0.01 | 0.04 | +181.6% |
| EBITDA margin | -5.2% | -0.4% | +4.8 pp |
| Net margin | -14.4% | -6.6% | +7.8 pp |
Revenue rose 40.8% year on year, with almost all the growth coming from specialty chemicals
Second-quarter 2026 revenue reached $1,445.1 million, up 40.8% year on year. That is the fastest growth in at least six quarters: Q1 2026 revenue rose 3.6%, Q4 2025 rose 9.4%, while Q3 and Q2 2025 were negative.
Almost all the growth came from Specialty Products and Solutions: segment sales rose to $1,012.5 million from $627.9 million a year earlier. That is more than half of total quarterly revenue. The company attributes the increase to a global shortage of specialty products, strong production and commercial execution.
The other segments made no comparable contribution. Performance Brands saw strong volumes and record quarterly TruFuel sales, but margins compressed. Montana/Renewables was only recovering from a planned turnaround and the MaxSAF 150 expansion that ran from March through April, with operations restarting in early May.
The 40.8% revenue growth is primarily a price and mix effect in specialty chemicals, not a broad volume recovery. Total sales volume actually edged down to 87,722 barrels per day from 88,766 a year earlier.
The $95.9 million loss was created by non-cash items, not operational weakness
The second-quarter 2026 net loss was $95.9 million, or $1.09 per share, versus a $147.9 million loss a year earlier. The loss narrowed but remains significant.
In the release the company explicitly states that two non-cash items drove the loss: an unrealized gain on derivatives of $9.0 million and a non-cash RINs expense of $163.6 million. Without the RINs charge, the quarter would have been profitable at the operating level.
Adjusted EBITDA was $159.3 million versus $55.1 million a year earlier, and Adjusted EBITDA with Tax Attributes was $175.2 million versus $76.5 million. This shows the operations are generating cash and the loss is an accounting matter.
The operating loss of $40.0 million also includes $10.7 million of turnaround cost amortization and RINs expense. Interest expense was stable at $52.0 million versus $52.9 million a year earlier.
Specialty Products and Solutions posted record EBITDA of $161.7 million on a global specialty-products shortage
Specialty Products and Solutions segment Adjusted EBITDA in Q2 2026 was $161.7 million versus $66.8 million a year earlier. That is more than double and the segment's best quarterly result.
Segment margin rose to 16.0% from 10.6% a year earlier. The company attributes this to a constructive market, a global shortage of specialty products, strong production and excellent commercial execution.
Segment adjusted gross profit rose to $195.6 million from $75.6 million, and per barrel to $32.25 from $13.81. This is the key driver for the whole group: without SPS, group quarterly EBITDA would have been negative.
Production volumes in the segment also rose: lubricating oils output increased to 13,318 bpd from 11,939, and waxes to 1,559 from 1,325. Margin growth is accompanied by volume growth, not just price.
Performance Brands margins compressed on price lag and a $7.3 million LIFO impact
Performance Brands segment Adjusted EBITDA in Q2 2026 was $6.3 million versus $13.5 million a year earlier. A decline of more than half.
The company attributes this to margin compression: price increases were implemented during the quarter after a normal lag, while feedstock costs escalated immediately. Additionally, the segment absorbed a $7.3 million LIFO impact.
Volumes remained strong, and TruFuel sales hit a record quarterly level. The problem is not demand but the inability to pass through cost inflation quickly.
Segment adjusted gross profit fell to $16.1 million from $22.3 million, and per barrel to $81.42 from $140.25. This was the weakest segment of the quarter.
Montana/Renewables turned positive on EBITDA with Tax Attributes after completing the first phase of MaxSAF 150
Montana/Renewables segment Adjusted EBITDA in Q2 2026 was $10.7 million versus a $5.1 million loss a year earlier. With tax attributes, it was $26.6 million versus $16.3 million.
The company reports that the first phase of the MaxSAF 150 expansion is complete, and the business restarted in early May after a planned turnaround that ran from March through April. It now captures strong renewable margins.
Tax attributes of $15.9 million reflect the notional value of clean fuel production credits (CFPCs) that the company can use or sell at a discount. This is an important cash flow source for the segment.
Renewable fuel production volumes fell to 7,011 bpd from 12,044 a year earlier – a consequence of the turnaround. Restoring volumes in the second half will be key for the segment.
Leverage at 9.92x LTM EBITDA is coming down but remains high relative to cash flow
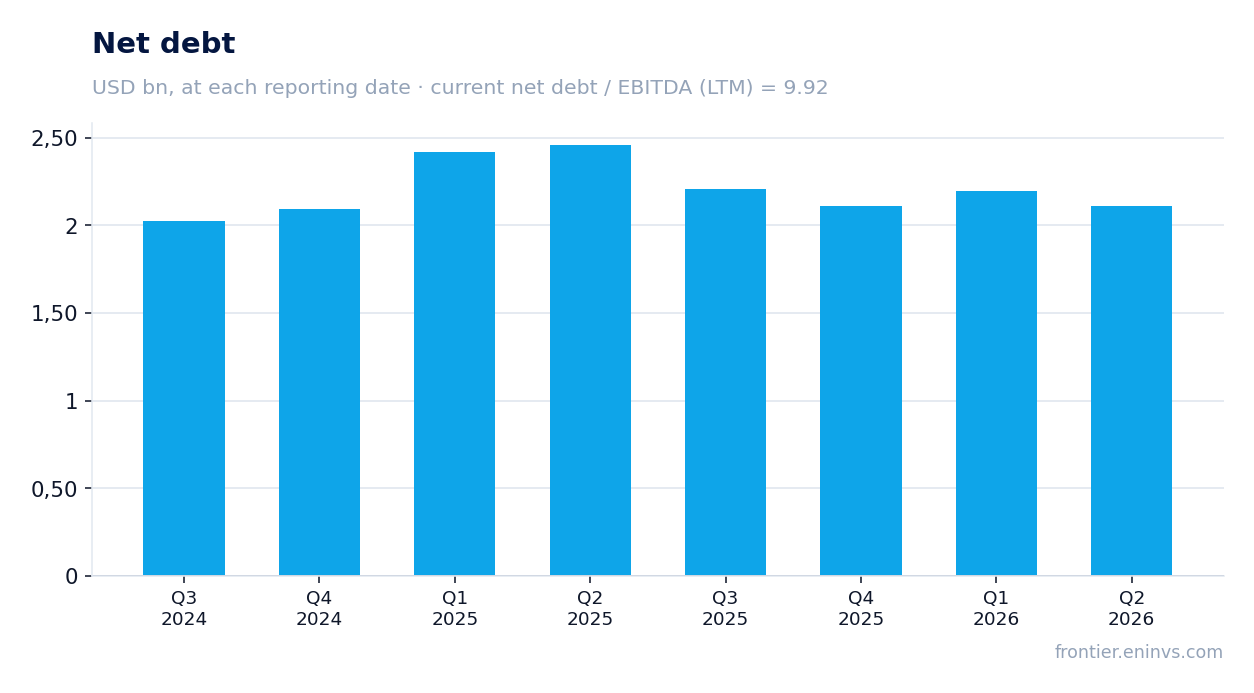
Net debt at the end of Q2 2026 was $2,091.2 million, down from $2,193.4 million at the end of Q1 and from $2,459.7 million a year earlier. In July the company redeemed $100 million of 2028 notes and terminated the Montana terminal financing for $15.5 million.
The ratio of net debt to LTM EBITDA is 9.92x. That is a high level that limits flexibility. The direction of change in this ratio is not given in the facts, so a comparison with the previous value is not appropriate here.
LTM operating cash flow was $223.0 million, which covers interest expense but leaves little for capital expenditures and debt repayment. The company states it will continue to use cash from operations to pay down debt.
Interest expense in Q2 was $52.0 million, equivalent to about $208 million annually. This is a significant burden that consumes much of operating EBITDA.
The 32.8x LTM EV/EBITDA valuation leaves no room for error
LTM EV/EBITDA is 32.8x. This is a very high multiple, reflecting both the low LTM EBITDA base ($210.8 million) and significant debt in the capital structure.
Market capitalisation at the time of writing is $4,831.7 million. With net debt of $2,091.2 million, EV exceeds $6.9 billion. The debt-to-equity mix is heavily skewed toward debt.
Return on equity is 142.8%, but this is a consequence of negative shareholders' equity of $1,137.1 million, not high profit. The metric carries no useful information in this situation.
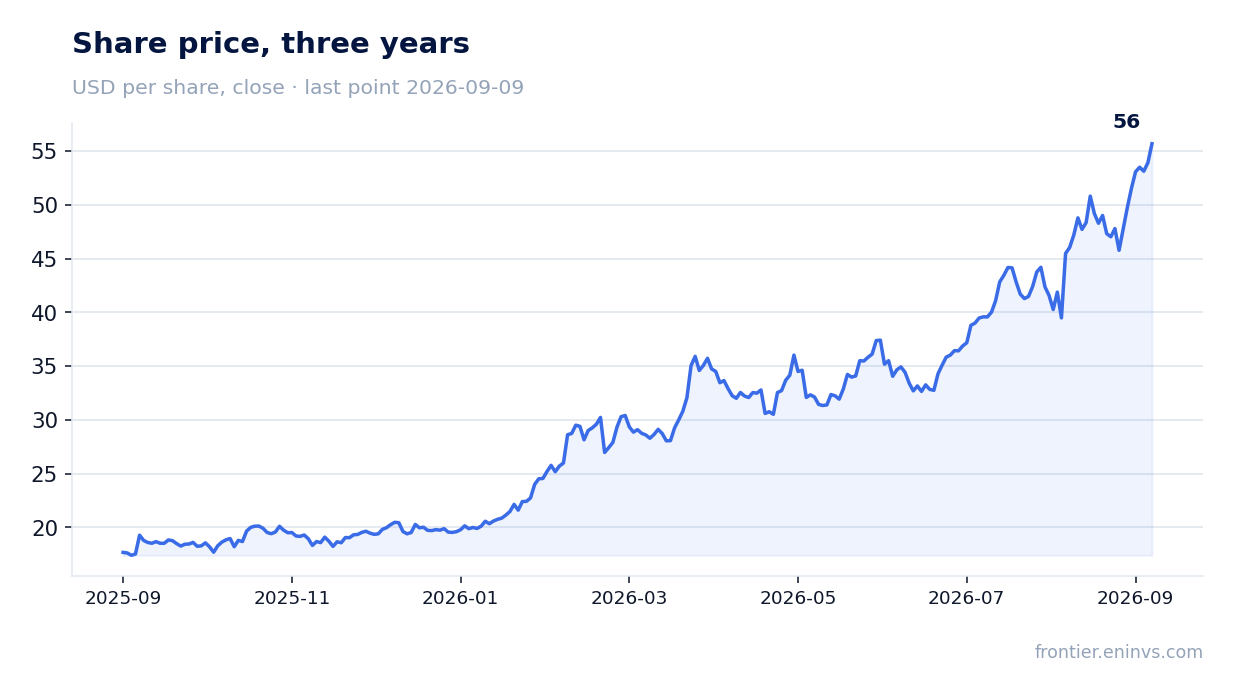
The share rose 33.0% from the release date to 9 September 2026, but fell 5.7% on the release day. The market first reacted to the loss, then re-rated the prospects for the SPS segment and debt reduction.
Valuation on the latest reported figures
| Metric | Value |
|---|---|
| Market cap | 4.83 bn USD |
| EV/EBITDA (LTM) | 32.8 |
| Net debt / EBITDA (LTM) | 9.92 |
| Operating cash flow (LTM) | 0.22 bn |
| ROE | 142.8% |
Bottom line
The quarter showed that the operational turnaround in Specialty Products and Solutions is real: the segment earned $161.7 million of EBITDA, and the group as a whole reached $175.2 million with tax attributes. The $95.9 million loss was created by non-cash items – RINs expense and derivative mark-to-market – and that matters for understanding the quality of the reported numbers. However, 9.92x LTM net debt/EBITDA and 32.8x LTM EV/EBITDA leave no room for error: even if SPS margins hold, the company must direct a significant portion of cash flow to servicing and repaying debt. For a holder, the key question now is not so much earnings recovery as the ability to sustain specialty-chemicals margins long enough to bring debt down to a comfortable level.
Open the company's financial profile CLMT →
See also: market overview · valuation map · stock screeners