ConocoPhillips: quarterly profit nearly doubled on prices, but the portal's model sees a 61% downside to fair value
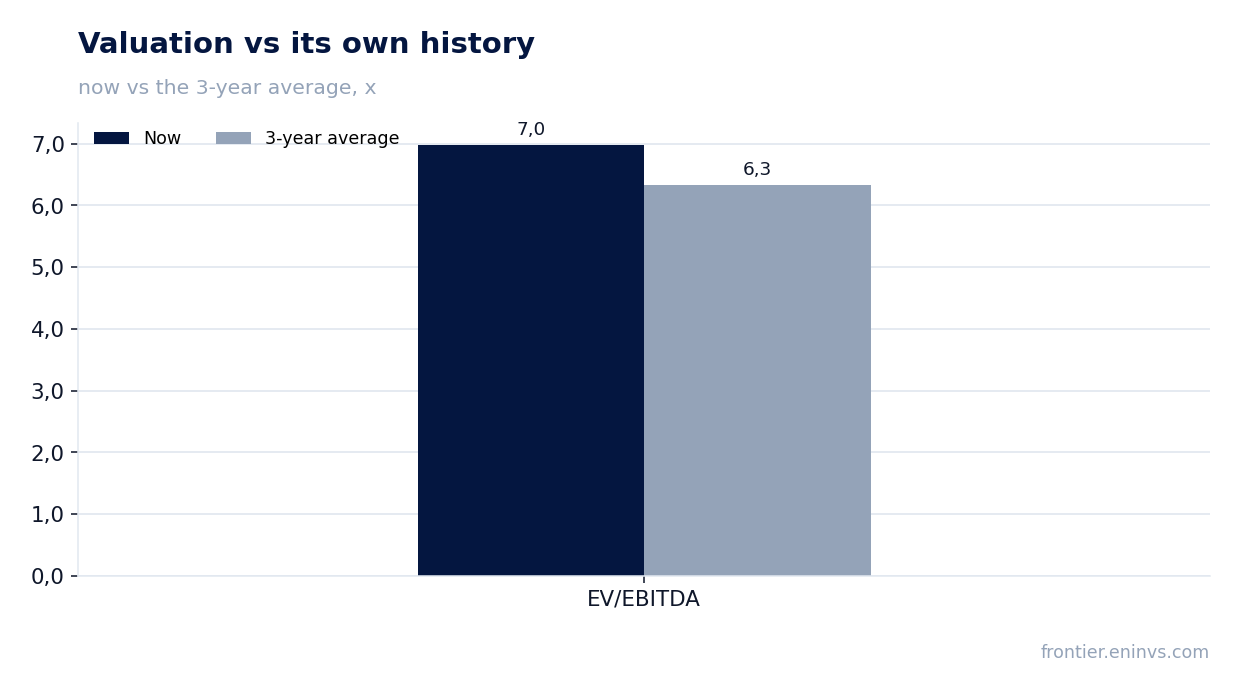
On August 6, 2026, ConocoPhillips reported second-quarter 2026 results. Revenue rose 29.2% year on year to $18,088 million, EBITDA grew 54.8% to $8,962 million, and net profit jumped 99.4% to $3,931 million. At the current price, the share looks unattractive: the EV/EBITDA multiple is above its own three-year average, and the portal's model implies a 61% downside.
Key takeaways
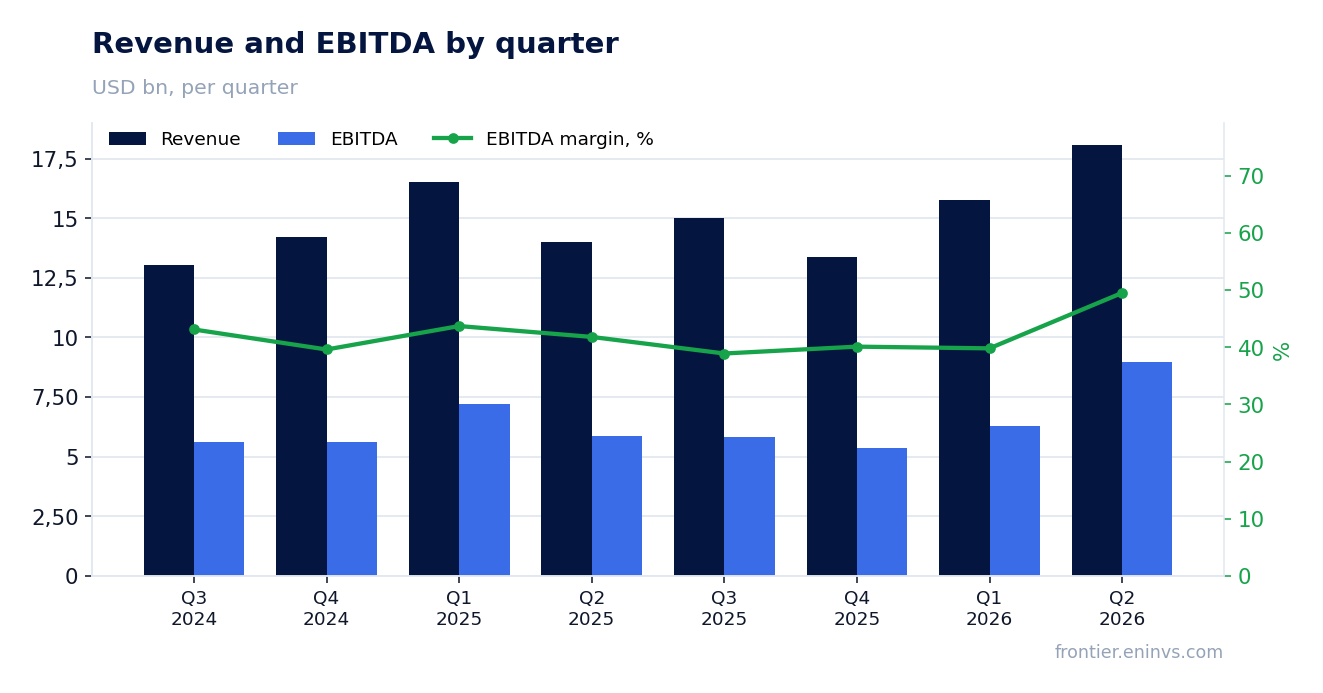
— Second-quarter 2026 revenue rose 29.2% year on year, driven by oil and gas prices
— EBITDA margin reached 50.1% versus 41.8% a year earlier – expansion on higher prices
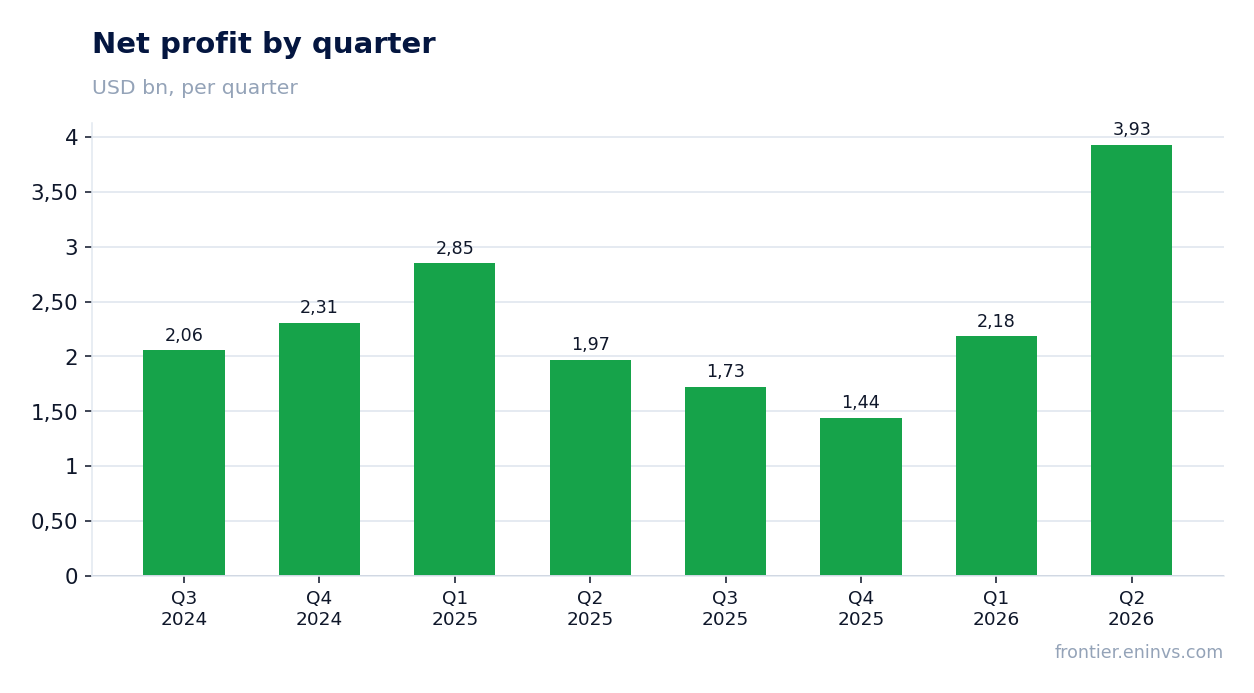
— Net profit nearly doubled, but adjusted profit grew even more after excluding one-off items
— Operating cash flow in the second quarter was $7.4 billion, capex – $3.0 billion
— Third-quarter 2026 dividend is $0.84 per share, trailing twelve-month yield – 2.46%
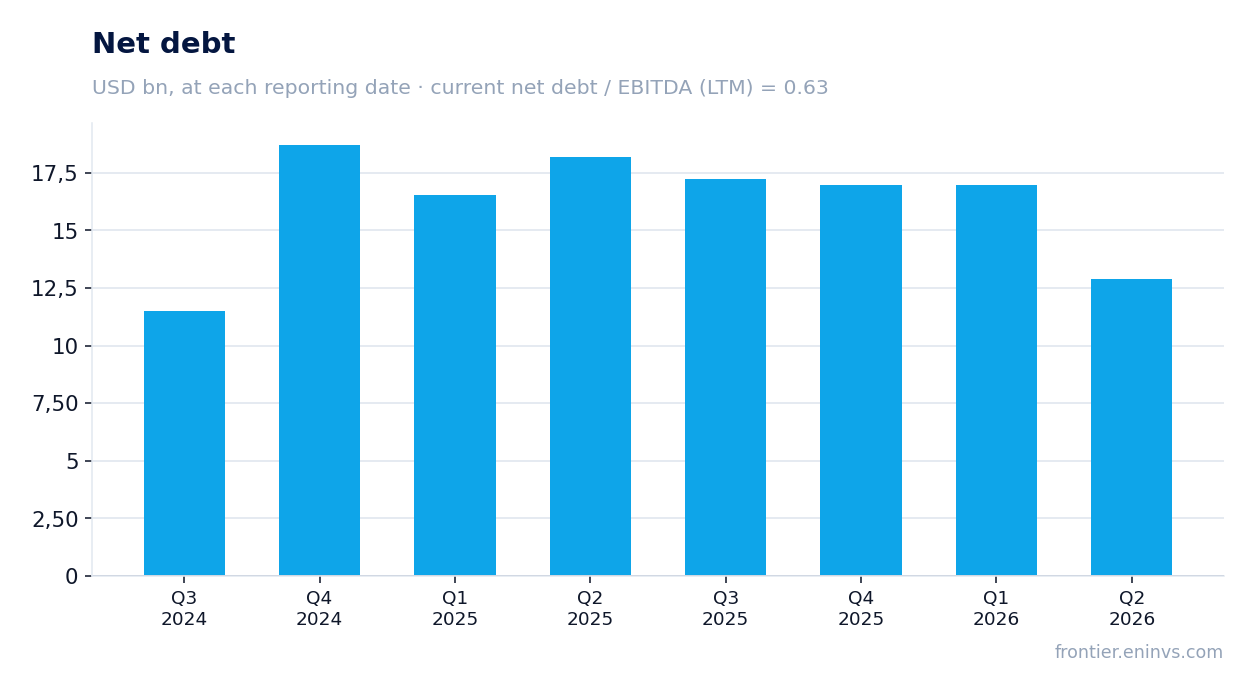
— Net debt fell to $12,872 million, ratio to twelve-month EBITDA – 0.63
— EV/EBITDA on trailing twelve months is 6.98 versus the three-year average of 6.33
Attractiveness
Key figures, USD bn
| Metric | Q2 2025 | Q2 2026 | Change |
|---|---|---|---|
| Revenue | 14.0 | 18.1 | +29.2% |
| EBITDA | 5.86 | 9.06 | +54.8% |
| Operating profit | 3.02 | 5.98 | +98.2% |
| Net profit | 1.97 | 3.93 | +99.4% |
| Operating cash flow | 3.48 | 7.40 | +112.3% |
| Capex | 3.29 | 3.02 | -8.0% |
| EBITDA margin | 41.8% | 50.1% | +8.3 pp |
| Net margin | 14.1% | 21.7% | +7.6 pp |
Second-quarter 2026 revenue rose 29.2% year on year, driven by oil and gas prices
In the second quarter of 2026, ConocoPhillips revenue reached $18,088 million, up 29.2% year on year. The company attributes the growth mainly to higher prices: the average realized price was $62.33 per barrel of oil equivalent versus $45.77 in the second quarter of 2025, or 36% higher.
Production, however, declined: 2,248 thousand barrels of oil equivalent per day versus 2,391 thousand a year earlier. After adjusting for closed acquisitions and dispositions, the decline was 4%. Organic growth in the Lower 48 was offset by the impact of the Middle East conflict on Qatar and higher Surmont royalties.
EBITDA margin reached 50.1% versus 41.8% a year earlier – expansion on higher prices
EBITDA in the second quarter of 2026 rose 54.8% year on year to $8,962 million, and the EBITDA margin expanded from 41.8% to 50.1%. The main contribution came from oil and gas prices, which lifted revenue faster than operating costs.
Operating profit grew even more – from $3,017 million to $5,979 million, reflecting operating leverage as prices rose. The margin expansion is the key driver of profit growth in the reported quarter.
Net profit nearly doubled, but adjusted profit grew even more after excluding one-off items
Net profit in the second quarter of 2026 was $3,931 million, up 99.4% year on year. However, reported profit includes one-off items: a loss from remeasurement of contingent liability ($2 million), transaction and restructuring expenses ($25 million after tax), and an interest rate hedge loss ($28 million after tax).
Adjusted profit was $3,951 million, or $3.24 per share, versus $1,793 million ($1.42) a year earlier. The growth in adjusted profit – about 120% – is even higher than reported, as last year included one-off gains, including gains on asset sales.
Operating cash flow in the second quarter was $7.4 billion, capex – $3.0 billion
In the second quarter of 2026, ConocoPhillips generated $7,434 million in operating cash flow, well above the $3,485 million a year earlier. The increase is driven by higher profit and favorable working capital changes.
Capital expenditures were $3,024 million, almost unchanged year on year ($3,286 million). Free cash flow after capex is about $4.4 billion for the quarter, covering dividends and share repurchases.
Third-quarter 2026 dividend is $0.84 per share, trailing twelve-month yield – 2.46%
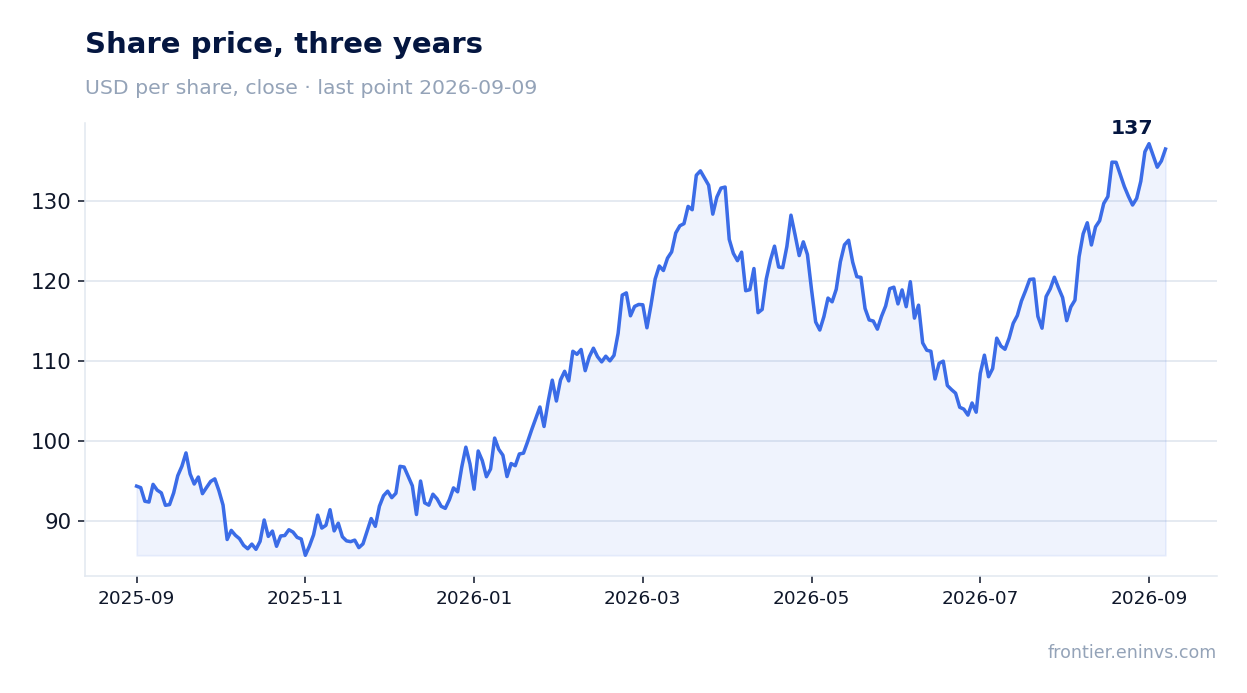
The board declared an ordinary dividend of $0.84 per share for the third quarter of 2026. Over the trailing twelve months, the dividend yield is 2.46% at the current price.
In the second quarter, the company paid $1.0 billion in dividends and repurchased $2.0 billion of shares, bringing total shareholder distributions to $3.0 billion. The company reaffirms its target to return 45% of cash from operations in 2026. At the current dividend level, annual payments would support a yield of about 2.5%.
Net debt fell to $12,872 million, ratio to twelve-month EBITDA – 0.63
At the end of the second quarter of 2026, net debt was $12,872 million, down from $16,947 million at the end of the first quarter. The ratio of net debt to EBITDA over the trailing twelve months is 0.63, reflecting moderate leverage.
The debt reduction was driven by strong operating cash flow, which funded capital expenditures and shareholder distributions while also reducing borrowings.
EV/EBITDA on trailing twelve months is 6.98 versus the three-year average of 6.33
The current EV/EBITDA multiple, based on trailing twelve-month profit, is 6.98. This is above its own three-year average of 6.33, meaning the stock trades at a premium to its history.
P/E on trailing twelve months is 18.4, and return on equity is 24.2%. The portal's model, which re-prices EBITDA at current commodity prices and a target EV/EBITDA, implies a 61% downside to fair value – this is the portal's own calculation, not a market consensus.
Valuation on the latest reported figures
| Metric | Value |
|---|---|
| Market cap | 171 bn USD |
| P/E (LTM) | 18.4 |
| EV/EBITDA (LTM) | 7.0 |
| P/B | 2.65 |
| Net debt / EBITDA (LTM) | 0.63 |
| Operating cash flow (LTM) | 19.8 bn |
| ROE | 24.2% |
| Dividend yield (12m) | 2.5% |
| EV/EBITDA, 3-year average | 6.3 |
Bottom line
ConocoPhillips' reported quarter is strong: revenue and EBITDA grew at double-digit rates, the margin expanded to 50.1%, and operating cash flow allowed both higher shareholder distributions and lower debt. However, the main driver was oil and gas prices, not production growth, which declined 4% year on year. At the same time, the stock trades above its own three-year history, and the portal's model points to significant downside. The verdict is unattractive: the current price already reflects high commodity prices, and any reversal in conditions creates a risk of correction.
Open the company's financial profile COP →
See also: market overview · valuation map · stock screeners