Cresco Labs: revenue grew for the first time in a year, but the quarter's profit was not made by sales
Cresco Labs reported second-quarter 2026 results. Revenue rose 5.9% year on year to USD 173.3m – the first increase after five quarters of decline. EBITDA, however, fell 32.7% to USD 28.0m, and net profit of USD 16.8m was earned on operating profit of just USD 13.4m. Leverage stands at 2.78x LTM EBITDA, and the portal's model puts the upside at 58%. We see the stock as rather attractive: the top line has turned, but the durability of that turn is yet to be confirmed.
Key takeaways
— Revenue grew for the first time in a year, but the turn rests on a single quarter
— EBITDA fell by a third and the margin compressed from 24.1% to 15.3%
— Net profit of USD 16.8m exceeded operating profit – it was not made by the core business
— Debt of USD 394.3m equals 2.78x LTM EBITDA
— Operating cash flow was just USD 15.4m for the quarter against USD 11.0m of capex
— On the portal's model the stock is 58% below its fair value
Attractiveness
Key figures, USD bn
| Metric | Q2 2025 | Q2 2026 | Change |
|---|---|---|---|
| Revenue | 0.16 | 0.17 | +5.9% |
| EBITDA | 0.04 | 0.03 | -32.7% |
| Operating profit | 0.03 | 0.01 | -47.4% |
| Net profit | -0.02 | 0.02 | to profit |
| Operating cash flow | 0.01 | 0.02 | +74.7% |
| Capex | 0.01 | 0.01 | -17.4% |
| EBITDA margin | 24.1% | 15.3% | -8.8 pp |
| Net margin | -10.0% | 9.7% | +19.7 pp |
Revenue grew for the first time in a year, but the turn rests on a single quarter
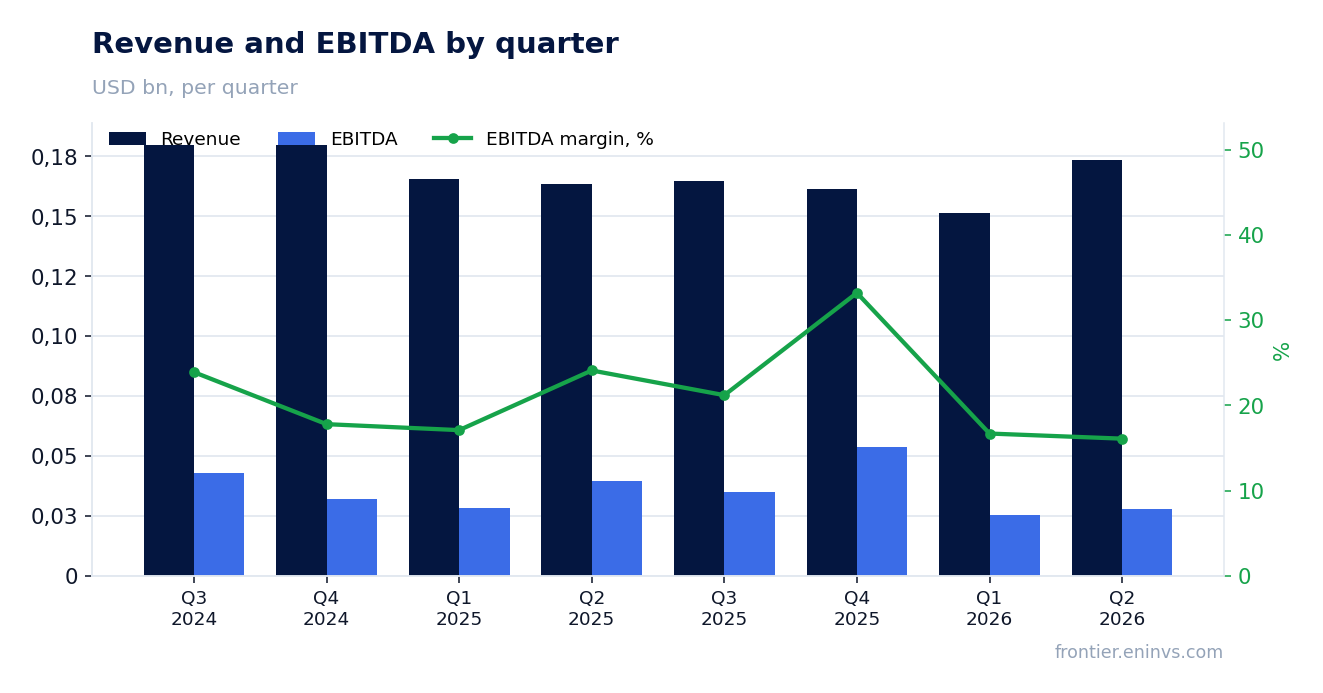
In the second quarter of 2026 revenue came to USD 173.3m, up 5.9% year on year. This is the first increase since the first quarter of 2025: before that sales had fallen for five consecutive quarters – from minus 9.7% in both the first and second quarters of 2025 to minus 8.7% in the first quarter of 2026. The previous quarter delivered only USD 151.3m, so the current USD 173.3m also marks a noticeable step up from the start of the year.
The turn so far rests on a single report. Over the last twelve months revenue was USD 651.1m – less than in the preceding twelve months, judging by the quarterly dynamics. A second consecutive growing quarter is needed to call it a trend, and the data does not provide one. The next report will show whether this was a one-off spike or the start of a recovery.
EBITDA fell by a third and the margin compressed from 24.1% to 15.3%
EBITDA in the second quarter of 2026 was USD 28.0m, down 32.7% year on year. The EBITDA margin fell to 15.3% from 24.1% a year earlier. With revenue up 5.9%, such a decline means costs grew faster than sales, and operating leverage worked in reverse.
Operating profit for the quarter was USD 13.4m, slightly less than half of EBITDA. This indicates that depreciation and other non-cash items absorb a significant portion of gross profit. For a company that a year ago showed a margin above 20%, the current 15.3% is a serious deterioration, and it is precisely this that drives the gap between revenue growth and profit decline.
Net profit of USD 16.8m exceeded operating profit – it was not made by the core business
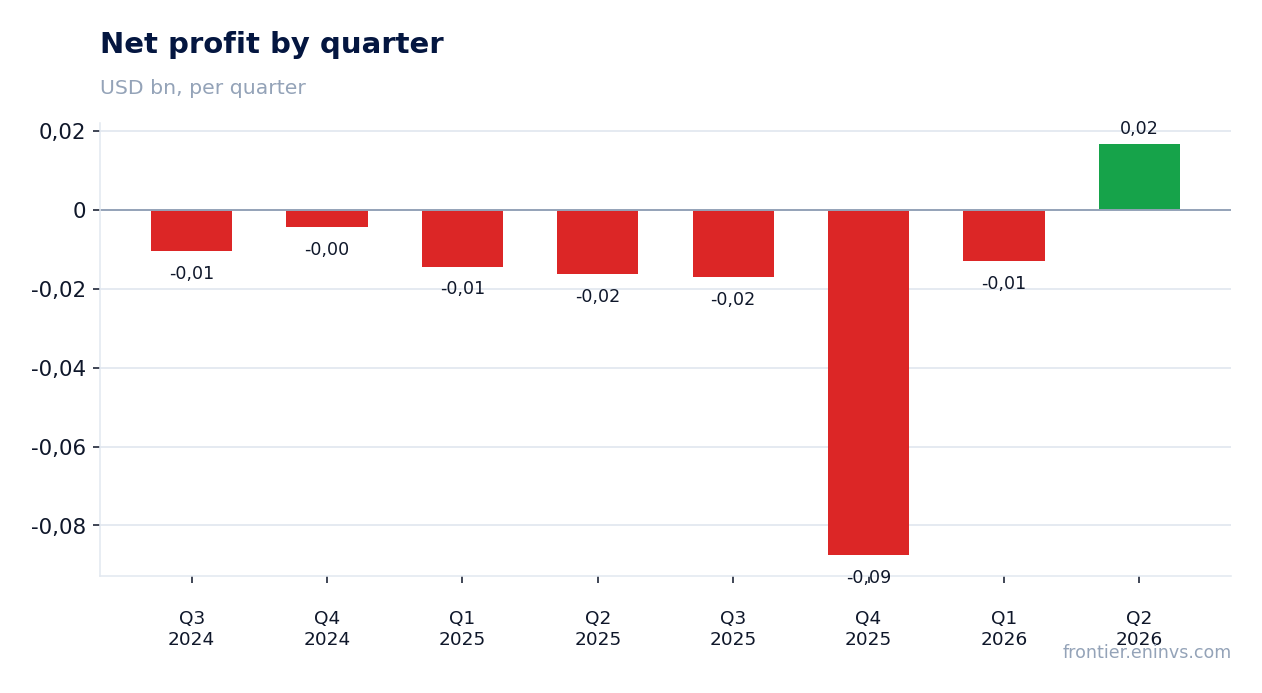
Net profit in the second quarter of 2026 was USD 16.8m against a loss of USD 16.3m a year earlier. Operating profit, however, was only USD 13.4m. Net profit exceeding operating profit means income arose below the operating line – likely from a change in the fair value of assets or a tax effect – which pushed the bottom line into positive territory.
The net margin was 9.7% against minus 10.0% a year earlier. Such a reversal is positive in itself, but it is not supported by operating activity: without one-off items, profit would be close to zero or negative. For assessing the sustainability of the business, operating profit matters more, and it is not yet growing.
Debt of USD 394.3m equals 2.78x LTM EBITDA
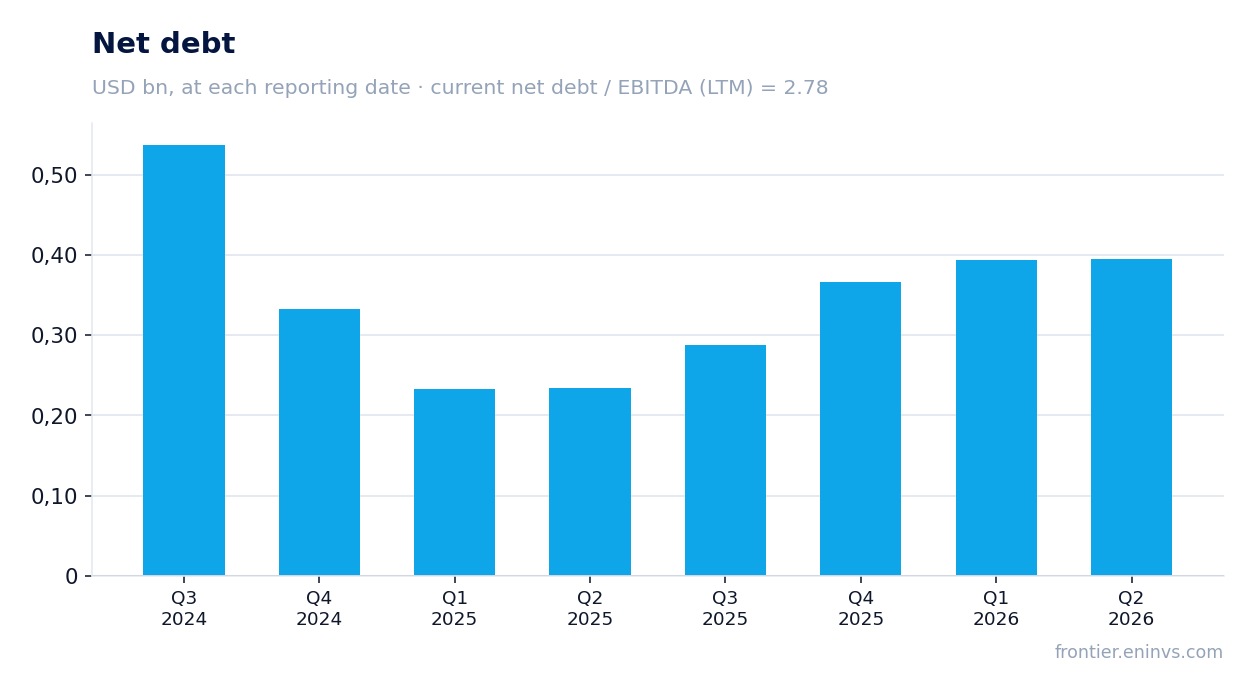
Net debt at the end of the second quarter of 2026 was USD 394.3m. That equals 2.78x LTM EBITDA of USD 141.9m. The debt-to-EBITDA ratio is a key metric for a company that posted net losses in prior periods, and 2.78x is a moderate level that does not create immediate pressure.
Over the last twelve months net debt increased by RUB 0.2bn, and versus the previous reporting date by RUB 0.0bn. Rising debt against falling EBITDA means the burden could increase if profit does not recover. However, the current 2.78x does not look critical, and the company has room for manoeuvre.
Operating cash flow was just USD 15.4m for the quarter against USD 11.0m of capex
Operating cash flow in the second quarter of 2026 was USD 15.4m. Capital expenditure for the same period was USD 11.0m. Free cash flow was therefore about USD 4.4m – positive, but very small relative to debt of USD 394.3m.
Over the last twelve months operating cash flow was USD 43.4m. With capex averaging around USD 10m per quarter, annual free cash flow barely covers interest on the debt. This limits the company's ability to reduce debt and invest in growth without raising new financing.
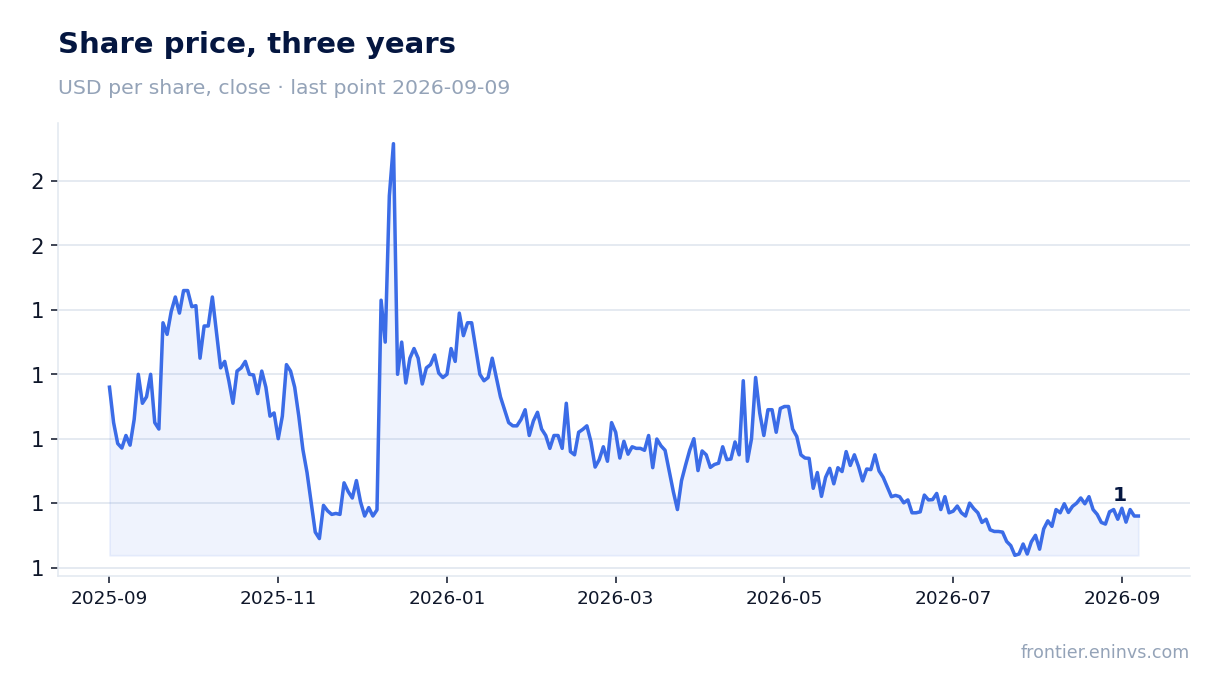
On the portal's model the stock is 58% below its fair value
Our model values Cresco Labs shares based on current commodity prices and a target EV/EBITDA multiple. According to this model, the upside to fair value is 58%. This is our own estimate, not a market consensus or a target price.
The current LTM EV/EBITDA multiple is 4.71x. We do not have three-year historical data to compare, so we cannot say whether the current level is above or below its average. However, the 58% upside on the model suggests the market is pricing in either a further decline in EBITDA or refinancing risk. If revenue continues to grow and the margin stabilises, this gap could narrow.
Valuation on the latest reported figures
| Metric | Value |
|---|---|
| Market cap | 0.27 bn USD |
| EV/EBITDA (LTM) | 4.7 |
| P/B | 0.76 |
| Net debt / EBITDA (LTM) | 2.78 |
| Operating cash flow (LTM) | 0.04 bn |
| ROE | 19.3% |
Bottom line
The strong point of the report is the return to revenue growth for the first time in a year: USD 173.3m, up 5.9% year on year. The weak point is profit: EBITDA fell 32.7%, the margin compressed to 15.3%, and net profit of USD 16.8m owes its existence to items below the operating line, since operating profit was only USD 13.4m. Debt of USD 394.3m equals 2.78x LTM EBITDA, and with current operating cash flow, debt servicing does not pose an immediate threat, but it leaves little room for manoeuvre. On our model the stock is 58% undervalued, making it rather attractive for those who believe revenue growth will continue. The key question is whether the turnaround is confirmed in the second half.
Open the company's financial profile CRLBF →
See also: market overview · valuation map · stock screeners