Curaleaf Holdings: profit returned, but it was made by a tax benefit, not by sales
On August 6, Curaleaf Holdings reported results for the second quarter of 2026. Revenue rose 8.1% year on year to $340.1 million, adjusted EBITDA – by 18.4% to $70.1 million, and net income came in at $12.5 million against a loss of $65.0 million a year earlier. The profit appeared thanks to a tax benefit of $38.8 million, not operational improvement: operating profit remained near zero at $4.2 million. In our assessment, the share looks unattractive: the portal's model shows minus 83% to fair value, and debt at 2.06 EBITDA LTM leaves no room for error.
Key takeaways
— Revenue rose 8.1% year on year, and almost all the growth came from the international segment
— EBITDA added 18.4%, but its margin of 20.6% is below last year's 21.9%
— Net income of $12.5 million was made by a tax benefit of $38.8 million, not by operations
— Operating profit remains near zero – $4.2 million on revenue of $340.1 million
— Free cash flow for the half-year was only $17.4 million
— Debt at 2.06 EBITDA LTM and EV/EBITDA of 12.7 leave no margin of safety
— The portal's model shows minus 83% to the share's fair value
Attractiveness
Key figures, USD bn
| Metric | Q2 2025 | Q2 2026 | Change |
|---|---|---|---|
| Revenue | 0.31 | 0.34 | +8.1% |
| EBITDA | 0.06 | 0.07 | +18.4% |
| Operating profit | 0.00 | 0.00 | +28.5% |
| Net profit | -0.07 | 0.01 | to profit |
| Operating cash flow | 0.01 | 0.03 | +243.5% |
| Capex | 0.02 | 0.02 | +5.0% |
| EBITDA margin | 18.8% | 20.6% | +1.8 pp |
| Net margin | -20.7% | 3.7% | +24.4 pp |
Revenue rose 8.1% year on year, and almost all the growth came from the international segment
Revenue in the second quarter of 2026 was $340.1 million, up 8.1% from a year earlier. This is the second consecutive quarter of year-on-year growth after a prolonged decline: in the first quarter of 2025 revenue fell 9.1%, in the second – 8.1%, in the third – 3.1%, and in the fourth quarter of 2025 growth was 20.6%. Sequential growth to the first quarter of 2026 was 5%.
The main contribution came from the international segment: its revenue grew 26% year on year to $51.4 million. The US segment added 7% to $288.7 million. Within the international business, wholesale sales rose to $31.9 million from $26.0 million a year earlier, retail – to $16.4 million from $12.9 million.
Growth in the US is mainly driven by wholesale: revenue from wholesale sales in the American segment increased to $64.0 million from $53.2 million a year earlier, while retail added only 3.7% to $224.4 million. This means that the recovery of the US business still relies on the wholesale channel, not on like-for-like retail sales.
EBITDA added 18.4%, but its margin of 20.6% is below last year's 21.9%
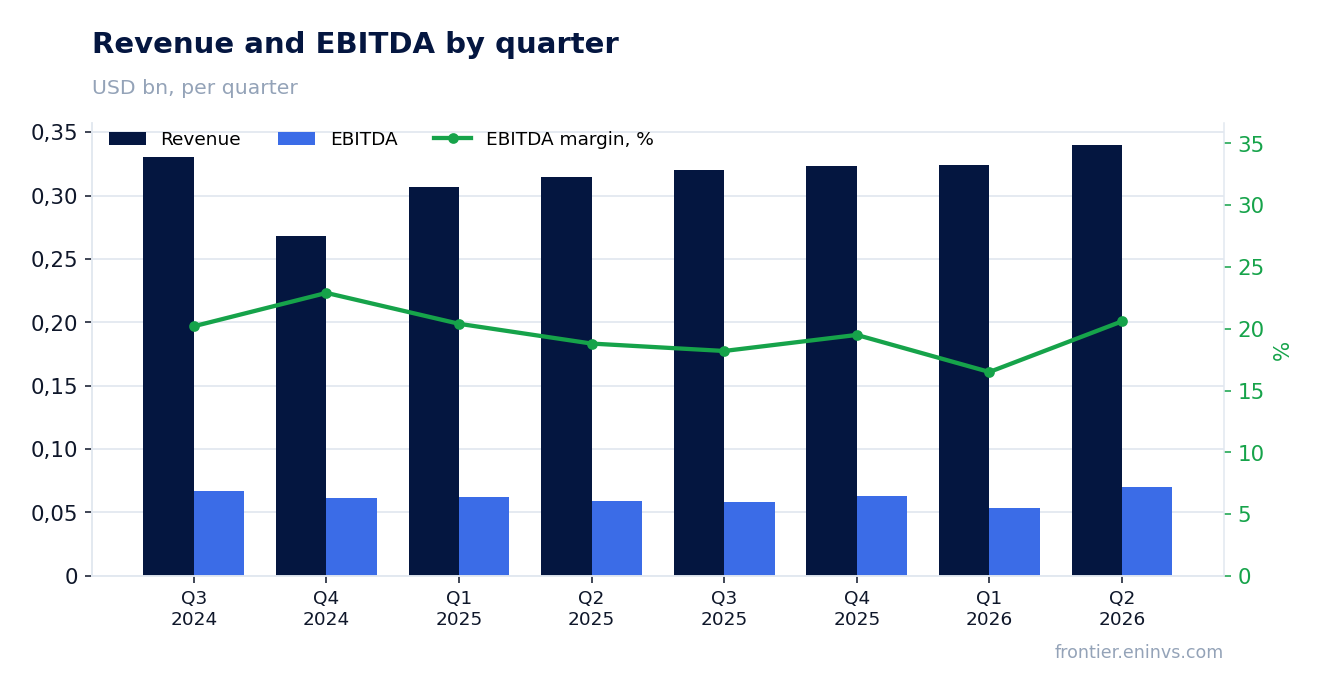
Adjusted EBITDA in the second quarter of 2026 was $70.1 million, up 18.4% from a year earlier. However, EBITDA margin declined to 20.6% from 21.9% a year earlier. Growth in the absolute figure with a falling margin means that costs are growing faster than revenue.
The main pressure on the margin came from selling, general and administrative expenses: they rose to $131.7 million from $111.4 million a year earlier, or by 18.2%. This is significantly faster than revenue growth of 8.1%. Gross margin, by contrast, improved: gross profit was $169.9 million at a margin of 50%, which is 70 basis points above last year's 49.3%.
Thus, the improvement in gross margin was fully absorbed by the growth in operating expenses. Adjusted EBITDA for the first half of 2026 was $133.5 million at a margin of 20.1% against 21.7% a year earlier – that is, pressure on the margin is observed not only in the standalone quarter but also for the half-year as a whole.
Net income of $12.5 million was made by a tax benefit of $38.8 million, not by operations
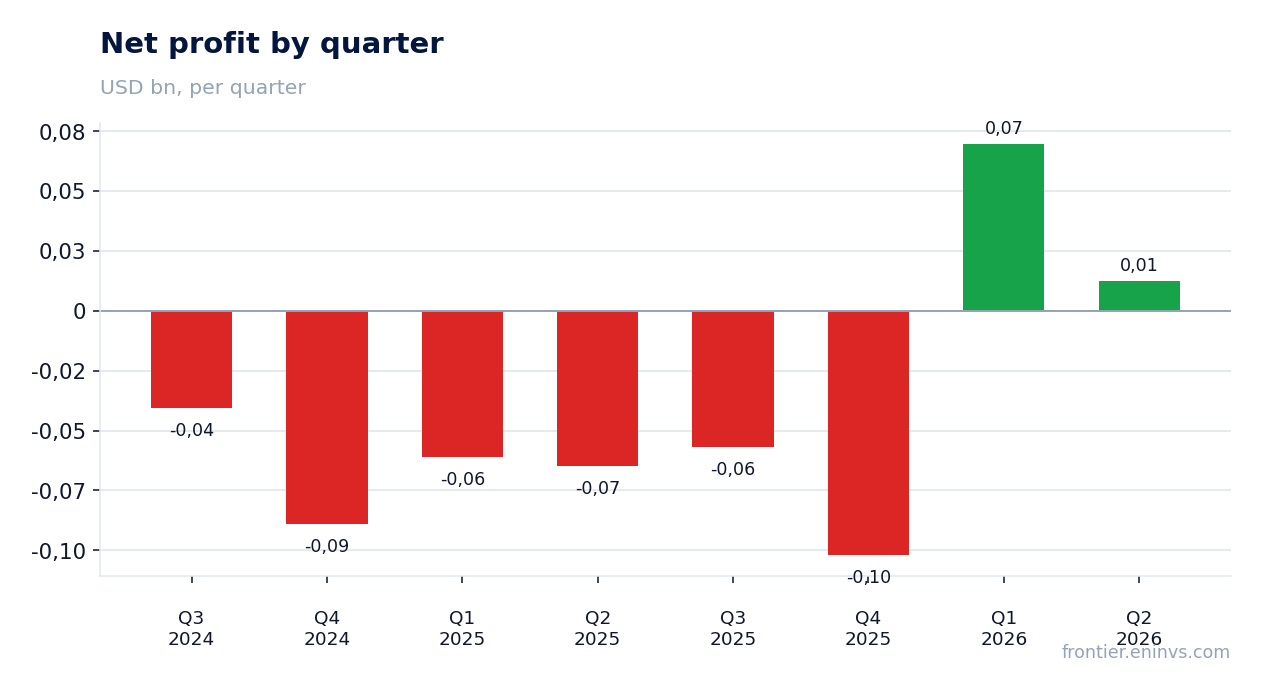
Net income in the second quarter of 2026 was $12.5 million against a loss of $65.0 million a year earlier. However, this result was shaped not by operating activity but by a tax benefit: the company recognised an income tax benefit of $38.8 million. Without this benefit, the company would have posted a loss.
Operating profit from continuing operations was only $4.2 million against $6.2 million a year earlier. On revenue of $340.1 million, this means an operating margin of about 1.2%. Interest expense on notes payable and deferred consideration liabilities was $17.8 million, on lease liabilities – $9.9 million. Total other expenses reached $30.5 million.
For the first half of 2026, net income was $82.3 million against a loss of $113.9 million a year earlier. But here too the main factor was a tax benefit of $137.5 million. Operating profit for the half-year was only $5.0 million. This confirms that profit at the group level does not yet reflect the business's ability to earn from core operations.
Operating profit remains near zero – $4.2 million on revenue of $340.1 million
Operating profit in the second quarter of 2026 was $4.2 million, corresponding to a margin of 1.2%. A year earlier operating profit was $6.2 million on revenue of $310.6 million, that is, a margin of 2.0%. Despite revenue growth, operating profit declined in absolute terms.
The reason is the outpacing growth of operating expenses. Selling, general and administrative expenses rose 18.2% to $131.7 million, while revenue grew 8.1%. Depreciation and amortisation within operating expenses declined to $34.0 million from $35.5 million, but this did not offset the growth in other items.
For the first half of 2026, operating profit was $5.0 million against $15.6 million a year earlier. This means the company cannot yet convert revenue growth into operating profit. Until this trend changes, the sustainability of profit at the group level remains questionable.
Free cash flow for the half-year was only $17.4 million
Operating cash flow from continuing operations for the first half of 2026 was $50.3 million. Capital expenditures for the same period were $32.9 million, including facility upgrades, automation and selective retail expansion. Free cash flow from continuing operations was only $17.4 million.
For comparison: over the trailing twelve months, operating cash flow was $141.0 million. This is significantly higher than the half-year figure, which indicates uneven cash generation. In the second quarter of 2026, operating cash flow was $29.3 million, better than $8.5 million in the second quarter of 2025, but below $48.4 million in the third quarter of 2025.
The company reported that over six months it repurchased 1.01 million shares for a total of $7.4 million. This is an insignificant amount compared to the market capitalisation of $2.6 billion. With free cash flow of $17.4 million for the half-year, the scope for significant buybacks or dividends is limited.
Debt at 2.06 EBITDA LTM and EV/EBITDA of 12.7 leave no margin of safety
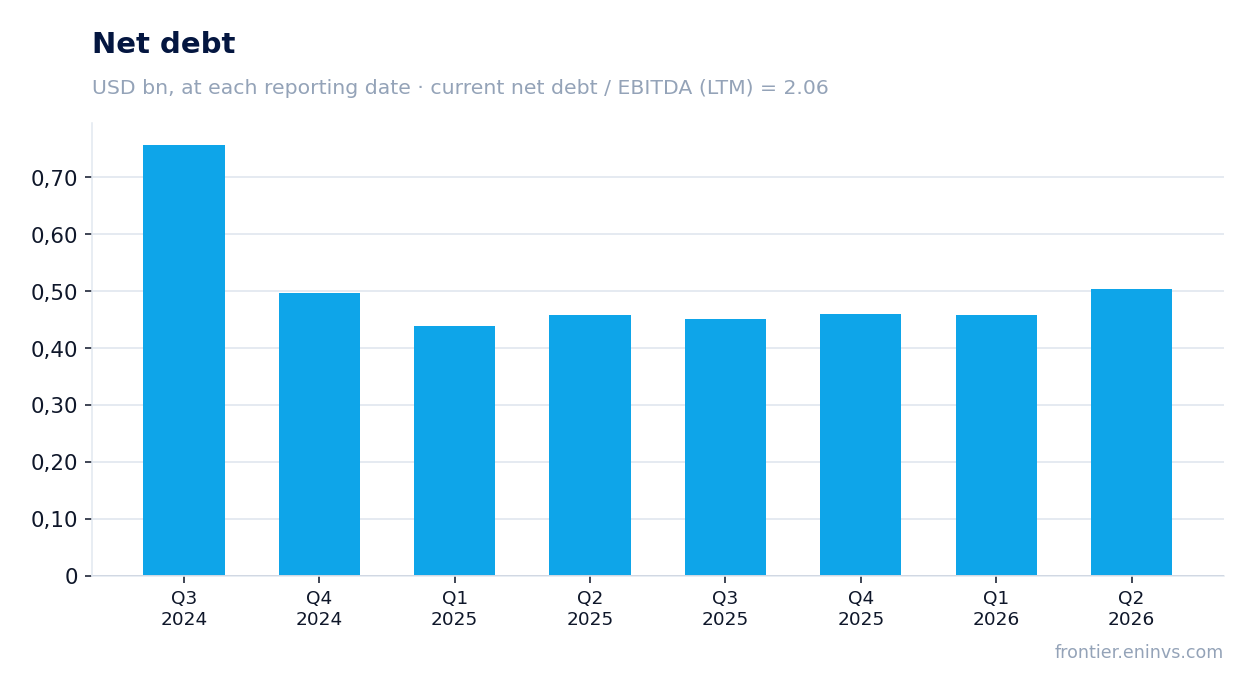
Net debt at the end of the second quarter of 2026 was $504.5 million. The ratio of net debt to EBITDA for the trailing twelve months is 2.06. This is a moderate level, but it is not declining: net debt rose by 0.1 billion rubles over the quarter and by 0.1 billion rubles over twelve months. The company does not disclose the dynamics of the ratio, so we present it as a level, not as a trend.
Total debt including unamortised discounts and deferred financing fees was $611.5 million. Cash and cash equivalents at the end of the quarter were $107.0 million. Interest expense on notes payable and deferred consideration liabilities was $17.8 million for the quarter, on lease liabilities – $9.9 million. Total interest expense for the quarter was $27.7 million.
EV/EBITDA for the trailing twelve months is 12.7. This is a high multiple for a company with an operating margin of about 1% and negative free cash flow after capital expenditures. At the current level of debt and interest expense, any slowdown in revenue growth or decline in EBITDA could lead to a deterioration in credit metrics.
The portal's model shows minus 83% to the share's fair value
According to the portal's model, which reprices EBITDA at current commodity prices at a target EV/EBITDA and compares it with market capitalisation, the upside of the share to fair value is minus 83%. This is our own estimate, not a market consensus and not a target price. It reflects a significant gap between the current price and the fundamental value of the business.
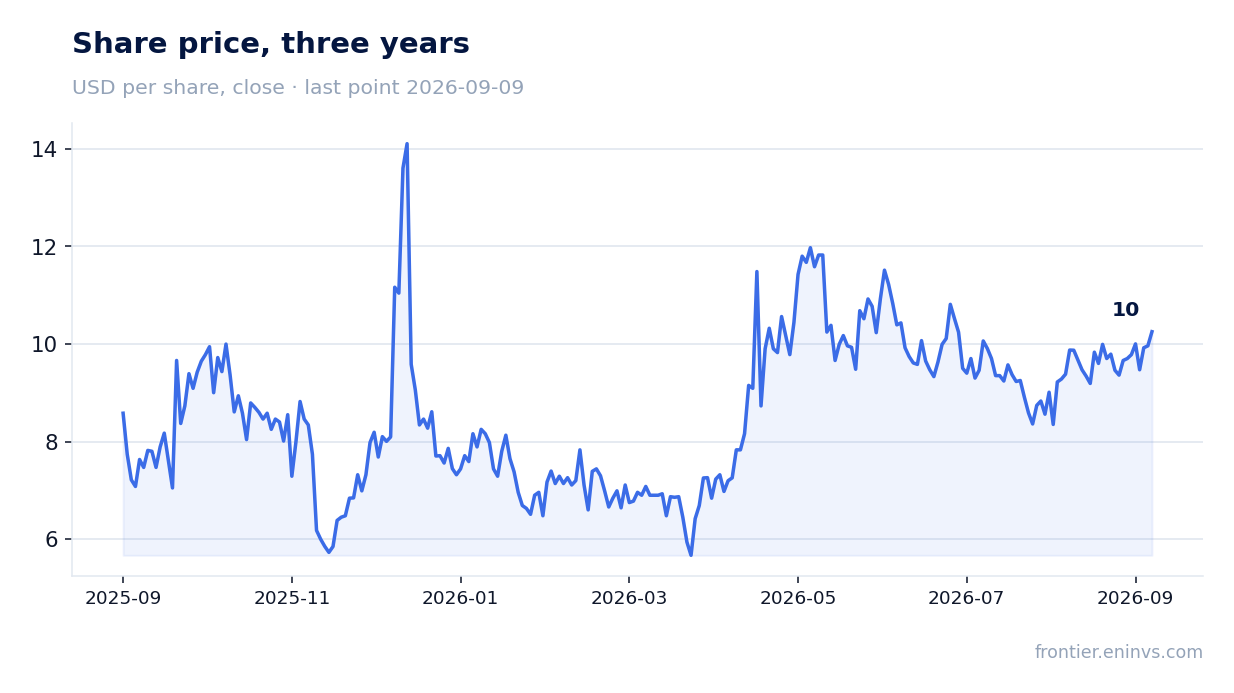
Market capitalisation at the time of the report was $2,603.8 million. The share closed at $8.35 before the release, rose 10.4% on the release day, and from the release to September 9, 2026 – by 22.8%. Thus, the market reacted positively to the report, despite the fact that profit was shaped by a tax benefit.
Return on equity is 5.9%. With an EV/EBITDA multiple of 12.7 and a return on capital below 6%, the share looks expensive relative to its own ability to generate profit. A change in valuation requires sustainable growth in operating profit, not one-off tax effects.
Valuation on the latest reported figures
| Metric | Value |
|---|---|
| Market cap | 2.60 bn USD |
| EV/EBITDA (LTM) | 12.7 |
| P/B | 3.00 |
| Net debt / EBITDA (LTM) | 2.06 |
| Operating cash flow (LTM) | 0.14 bn |
| ROE | 5.9% |
Bottom line
The strengths of the report are the return to revenue growth for the second consecutive quarter, an improvement in gross margin to 50%, and 26% growth in the international segment. However, net income of $12.5 million was shaped by a tax benefit of $38.8 million, while operating profit remains near zero at $4.2 million. Free cash flow for the half-year was only $17.4 million, and debt at 2.06 EBITDA LTM and EV/EBITDA of 12.7 leave no margin of safety. According to the portal's model, the share is overvalued by 83% relative to fair value. The question for a holder now is not whether growth has returned, but when it will begin to translate into operating profit and cash flow.
Open the company's financial profile CURLF →
See also: market overview · valuation map · stock screeners