Delek US: Q2 2026 profit returned, but the year-on-year swing came from one quarter, not durable growth

Delek US reported Q2 2026 results. Revenue rose 47.8% year on year to USD 4,087.0m, EBITDA reached USD 418.1m versus USD 60.6m a year earlier, and net profit was USD 169.5m against a loss of USD 106.4m. The EBITDA margin rose to 10.7% from 2.2%, and the net margin to 4.1% from minus 3.8%. Over the trailing twelve months, however, net profit is USD 224.5m and return on equity is negative. In our view the share looks neutral: the quarter is strong, but it is one quarter, and the multiples already price in a recovery.
Key takeaways
— Revenue rose 47.8% year on year, but this is a rebound from a weak Q2 2025 base, not an acceleration
— EBITDA of USD 418.1m and a 10.7% margin mark the best quarter in two years, but the year-on-year comparison is distorted by a low base
— Net profit of USD 169.5m in Q2 2026 versus a loss of USD 106.4m a year earlier, yet trailing twelve-month profit is only USD 224.5m
— Operating cash flow of USD 262.9m against capex of USD 177.1m leaves about USD 86m of free cash for the quarter
— Net debt of USD 2,561.1m and a net debt/EBITDA of 2.62 for the trailing twelve months – a level that limits flexibility
— Dividend yield of 1.35% with payouts maintained despite a loss-making Q1 2026
— EV/EBITDA of 7.10 and P/E of 20.36 – the market already prices in a profit recovery, not the trailing twelve-month loss
Attractiveness
Key figures, USD bn
| Metric | Q2 2025 | Q2 2026 | Change |
|---|---|---|---|
| Revenue | 2.76 | 4.09 | +47.8% |
| EBITDA | 0.06 | 0.44 | +622.3% |
| Operating profit | -0.03 | 0.30 | to profit |
| Net profit | -0.11 | 0.17 | to profit |
| Operating cash flow | 0.05 | 0.26 | +411.5% |
| Capex | 0.17 | 0.18 | +6.8% |
| EBITDA margin | 2.2% | 10.7% | +8.5 pp |
| Net margin | -3.8% | 4.1% | +7.9 pp |
Revenue rose 47.8% year on year, but this is a rebound from a weak Q2 2025 base, not an acceleration
In Q2 2026 Delek US revenue reached USD 4,087.0m, up 47.8% from Q2 2025. That growth looks impressive, but it mainly reflects a low base: last year's Q2 revenue was USD 2,764.6m, one of the weakest quarters in two years. Sequentially, revenue rose 1.5 times from USD 2,653.1m in Q1 2026, confirming this is a rebound rather than a smooth acceleration.
The prior quarterly trend shows revenue declining year on year for three consecutive quarters: down 15.5% in Q1 2025, down 16.4% in Q2, down 5.1% in Q3. Only in Q4 2025 did growth return at 2.3%, followed by 0.4% in Q1 2026. Q2 2026's 47.8% is a sharp spike against near-zero growth earlier in the year. A durable trend would need at least one more quarter of high growth.
Revenue growth in refining is typically driven by crude prices and utilisation, but the facts provided do not break these out. We can only state that revenue rose, and this is the first quarter with such a pace in two years. What caused it – volumes, prices, or one-offs – is not evident from the available data.
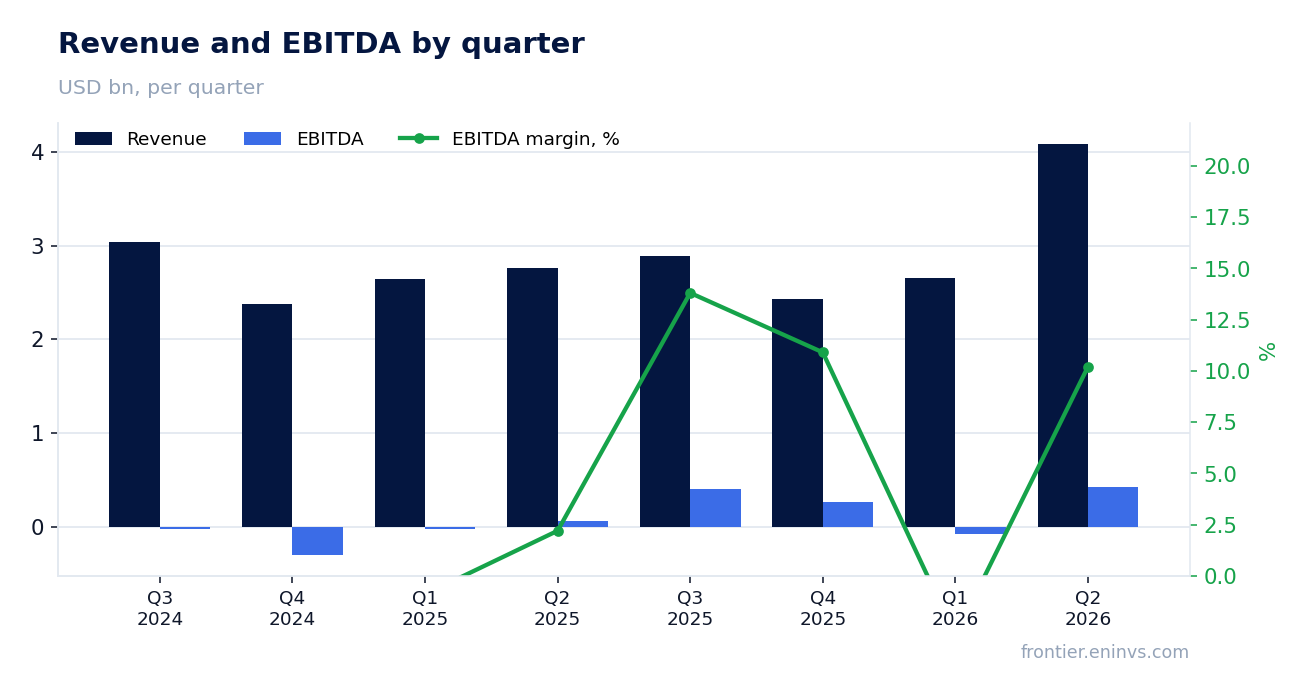
EBITDA of USD 418.1m and a 10.7% margin mark the best quarter in two years, but the year-on-year comparison is distorted by a low base
EBITDA in Q2 2026 was USD 418.1m, with an EBITDA margin of 10.7%. A year earlier EBITDA was USD 60.6m at a 2.2% margin. This 6.9-fold increase is explained not only by a strong current quarter but also by an extremely weak base: in Q2 2025 the margin was just 2.2%, and in Q1 2026 EBITDA was negative at minus USD 76.0m.
Sequentially, EBITDA has improved steadily since Q3 2025: USD 397.0m in Q3, USD 265.7m in Q4, minus USD 76.0m in Q1 2026, and USD 418.1m in Q2. Q1 2026 stands out with a loss, but Q2 not only offset it but exceeded the Q3 2025 level. This points to a recovery in profitability, though so far within a single quarter.
Operating profit in Q2 2026 was USD 302.4m versus a loss of USD 33.5m a year earlier. The gap between EBITDA and operating profit reflects depreciation and other non-cash items not detailed in the facts. Nevertheless, positive operating profit after a series of losses is a significant shift.
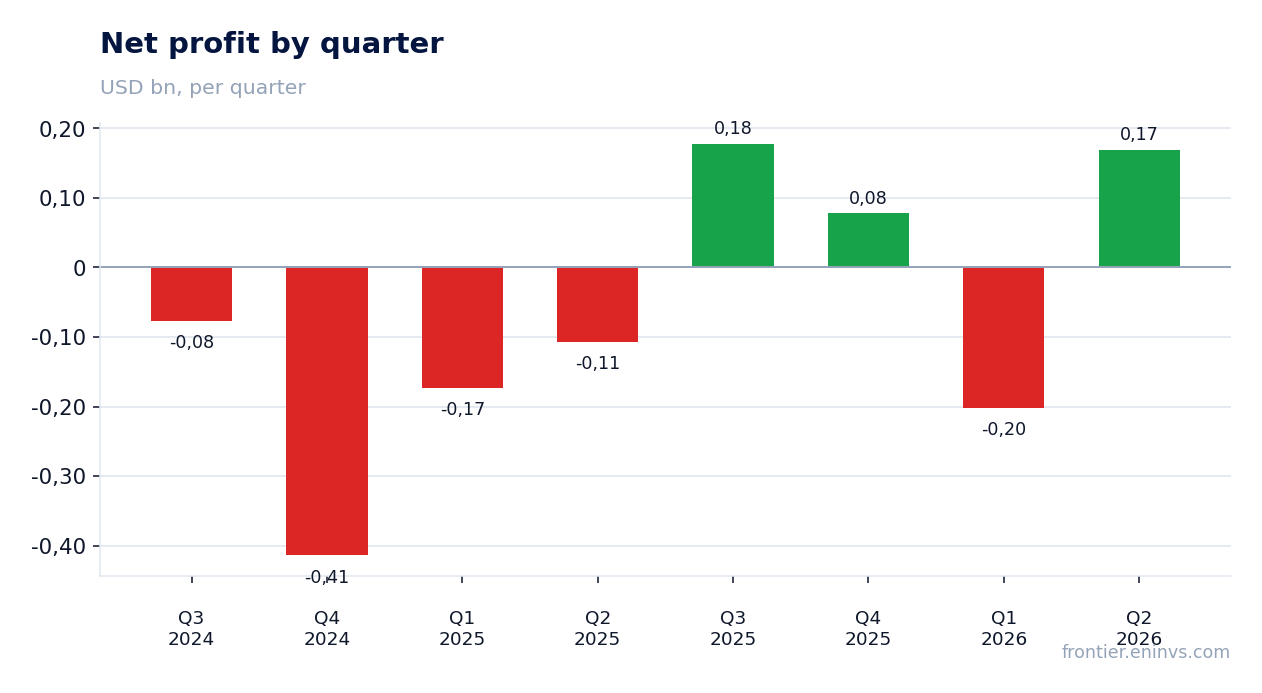
Net profit of USD 169.5m in Q2 2026 versus a loss of USD 106.4m a year earlier, yet trailing twelve-month profit is only USD 224.5m
Net profit in Q2 2026 was USD 169.5m, compared with a loss of USD 106.4m a year earlier. The net margin rose to 4.1% from minus 3.8%. This is the first quarter with positive net profit after a loss of USD 201.3m in Q1 2026 and losses in prior periods. However, trailing twelve-month net profit is only USD 224.5m, barely more than the profit of Q2 alone.
Such concentration of profit in one quarter means the annual result is not yet stable. Excluding Q2 2026, net profit for the other nine months is barely positive. This suggests that profit sustainability is not yet confirmed. Return on equity for the trailing twelve months is negative (–189.6%), reflecting accumulated losses from prior periods and a low equity base.
For an investor, the sharp swing from loss to profit is notable. It could stem from either an improved operating environment or one-off factors, but the facts do not provide a breakdown of one-offs. We can only state that profit has appeared, but its annual volume is still small relative to market capitalisation.
Operating cash flow of USD 262.9m against capex of USD 177.1m leaves about USD 86m of free cash for the quarter
In Q2 2026 operating cash flow was USD 262.9m, while capex was USD 177.1m. The difference, about USD 86m, is free cash flow that can be directed to dividends, debt reduction, or other corporate purposes. For comparison, in Q1 2026 operating cash flow was USD 461.1m with capex of USD 187.7m, yielding about USD 273m of free cash. Thus, free cash generation declined in Q2 despite higher profit.
Over the trailing twelve months, operating cash flow was USD 535.8m. This is significantly less than EBITDA for the same period (USD 1,021.6m), due to working capital changes and other non-cash items. Capex for the twelve months can be estimated as the sum of quarterly figures: 119.0 + 190.5 + 135.7 + 165.8 + 108.0 + 120.0 + 187.7 + 177.1 = USD 1,203.8m. This means free cash flow for the twelve months is negative if only these items are considered.
Negative free cash flow for the year is an important fact. It indicates that the company is not yet generating enough funds to cover capex, let alone dividends. On a quarterly basis, Q2 2026 was positive, but the annual result remains under pressure. This limits the ability to reduce debt or increase payouts.
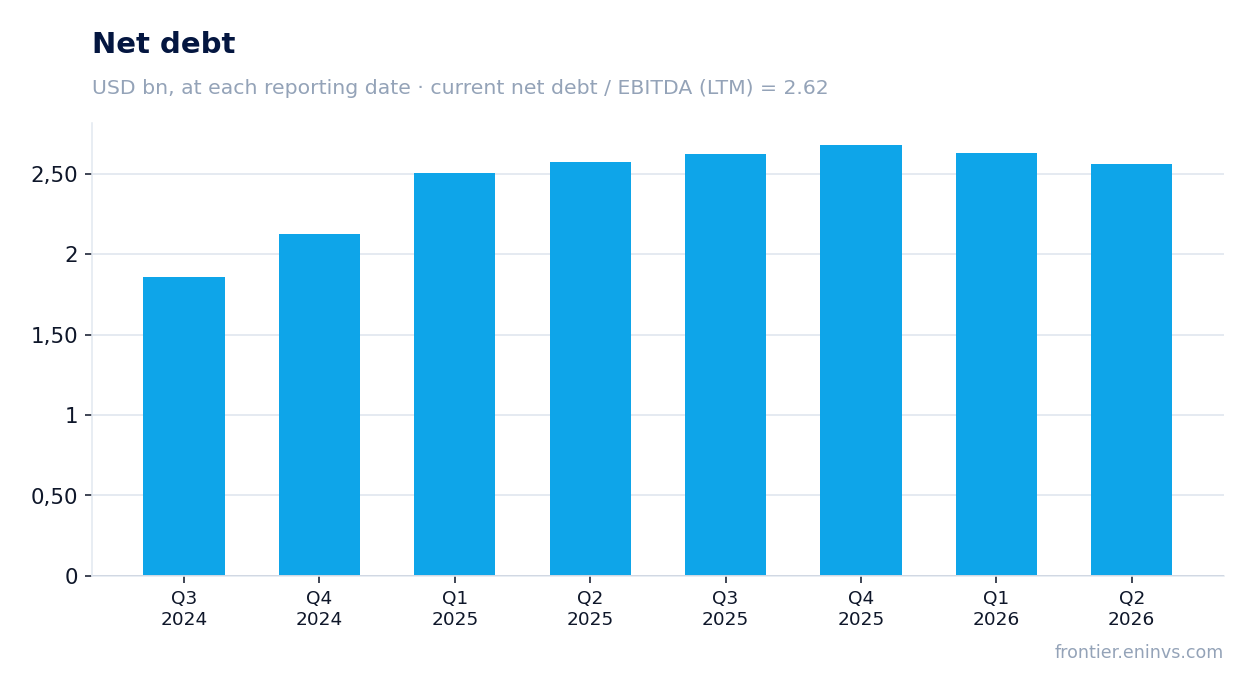
Net debt of USD 2,561.1m and a net debt/EBITDA of 2.62 for the trailing twelve months – a level that limits flexibility
At the end of Q2 2026, Delek US net debt was USD 2,561.1m. This is USD 0.1bn less than at the previous reporting date and about USD 0.0bn less than a year ago, according to the provided data. However, these changes are insignificant, and debt remains high. The net debt/EBITDA ratio for the trailing twelve months is 2.62. This is a moderate level, but it does not provide much freedom for additional borrowing, especially with negative free cash flow for the year.
For comparison, in prior quarters net debt ranged from USD 1,861.1m in Q3 2024 to USD 2,680.6m in Q4 2025. The current value of USD 2,561.1m is below the peak but above 2024 levels. The company is not sustainably reducing debt; rather, it has stabilised. Meanwhile, trailing twelve-month EBITDA of USD 1,021.6m covers debt 2.62 times. This is not critical, but it is not comfortable for a company with negative free cash flow.
Interest expenses are not detailed in the facts, but at this debt level they can significantly affect net profit. With quarterly profit only just recovering, the debt burden remains a risk factor. If EBITDA declines again, the debt/EBITDA ratio could rise, limiting financial flexibility.
Dividend yield of 1.35% with payouts maintained despite a loss-making Q1 2026
Delek US trailing twelve-month dividend yield is 1.35%. This is a low level that does not compensate for the risks associated with profit volatility and debt burden. The company maintains payouts even during loss periods, as in Q1 2026 when net loss was USD 201.3m. This indicates a commitment to dividend policy, but also that payouts may be funded from debt or reserves.
Our estimate for the current year's dividend is based on the available facts. With trailing twelve-month net profit of USD 224.5m and a payout ratio not disclosed by the company, we can only assume the dividend will remain at a level providing a yield of about 1.35% on the current price. This corresponds to roughly USD 62m in payouts, based on a market capitalisation of USD 4,569.8m. However, this estimate is ours, and it depends on whether profit persists in the second half.
The key risk to the dividend is further deterioration in the operating environment. If EBITDA turns negative again, as in Q1 2026, the company may revise the payout. Moreover, negative free cash flow for the twelve months means dividends may be funded by new borrowing, increasing debt. With a yield of 1.35% and a key rate that is not in the facts but remains high in the US, the dividend does not look attractive for income-oriented investors.
EV/EBITDA of 7.10 and P/E of 20.36 – the market already prices in a profit recovery, not the trailing twelve-month loss
Currently, Delek US trailing twelve-month EV/EBITDA is 7.10 and P/E is 20.36. These multiples reflect market expectations rather than current earnings. A P/E above 20 with trailing twelve-month net profit of only USD 224.5m and negative return on equity means investors are pricing in significant future profit growth. EV/EBITDA of 7.10 is a moderate level for refining, but it does not look cheap given industry volatility.
We cannot compare current multiples with three-year averages because the facts do not provide historical EV/EBITDA or P/E values. However, we can note that a P/E of 20.36 with negative ROE and unstable profit is a high figure. If profit does not continue to grow, the multiple could correct downward. EV/EBITDA of 7.10 implies the market values the business at about 7 times EBITDA, which may be optimistic for a company with a debt ratio of 2.62 and negative free cash flow.
According to the portal's model, which re-prices EBITDA at current commodity prices at the target EV/EBITDA, the upside to fair value is estimated at +25%. This is our own estimate, not a market consensus. It suggests that under a favourable scenario the share may be undervalued, but this estimate is sensitive to assumptions about EBITDA and the target multiple. If EBITDA turns out lower, the upside will shrink.
Valuation on the latest reported figures
| Metric | Value |
|---|---|
| Market cap | 4.57 bn USD |
| P/E (LTM) | 20.4 |
| EV/EBITDA (LTM) | 7.1 |
| P/B | 8.35 |
| Net debt / EBITDA (LTM) | 2.62 |
| Operating cash flow (LTM) | 0.54 bn |
| ROE | -189.6% |
| Dividend yield (12m) | 1.4% |
Bottom line
Q2 2026 was Delek US's strongest quarter in two years: revenue rose 47.8%, EBITDA reached USD 418.1m, and net profit was USD 169.5m against a loss a year earlier. However, this result was achieved against an extremely weak base last year and a loss-making Q1 2026. Over the trailing twelve months, net profit is only USD 224.5m, free cash flow is negative, and the debt ratio remains at 2.62 to EBITDA. A dividend yield of 1.35% does not compensate for these risks. In our view, the share looks neutral: the market already prices in a profit recovery, and at least one more strong quarter is needed to confirm the trend.
Open the company's financial profile DK →
See also: market overview · valuation map · stock screeners