Daqo New Energy: Q2 2026 revenue fell 17% year on year while EBITDA remains negative
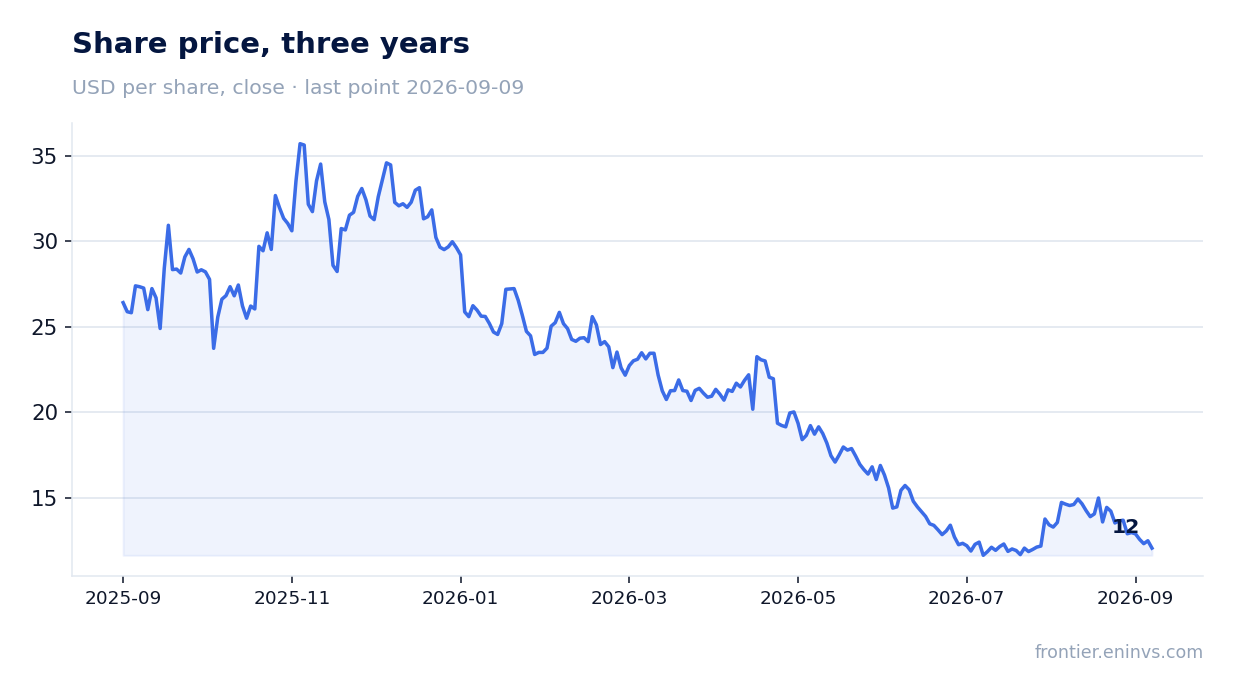
Daqo New Energy reported Q2 2026 results. Revenue came in at $62.7 million, down 17.0% year on year, while EBITDA was negative at -$98.1 million and net profit also negative at -$81.2 million. The EBITDA margin was -156.5% versus -71.9% a year earlier. At the current share price, the stock looks unattractive: the company remains loss-making at the operating level and operating cash flow is negative.
Key takeaways
— Q2 2026 revenue fell 17.0% year on year to $62.7 million, reflecting continued pressure on polysilicon prices
— Negative EBITDA of $98.1 million resulted in a margin of -156.5%, significantly worse than last year's -71.9%
— Operating loss in Q2 2026 was $98.1 million, matching EBITDA, indicating no significant non-cash adjustments
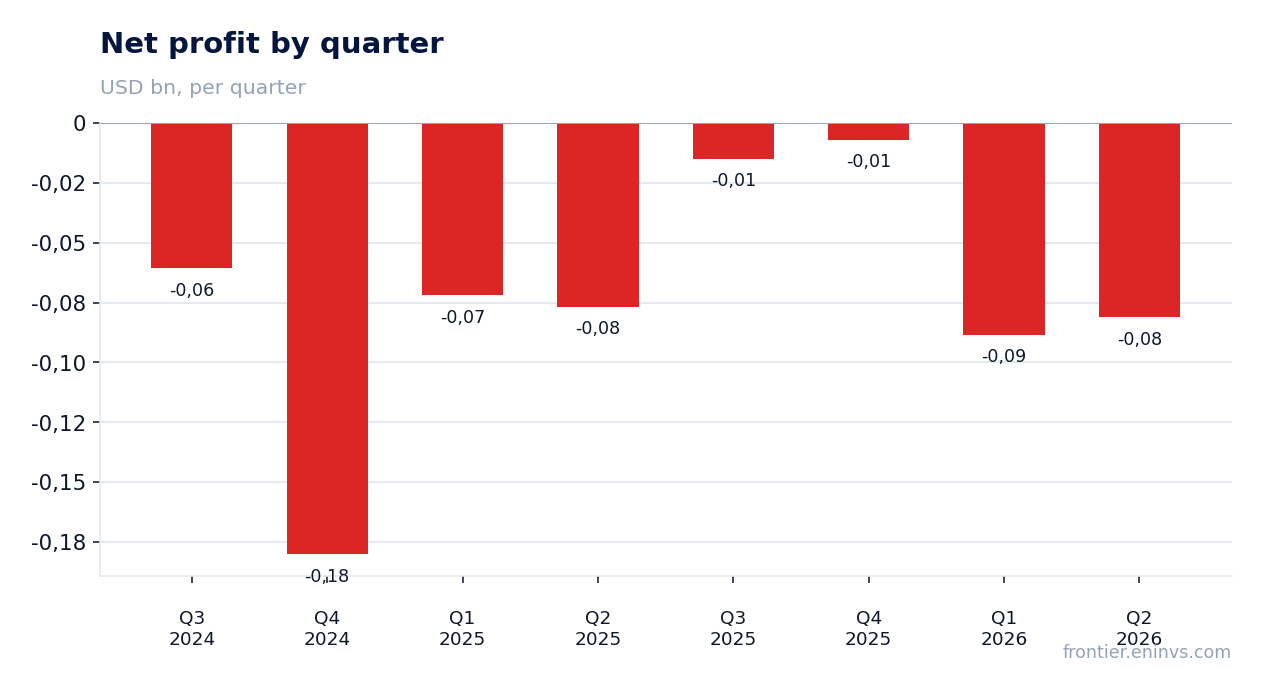
— Net loss in Q2 2026 was $81.2 million, with net margin falling to -129.5% from -101.7% a year earlier
— Operating cash flow remains negative at -$128.7 million for the quarter, with capital expenditures of $26.5 million
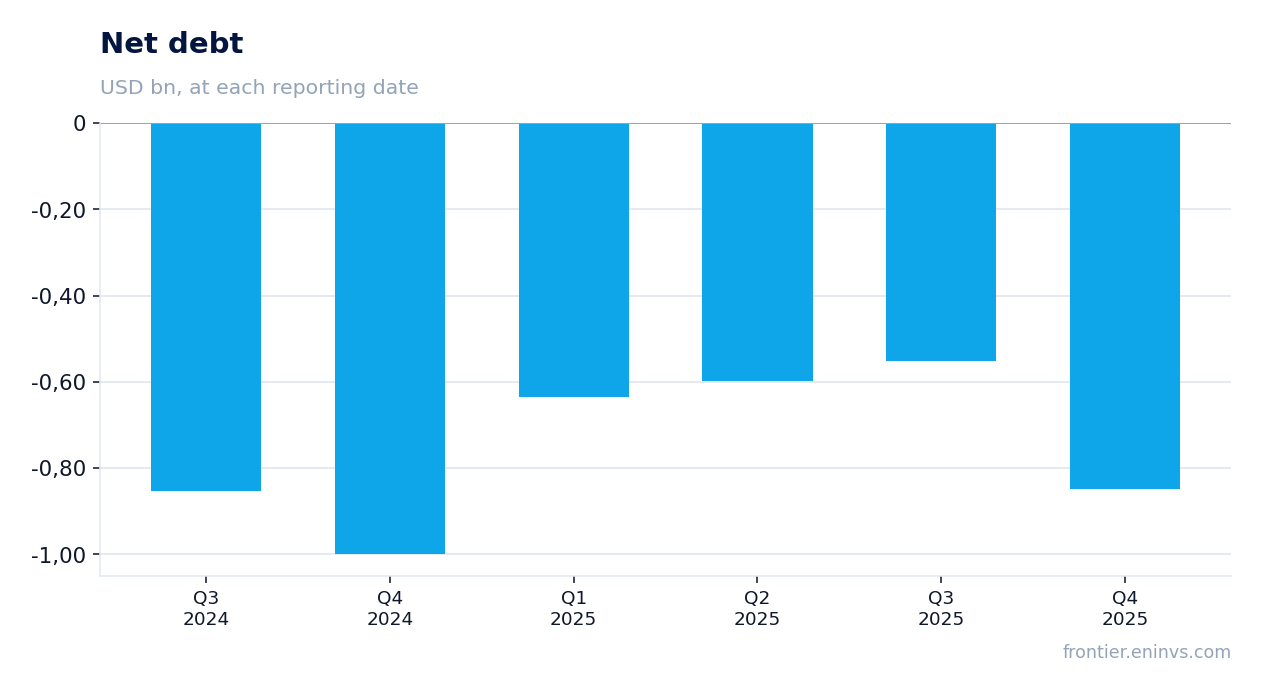
— Debt burden remains low: net cash position at the end of Q2 2026 was $849.2 million, providing a cushion
— EV/EBITDA LTM stands at 0.22, below historical levels, but reflects the company's loss-making status
Attractiveness
Key figures, USD bn
| Metric | Q2 2025 | Q2 2026 | Change |
|---|---|---|---|
| Revenue | 0.08 | 0.06 | -17.0% |
| EBITDA | -0.05 | -0.10 | — |
| Operating profit | -0.11 | -0.10 | — |
| Net profit | -0.08 | -0.08 | — |
| Operating cash flow | -0.07 | -0.13 | — |
| Capex | 0.03 | 0.03 | -12.9% |
| EBITDA margin | -71.9% | -156.5% | -84.6 pp |
| Net margin | -101.7% | -129.5% | -27.8 pp |
Q2 2026 revenue fell 17.0% year on year to $62.7 million, reflecting continued pressure on polysilicon prices
Daqo New Energy's revenue for Q2 2026 was $62.7 million, down 17.0% from the same period last year. The decline occurred amid a continued oversupply in the polysilicon market and low selling prices.
Compared to Q1 2026, revenue more than doubled from $26.7 million, but the year-on-year decline persists. Quarterly dynamics remain highly volatile: after a collapse in Q1, there was a partial rebound, but it did not offset the overall decline.
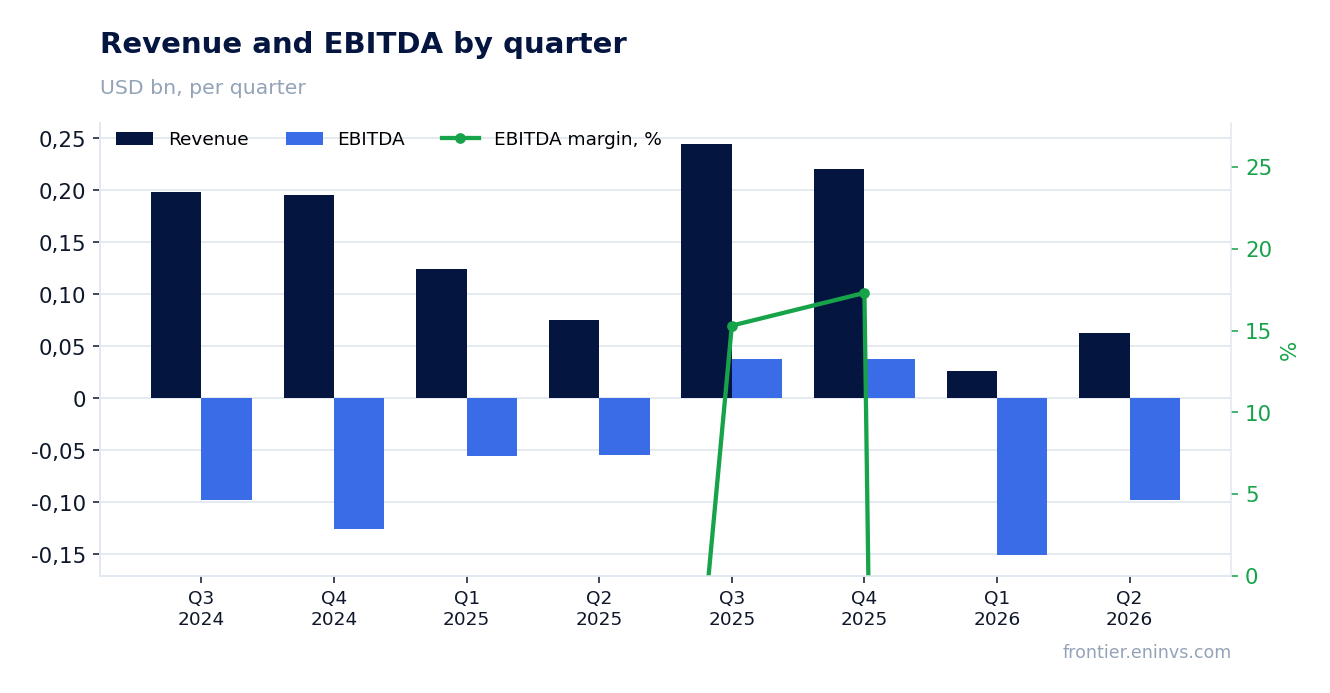
Negative EBITDA of $98.1 million resulted in a margin of -156.5%, significantly worse than last year's -71.9%
EBITDA in Q2 2026 was -$98.1 million, with an EBITDA margin of -156.5%. A year earlier, these figures were -$54.3 million and -71.9%, respectively. The margin deterioration occurred because revenue fell more than fixed costs could be reduced.
Operating loss exactly matched EBITDA at $98.1 million, indicating no significant non-cash items adjusting EBITDA. This is a pure operating loss, reflecting low capacity utilisation and high unit costs.
Operating loss in Q2 2026 was $98.1 million, matching EBITDA, indicating no significant non-cash adjustments
Operating loss for Q2 2026 was $98.1 million. This is $44.0 million more than a year earlier, when the loss was $54.3 million. The increase in loss is due to a further decline in revenue while a significant portion of fixed costs remained.
The match between operating loss and EBITDA means that depreciation and other non-cash items do not significantly affect the gap between these metrics. For an investor, this signals that the loss is operational in nature and cannot be explained by one-off write-downs.
Net loss in Q2 2026 was $81.2 million, with net margin falling to -129.5% from -101.7% a year earlier
Net loss in Q2 2026 was $81.2 million, $4.5 million more than a year earlier ($76.7 million). Net margin deteriorated to -129.5% from -101.7% a year earlier.
The difference between operating and net loss is explained by a positive balance of other income and expenses, likely including interest income from the cash cushion. However, this does not change the overall loss-making picture.
Operating cash flow remains negative at -$128.7 million for the quarter, with capital expenditures of $26.5 million
Operating cash flow in Q2 2026 was negative at -$128.7 million. This is $61.9 million worse than a year earlier (-$66.8 million). The negative flow is due to the loss and possibly working capital outflow.
Capital expenditures for the quarter were $26.5 million, $3.9 million less than a year earlier ($30.4 million). The company continues to invest despite losses, increasing the need for financing. Free cash flow remains deeply negative.
Debt burden remains low: net cash position at the end of Q2 2026 was $849.2 million, providing a cushion
Net cash position at the end of Q2 2026 was $849.2 million. This means cash and equivalents exceed debt obligations by this amount. Compared to the previous reporting date, net debt changed insignificantly by RUB 0.3 billion, and over 12 months increased by RUB 0.2 billion.
Low debt burden provides the company with financial stability and the ability to survive a period of low prices. However, negative operating cash flow is gradually reducing this cushion, which requires attention.
EV/EBITDA LTM stands at 0.22, below historical levels, but reflects the company's loss-making status
EV/EBITDA LTM stands at 0.22. This is a very low level that could indicate undervaluation, but in this case it reflects negative EBITDA over the last 12 months. The metric is not a reliable indicator of attractiveness because the denominator is negative.
The company's market capitalisation is $811.6 million, while its net cash position is $849.2 million. Thus, EV is close to zero or even negative, meaning the market values the business below the value of its cash. This could be a sign of extreme pessimism or expectations of further cash burn.
Valuation on the latest reported figures
| Metric | Value |
|---|---|
| Market cap | 0.81 bn USD |
| EV/EBITDA (LTM) | 0.2 |
| P/B | 0.18 |
| Operating cash flow (LTM) | 0.05 bn |
| ROE | -7.4% |
Bottom line
Bottom line: in Q2 2026, Daqo New Energy remains deeply loss-making. Revenue fell 17.0% year on year to $62.7 million, EBITDA is negative at -$98.1 million, and net profit is also negative at -$81.2 million. Operating cash flow is negative, and the company continues to incur capital expenditures. The only source of stability is the net cash position of $849.2 million, but it is gradually being spent. At the current share price, the stock looks unattractive due to the lack of signs of recovery in operating efficiency.
Open the company's financial profile DQ →
See also: market overview · valuation map · stock screeners