Eldorado Gold: profit up a quarter, but free cash flow eaten by record capex and net debt nearly doubled in the quarter
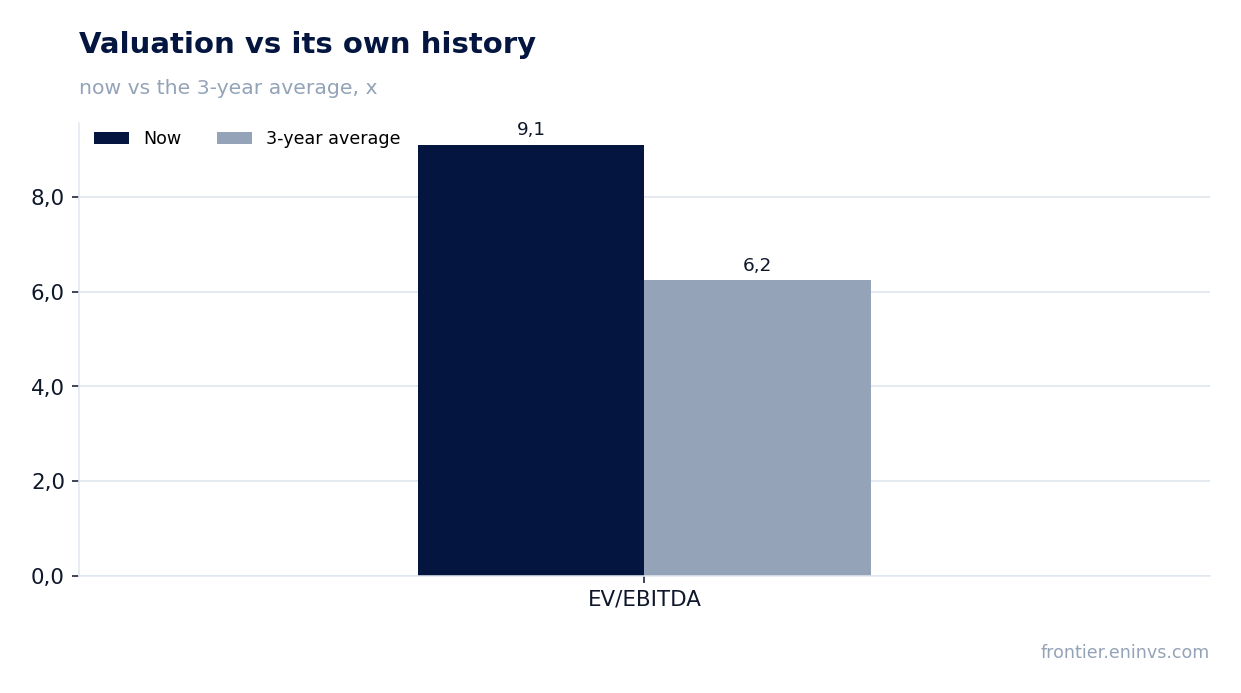
On 25 August Eldorado Gold reported second-quarter 2026 results. Revenue rose 7.9% year on year to USD 487.5 mn, EBITDA – 10.2% to USD 267.1 mn, net profit – 25.2% to USD 172.8 mn. The EBITDA margin improved to 54.8% from 53.6%, and the net margin to 35.5% from 30.6%. At the same time, capital expenditure jumped to USD 469.6 mn, free cash flow turned negative, and net debt nearly doubled in the quarter, from USD 601.1 mn to USD 1,195.4 mn. In our view the share looks unattractive at the current price: the EV/EBITDA multiple of 9.1 is above its own three-year average of 6.2, and the portal model implies 44% downside.
Key takeaways
— Revenue grew only 7.9% year on year, after 50.0% growth in the previous quarter
— EBITDA margin rose to 54.8% as operating costs took a smaller share of revenue
— Net profit rose 25.2%, but its quality is questionable given negative operating cash flow in Q4 2025
— Capital expenditure reached USD 469.6 mn, nearly three times operating cash flow
— Net debt jumped from USD 601.1 mn to USD 1,195.4 mn in the quarter, while net debt/EBITDA LTM stands at 0.4
— A dividend yield of 0.5% does not compensate for the risks of rising debt and negative free cash flow
— EV/EBITDA of 9.1 is above its own three-year average of 6.2, leaving no room for upside
Attractiveness
Key figures, USD bn
| Metric | Q2 2025 | Q2 2026 | Change |
|---|---|---|---|
| Revenue | 0.45 | 0.49 | +7.9% |
| EBITDA | 0.24 | 0.27 | +10.2% |
| Operating profit | 0.18 | 0.21 | +20.8% |
| Net profit | 0.14 | 0.17 | +25.2% |
| Operating cash flow | 0.15 | 0.15 | -1.3% |
| Capex | 0.20 | 0.47 | +136.5% |
| EBITDA margin | 53.6% | 54.8% | +1.2 pp |
| Net margin | 30.6% | 35.5% | +4.9 pp |
Revenue grew only 7.9% year on year, after 50.0% growth in the previous quarter
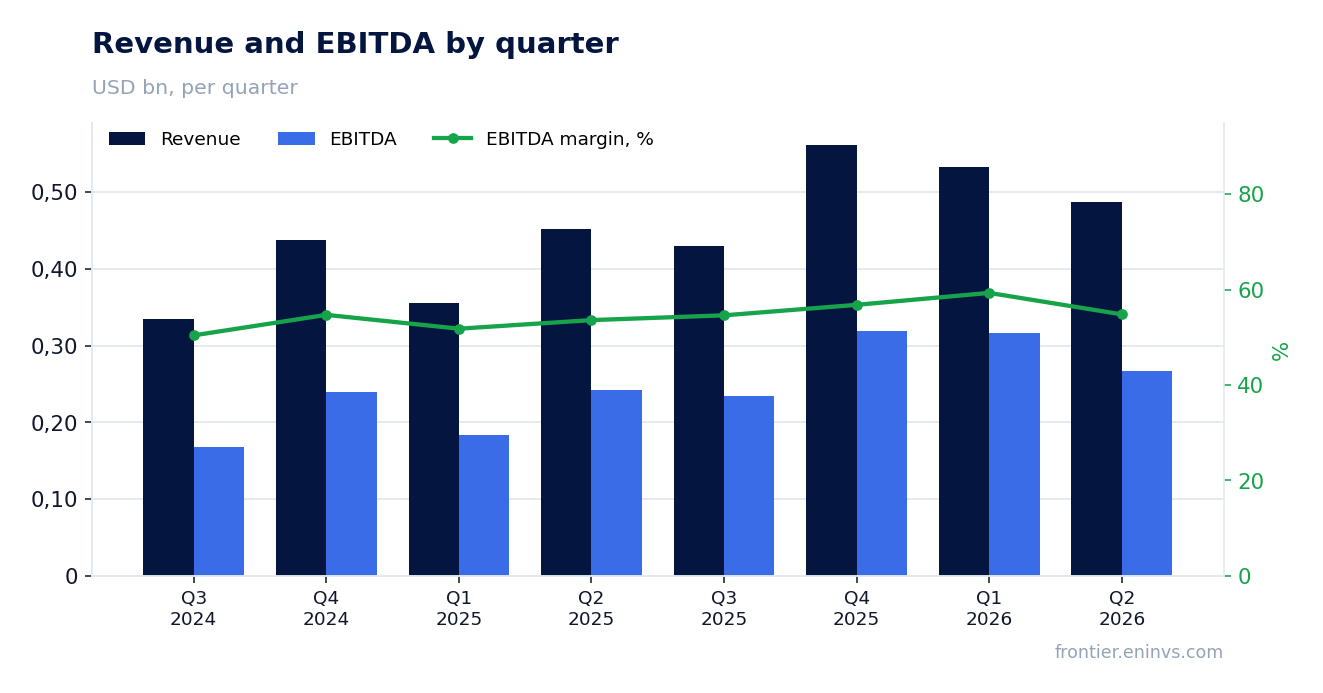
In the second quarter of 2026, Eldorado Gold's revenue reached USD 487.5 mn, up 7.9% year on year. This is a sharp deceleration from the first quarter, when growth was 50.0%. The main reason is the high base effect: in Q2 2025 revenue was already substantial at USD 451.7 mn, so the current increase looks modest.
Over the trailing twelve months, revenue amounted to USD 2,000.0 mn. The company continues to grow volumes, but the pace has slowed. If in Q1 2026 growth was 50.0%, in Q2 it was only 7.9%. This may indicate saturation or that gold prices have ceased to be the main driver.
Revenue dynamics matter for assessing the company's ability to generate cash flow. With growth of only 7.9% and simultaneously rising capital expenditure, free cash flow came under pressure.
EBITDA margin rose to 54.8% as operating costs took a smaller share of revenue
In Q2 2026, EBITDA reached USD 267.1 mn, up 10.2% year on year. The EBITDA margin rose to 54.8% from 53.6% a year earlier. This improvement occurred despite slowing revenue growth, indicating cost control.
Operating profit in Q2 2026 was USD 212.4 mn, up 20.8% from USD 175.9 mn in Q2 2025. Operating profit growing faster than revenue points to a reduction in relative operating expenses.
Margin growth is a positive signal, but it is partly explained by the cost structure. The company managed to contain costs, yet maintaining such a margin may prove difficult if revenue growth slows further.
Net profit rose 25.2%, but its quality is questionable given negative operating cash flow in Q4 2025
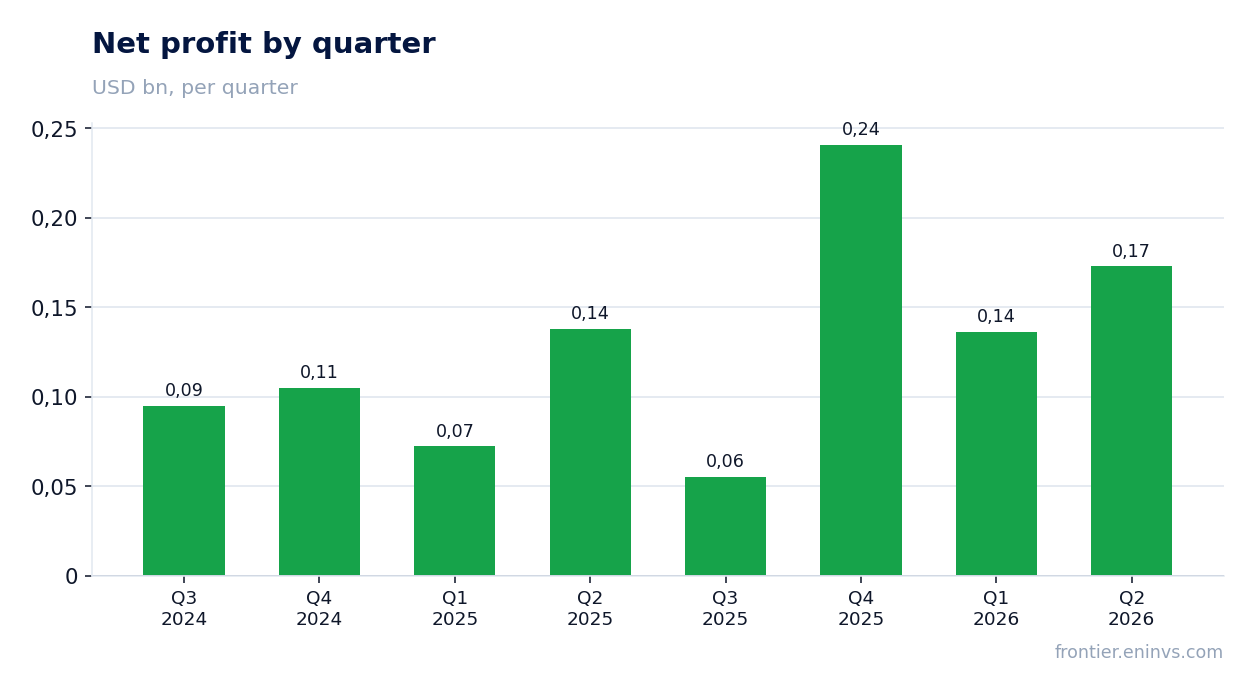
Net profit in Q2 2026 was USD 172.8 mn, up 25.2% year on year. The net margin rose to 35.5% from 30.6%. However, attention should be paid to the quality of this profit: in Q4 2025, operating cash flow was negative at minus USD 129.6 mn.
Over the trailing twelve months, net profit reached USD 605.4 mn, while operating cash flow was only USD 283.2 mn. Such a gap may indicate that part of the profit is not backed by real cash inflow. This could be due to changes in working capital or one-off factors.
Investors should monitor how operating cash flow recovers in the coming quarters. If the negative trend persists, it could limit the company's ability to fund capital expenditure and dividends.
Capital expenditure reached USD 469.6 mn, nearly three times operating cash flow
In Q2 2026, Eldorado Gold's capital expenditure amounted to USD 469.6 mn, significantly exceeding operating cash flow of USD 149.5 mn. This resulted in negative free cash flow. For comparison, a year earlier capex was USD 198.6 mn, more than doubling.
Such a high level of investment may be related to large projects. However, funding such costs requires either accumulated reserves or borrowed funds. Since operating cash flow does not cover capex, the company has to raise debt, which is already reflected in the balance sheet.
In the long term, these investments may pay off, but in the short term they put pressure on financial metrics. Investors need to understand when these projects will be completed and whether they will start generating returns.
Net debt jumped from USD 601.1 mn to USD 1,195.4 mn in the quarter, while net debt/EBITDA LTM stands at 0.4
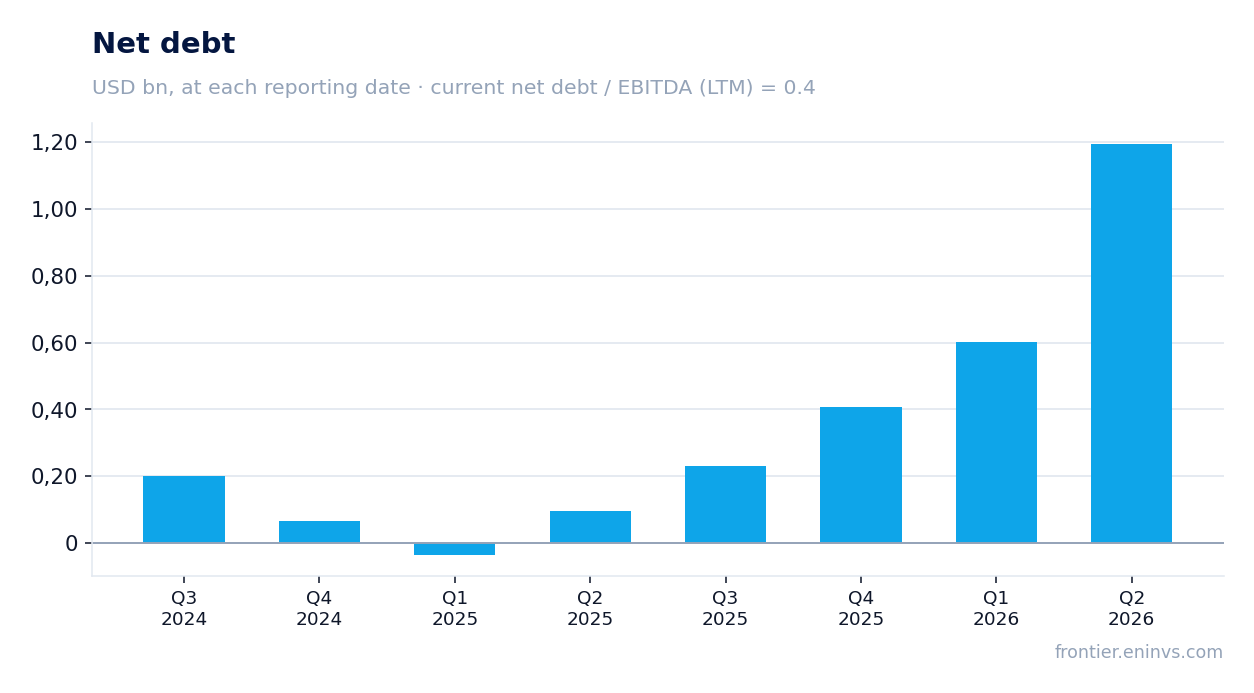
Eldorado Gold's net debt at the end of Q2 2026 was USD 1,195.4 mn, up from USD 601.1 mn at the end of Q1. An increase of more than USD 594 mn in three months is significant. This occurred against the backdrop of negative free cash flow and active financing of capital expenditure.
The net debt/EBITDA LTM ratio stands at 0.4. This is a moderate level that does not cause immediate concern. However, we do not have data on the previous value of this ratio, so we cannot judge its direction. Absolute debt has risen, but relative to EBITDA it remains low.
EBITDA over the trailing twelve months was USD 1,051.9 mn. At this level, debt of USD 1,195.4 mn looks manageable. Nevertheless, if capital expenditure remains high, debt may continue to grow, which would become a risk factor.
A dividend yield of 0.5% does not compensate for the risks of rising debt and negative free cash flow
Eldorado Gold's dividend yield over the trailing twelve months is 0.5%. This is a very low level that offers little appeal to income-oriented investors. For comparison, the key rate in Russia is significantly higher, although the company operates in the international market.
The company is not a dividend story in the classical sense. Payments are symbolic and are not the main way of returning capital to shareholders. At the same time, rising debt and negative free cash flow create risks for future payments.
If capital expenditure remains at current levels and operating cash flow does not recover, the company may be forced to cut or cancel dividends. This makes the dividend yield even less attractive.
EV/EBITDA of 9.1 is above its own three-year average of 6.2, leaving no room for upside
Eldorado Gold's current EV/EBITDA multiple is 9.1. This is above its own three-year average of 6.2. Thus, the stock trades at a premium to its historical valuation. This can only be justified if the company significantly improves its financial performance.
The P/E LTM is 15.1. This does not look extreme, but given slowing revenue growth and cash flow risks, such a valuation may be inflated. Market capitalisation is USD 9,157.3 mn.
According to the portal's model, which re-prices EBITDA at current commodity prices at the target EV/EBITDA, the stock's upside to fair value is minus 44%. This is our own calculation, and it points to a substantial downside risk.
Valuation on the latest reported figures
| Metric | Value |
|---|---|
| Market cap | 9.16 bn USD |
| P/E (LTM) | 15.1 |
| EV/EBITDA (LTM) | 9.1 |
| P/B | 2.14 |
| Net debt / EBITDA (LTM) | 0.40 |
| Operating cash flow (LTM) | 0.28 bn |
| ROE | 12.4% |
| Dividend yield (12m) | 0.5% |
| EV/EBITDA, 3-year average | 6.2 |
Bottom line
Eldorado Gold delivered 25.2% profit growth and an improved EBITDA margin of 54.8%, which is a strong point of the report. However, this growth was achieved against a sharp slowdown in revenue to 7.9% and record capital expenditure of USD 469.6 mn, which led to negative free cash flow. Net debt nearly doubled in the quarter to USD 1,195.4 mn, although the net debt/EBITDA LTM ratio remains moderate at 0.4. The valuation looks stretched: EV/EBITDA of 9.1 versus its own three-year average of 6.2, and the portal model implies 44% downside. The question for a holder now is whether the large investments can start generating returns before the debt burden becomes onerous.
Open the company's financial profile EGO →
See also: market overview · valuation map · stock screeners