VAALCO Energy: Q2 profit was almost entirely assembled by a hedge reversal, not by production
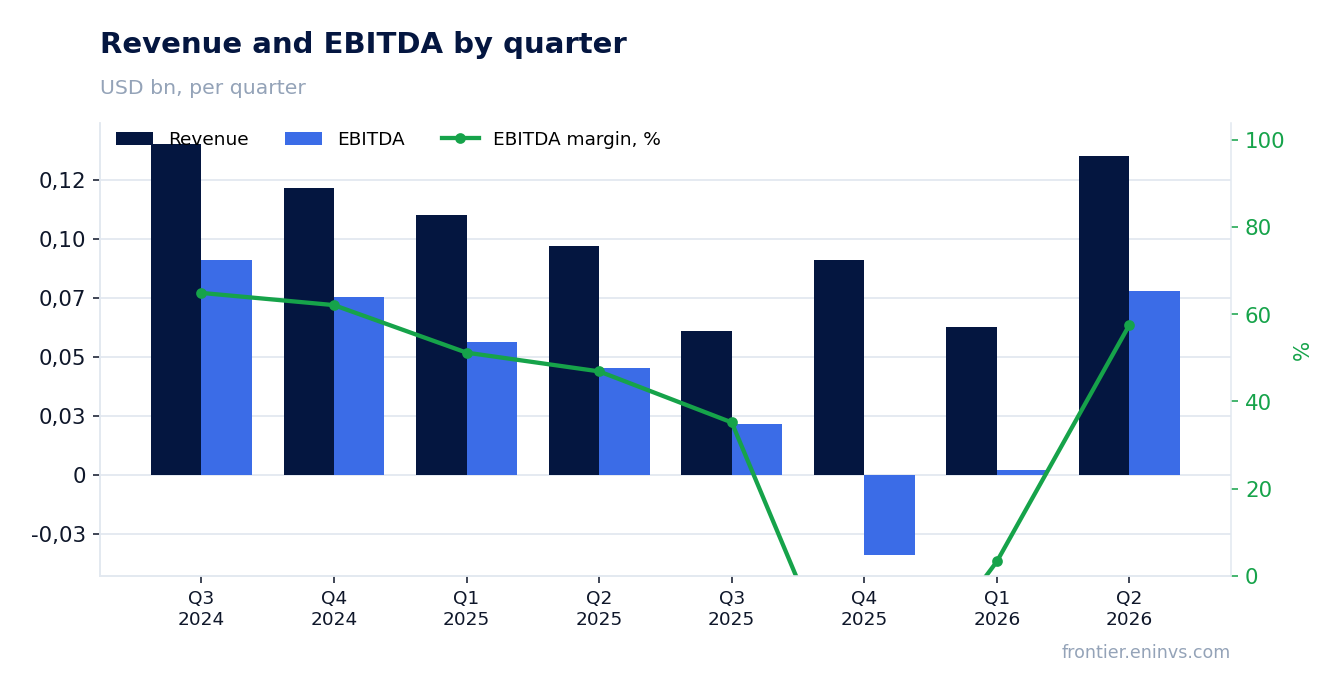
On 6 August VAALCO Energy released its second-quarter 2026 results. Revenue rose 39.5% year on year to $135.2 million, EBITDA by 71.4% to $77.9 million, net profit fivefold to $42.4 million, and the EBITDA margin reached 57.6% from 46.9%. But $18.7 million of the profit came from a non-operating derivative gain rather than from selling oil, and at $5.15 a share the stock trades at 12.96 EV/EBITDA against its own three-year average of 1.64 – on that valuation the share looks rather unattractive despite a strong quarter.
Key takeaways
— Revenue rose 39.5% year on year, but sales in barrels fell 8% – price did the work
— The EBITDA margin rose to 57.6% on price, not on cost savings
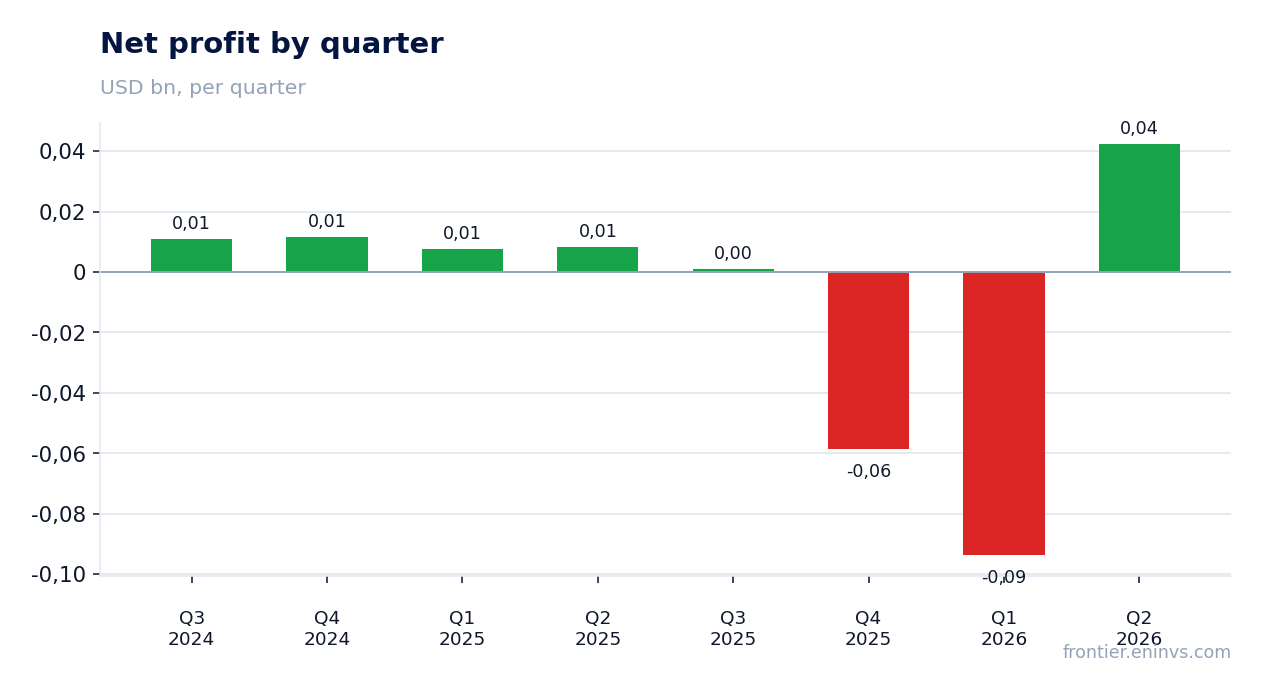
— Of the $42.4 million profit, $18.7 million came from a non-operating hedge gain
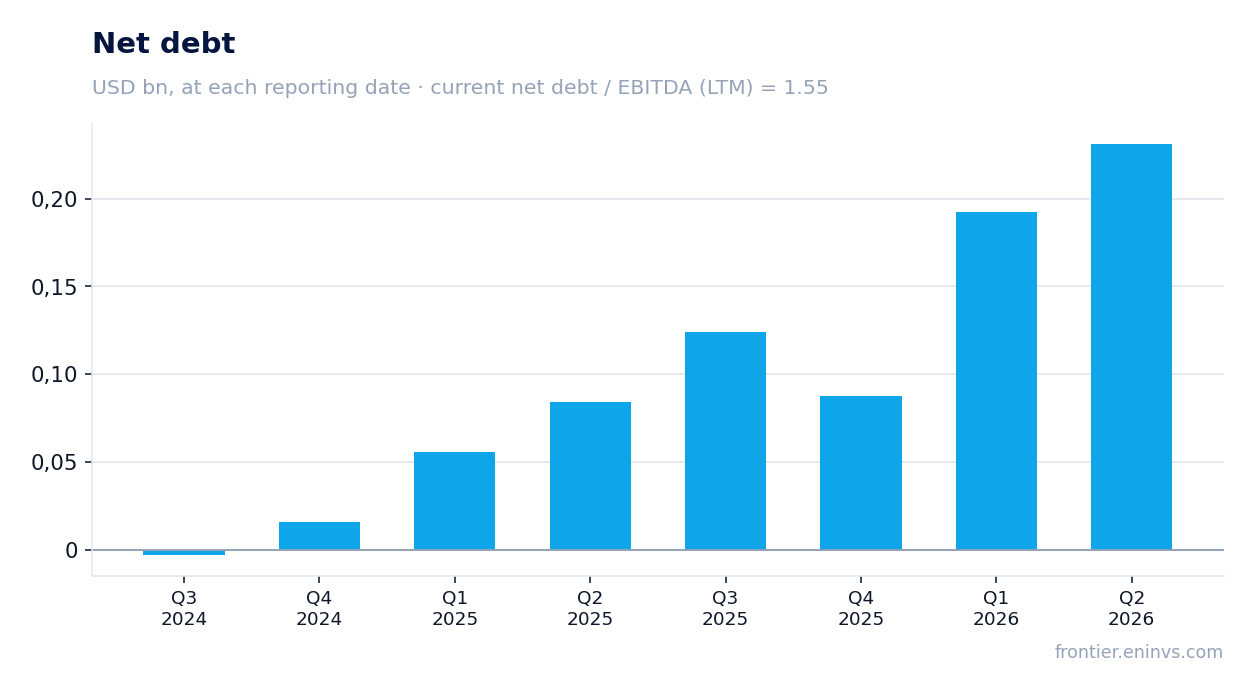
— Debt rose to $231.4 million, and net debt to LTM EBITDA stands at 1.55
— First-half capex reached $181.6 million with negative free cash flow
— The $0.0625 quarterly dividend yields 4.08%, but coverage is weakening
— The multiple is 12.96 EV/EBITDA against its own three-year average of 1.64
Attractiveness
Key figures, USD bn
| Metric | Q2 2025 | Q2 2026 | Change |
|---|---|---|---|
| Revenue | 0.10 | 0.14 | +39.5% |
| EBITDA | 0.05 | 0.08 | +71.4% |
| Operating profit | 0.02 | 0.04 | +153.7% |
| Net profit | 0.01 | 0.04 | +406.5% |
| Operating cash flow | 0.02 | 0.07 | +301.8% |
| Capex | 0.10 | 0.00 | -100.0% |
| EBITDA margin | 46.9% | 57.6% | +10.7 pp |
| Net margin | 8.6% | 31.4% | +22.8 pp |
Revenue rose 39.5% year on year, but sales in barrels fell 8% – price did the work
In the second quarter of 2026 revenue was $135.2 million against $96.9 million a year earlier – growth of 39.5%. However, sales in barrels of oil equivalent fell 8% to 1,621 thousand barrels because of the February sale of Canadian assets. Price delivered the entire revenue increase: the average realised price rose 47% to $80.77 per barrel.
Compared with the first quarter of 2026 revenue rose 116%, from $62.6 million to $135.2 million. That jump reflects two liftings in Gabon and higher sales in Egypt, whereas the first quarter had only one lifting. Sales in barrels rose 48% quarter on quarter to 1,621 thousand barrels.
Geographically, Gabon contributed $91.8 million of net revenue and Egypt $43.4 million. Canada dropped out after the asset sale, and Côte d’Ivoire has not yet contributed sales, although production there restarted in June. Gabon’s revenue growth versus the first quarter was nearly fourfold, explained by the lifting schedule rather than by production growth.
Total production rose 10% quarter on quarter to 21,796 barrels per day, but was almost flat year on year – 21,796 against 21,654. Operational growth has not yet become the revenue driver: price and the lifting schedule determine it.
The EBITDA margin rose to 57.6% on price, not on cost savings
The EBITDA margin in the second quarter of 2026 was 57.6% against 46.9% a year earlier. Price explains almost all of the margin gain: the average realised price rose 47% to $80.77 per barrel, while unit production costs increased 23% to $28.06 per barrel.
Production expense rose 13% year on year to $45.5 million and 61% quarter on quarter. The sequential increase reflects higher sales and a change in the valuation of oil inventory in Côte d’Ivoire. Unit costs per barrel rose both year on year and quarter on quarter.
General and administrative expense excluding stock-based compensation rose 35% year on year to $9.6 million on non-recurring legal and professional fees. Depletion expense rose 21% to $34.3 million, or $21.14 per barrel against $16.02 a year earlier. The margin did not improve because the company became more efficient, but because price grew faster than costs.
Of the $42.4 million profit, $18.7 million came from a non-operating hedge gain
Net profit in the second quarter of 2026 was $42.4 million, or $0.39 per diluted share, against $8.4 million a year earlier. But $18.7 million of that is net income from derivative instruments, including an unrealised gain of $43.7 million from fair-value changes and a realised loss of $25.0 million on matured contracts.
Without that non-operating gain, pre-tax profit would have been about $40.5 million rather than $59.2 million. Almost a third of pre-tax profit is a paper gain from hedge revaluation, not cash from selling oil. The realised part of the hedges, by contrast, subtracted $25.0 million.
Operating profit was $43.6 million against $17.2 million a year earlier. The gap between operating and net profit is explained by non-operating items: $2.75 million of interest expense and $0.3 million of other expense. Tax expense was $16.8 million, including a one-off $1.0 million oil-price adjustment in Gabon.
The net margin rose to 31.4% from 8.6% a year earlier, but that gain rests on a non-operating item that can reverse in any quarter if the oil price curve moves.
Debt rose to $231.4 million, and net debt to LTM EBITDA stands at 1.55
Net debt at the end of the second quarter of 2026 was $231.4 million against $87.4 million at the end of 2025. Long-term borrowings rose to $177.0 million from $60.0 million. The company drew $117.0 million under its credit facility in the first half to fund its investment programme.
The ratio of net debt to LTM EBITDA is 1.55. That is a moderate level, but it is calculated on LTM EBITDA of $56.3 million, which includes weak third and fourth quarters of 2025 and a loss-making first quarter of 2026. If EBITDA returns to the second-quarter level the ratio would be lower, but for now it reflects the current base.
Operating cash flow in the first half of 2026 was $34.5 million, while capital expenditure was $181.6 million. The gap was funded by the $25.5 million Canadian asset sale and by borrowings. Free cash flow for the half was negative.
Liquidity under the credit facility at quarter-end was about $123.0 million. The facility has a commitment reduction schedule: $15.8 million in March 2027 and $35.5 million every six months starting September 2027. That creates pressure on cash flow in the coming years.
First-half capex reached $181.6 million with negative free cash flow
Capital expenditure in the first half of 2026 was $181.6 million on a cash basis, of which $103.6 million was in the second quarter. That is below the quarterly guidance range of $110–130 million, but still well above operating cash flow of $34.5 million for the half.
The main areas were the Phase Three drilling programme in Gabon, the Egyptian drilling programme and the FPSO refurbishment in Côte d’Ivoire. The company affirmed its full-year capital budget of $290–360 million without increasing it, despite additional drilling in Egypt.
Negative free cash flow means dividends and investment are funded by debt and asset sales. The Canadian asset sale brought in $25.5 million, but that is a one-off. If capital expenditure stays at the current level the company will have to either increase debt or cut the programme.
In the third quarter of 2026 the company expects capital expenditure of $75–115 million. That is below the second quarter, but still above quarterly operating cash flow if it remains at the second-quarter level.
The $0.0625 quarterly dividend yields 4.08%, but coverage is weakening
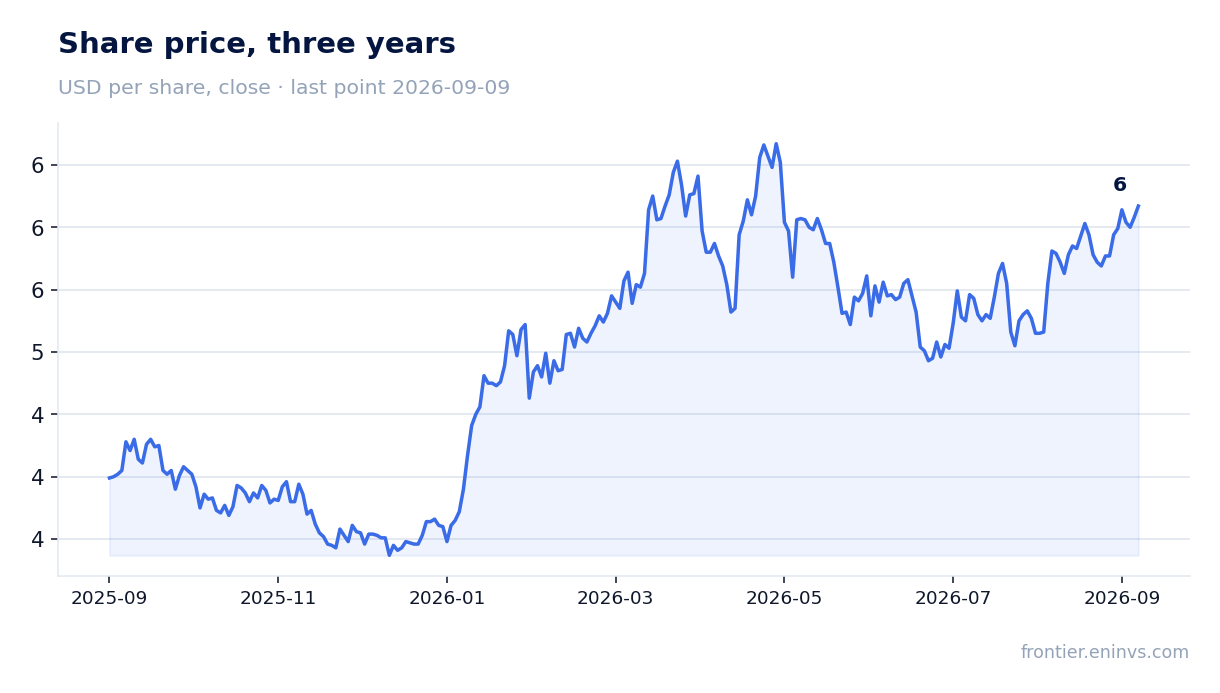
VAALCO paid a quarterly dividend of $0.0625 per share for the second quarter of 2026 on 26 June. The next dividend of the same size – $0.0625 – is declared for payment on 22 September 2026, giving $0.25 annualised. At $5.15 a share the dividend yield is 4.08%.
Our estimate: if the current payout is maintained, the annual dividend will remain $0.25 per share. However, coverage is deteriorating: in the first half of 2026 the company posted a net loss of $51.3 million, while operating cash flow was $34.5 million against capital expenditure of $181.6 million. Dividends are being paid from borrowings and asset-sale proceeds.
The 4.08% yield is comparable to the key rate but offers no risk premium. If the oil price falls or capital expenditure stays high, the company may revise the payout. The board has reserved the right to change the dividend level without prior notice.
The dividend is an important part of the investment case, but its sustainability depends on a recovery in free cash flow. For now the company is paying out more than it earns.
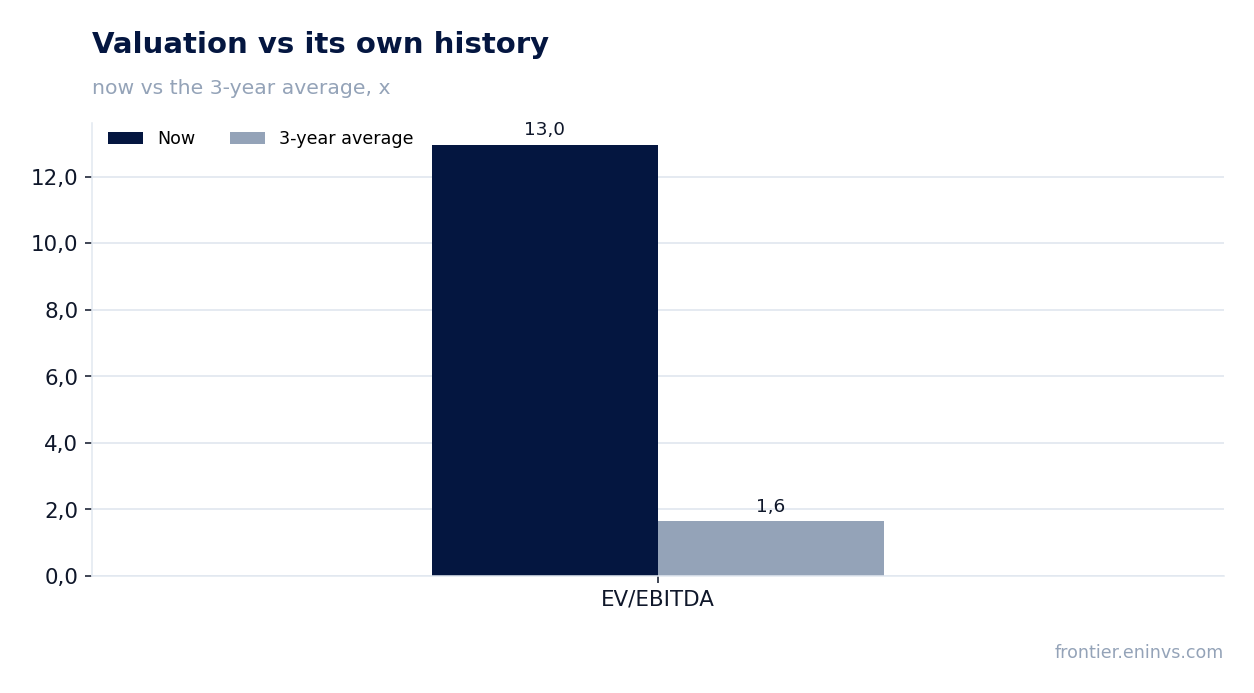
The multiple is 12.96 EV/EBITDA against its own three-year average of 1.64
With a market capitalisation of $642.0 million and net debt of $231.4 million, enterprise value is about $873.4 million. The EV/LTM EBITDA multiple is 12.96. The company’s own three-year average for this multiple is 1.64. The stock trades eight times above its historical norm.
The gap is explained by LTM EBITDA of $56.3 million including weak quarters: in the fourth quarter of 2025 EBITDA was negative, and in the first quarter of 2026 it was almost zero. If EBITDA returns to the second-quarter 2026 level of $77.9 million, annual EBITDA could be about $200 million and the multiple would fall to about 4.4. But that requires a sustained recovery in production and prices.
Return on equity over the last 12 months is 46.8%, which is high, but it rests on second-quarter profit that includes a non-operating gain. Without it ROE would be lower.
The comparison with its own history shows the market is already pricing in a significant recovery. To justify the current valuation the company needs not just to repeat the second quarter but to sustain that level for a year.
Valuation on the latest reported figures
| Metric | Value |
|---|---|
| Market cap | 0.64 bn USD |
| EV/EBITDA (LTM) | 13.0 |
| P/B | 1.45 |
| Net debt / EBITDA (LTM) | 1.55 |
| Operating cash flow (LTM) | 0.21 bn |
| ROE | 46.8% |
| Dividend yield (12m) | 4.1% |
| EV/EBITDA, 3-year average | 1.6 |
Bottom line
The second quarter of 2026 was genuinely strong: revenue rose 39.5%, EBITDA 71.4%, and the margin reached 57.6%. But almost a third of pre-tax profit is a non-operating hedge gain, not cash from selling oil. Debt rose to $231.4 million, free cash flow is negative, and dividends are funded by borrowings. At 12.96 EV/EBITDA against its own three-year average of 1.64, the market is already pricing in a sustained recovery that has not yet been confirmed. The question for a holder now is not whether the quarter was good, but whether the company can sustain that level without one-off items.
Open the company's financial profile EGY →
See also: market overview · valuation map · stock screeners