Epsilon Energy: Q2 2026 profit nearly quintupled, but half of it is eaten by the gap between paper and cash returns

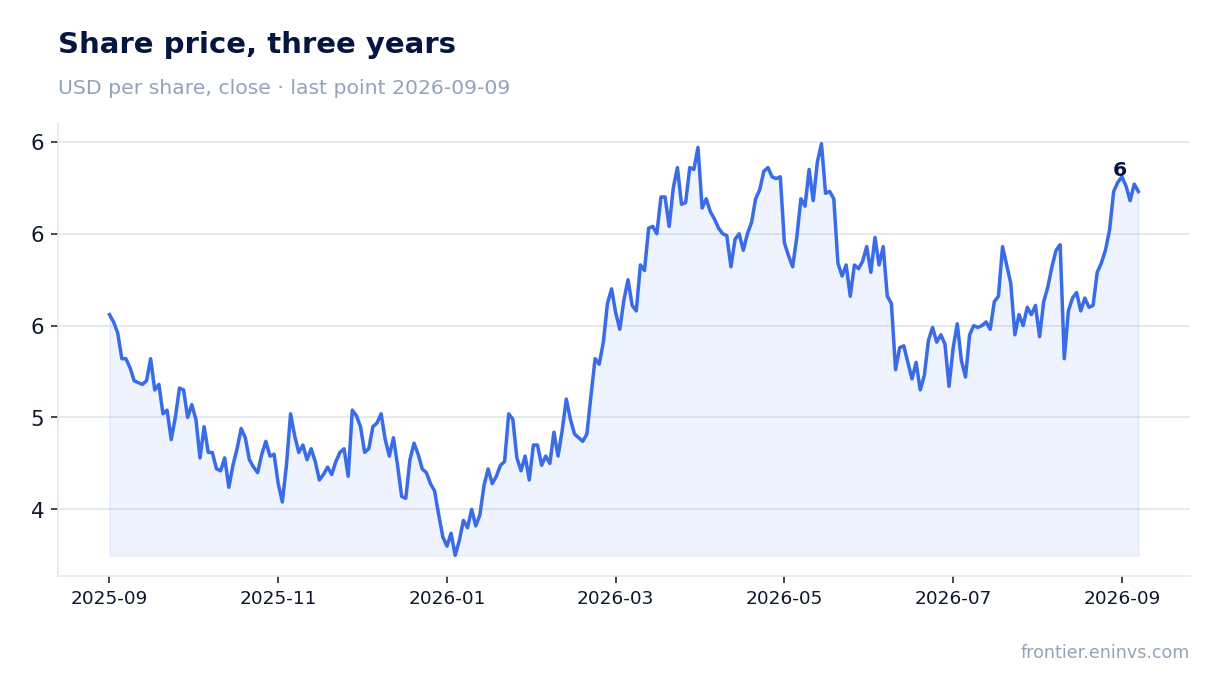
Epsilon Energy released its Q2 2026 results in 2026. Revenue rose 57.1% year on year to $18.3m, EBITDA jumped 177.5% to $11.2m, and net profit surged 359.8% to $7.1m. The EBITDA margin climbed to 61.2% from 34.7% a year earlier, while the net margin reached 39.1% versus 13.3%. Yet over the trailing twelve months free cash flow remains under pressure: operating cash flow was $20.6m, while capital expenditure in Q4 2025 reached $1.8m. The shares look neutral: strong reported profit and low leverage are offset by a negative signal from our model, which values fair value 21% below the market.
Key takeaways
— Q2 2026 revenue rose 57.1% year on year to $18.3m, but this is a slowdown from 58.4% in Q1
— Q2 2026 EBITDA jumped 177.5% to $11.2m, with the margin reaching 61.2% versus 34.7% a year earlier
— Q2 2026 net profit surged 359.8% to $7.1m, but the gap with cash flow remains significant
— Operating cash flow over the trailing twelve months was $20.6m, while capital expenditure in Q4 2025 was $1.8m
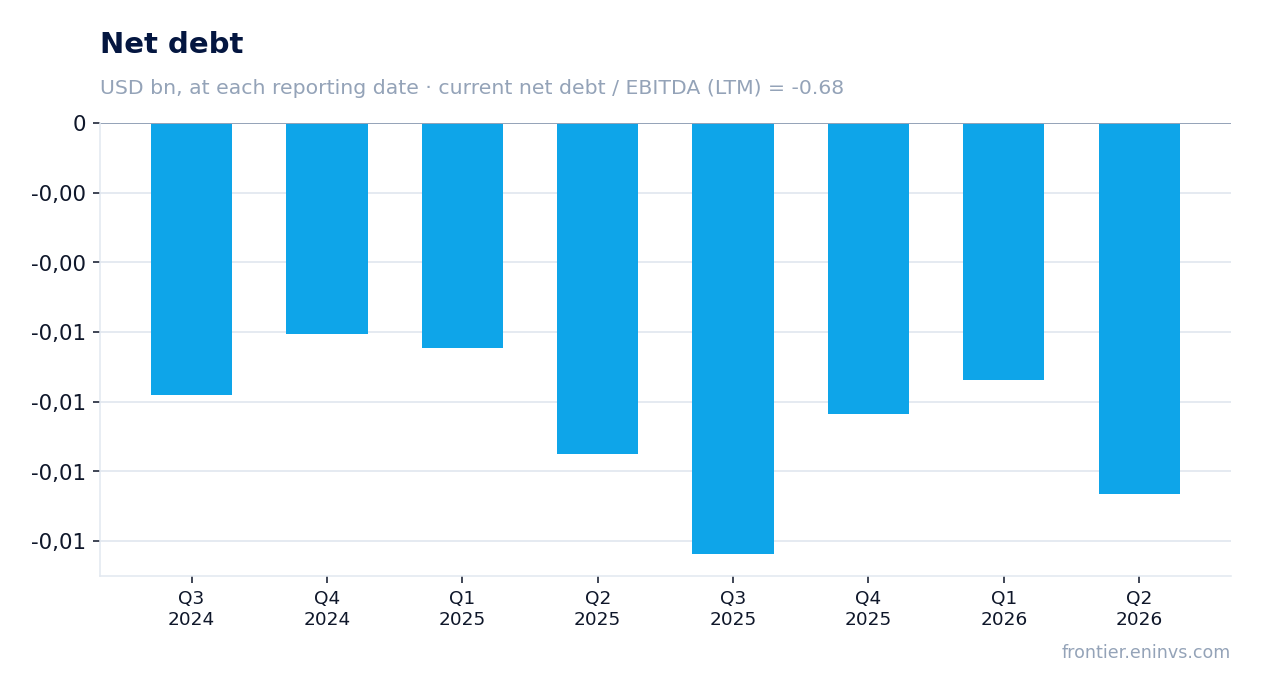
— Net debt is negative at -$8.3m, and the net debt/EBITDA LTM ratio is -0.68, indicating no debt burden
— Trailing 12-month dividend yield is 4.04%, below the key rate, but the payout may be unstable due to profit volatility
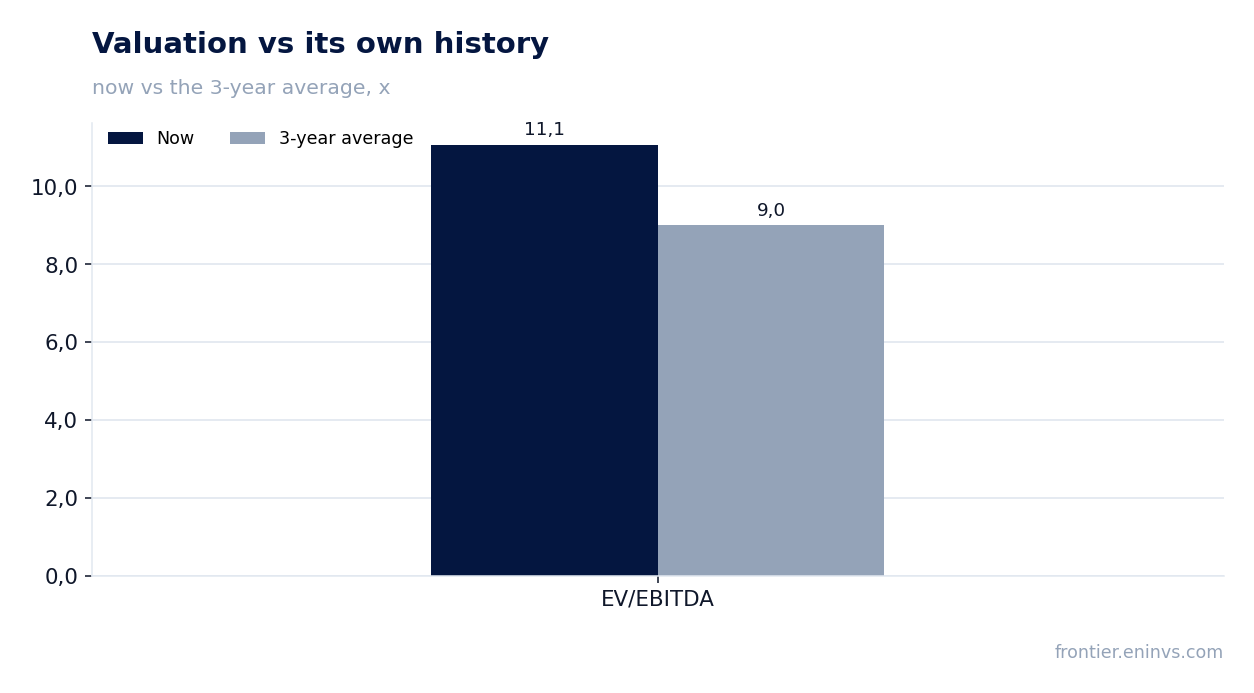
— EV/EBITDA LTM of 11.1x is above the three-year average of 9.0x, and the portal model implies 21% downside
Attractiveness
Key figures, USD bn
| Metric | Q2 2025 | Q2 2026 | Change |
|---|---|---|---|
| Revenue | 0.01 | 0.02 | +57.1% |
| EBITDA | 0.00 | 0.01 | +177.5% |
| Operating profit | 0.00 | 0.01 | +913.5% |
| Net profit | 0.00 | 0.01 | +359.8% |
| Operating cash flow | 0.01 | 0.01 | +47.3% |
| Capex | 0.00 | — | — |
| EBITDA margin | 34.7% | 61.2% | +26.5 pp |
| Net margin | 13.3% | 39.1% | +25.8 pp |
Q2 2026 revenue rose 57.1% year on year to $18.3m, but this is a slowdown from 58.4% in Q1
Epsilon Energy's Q2 2026 revenue came in at $18.3m, up 57.1% from the same period last year. This extends a strong run: growth was 58.4% in Q1 and 65.7% in Q4 2025. However, sequentially revenue declined from $25.6m in Q1 2026, reflecting volatility in hydrocarbon prices and production volumes.
The year-on-year increase was driven mainly by improved oil and gas prices and higher production. The company does not provide a detailed segment breakdown in the facts, but the overall trend suggests operating metrics are recovering after a weak Q4 2025, when revenue fell to $14.8m.
Over the trailing twelve months, revenue totalled $67.7m. This matches the sum of the last four quarters (18.3 + 25.6 + 14.8 + 9.0 = 67.7), confirming that the company is gradually ramping up but has not yet returned to levels seen before the sharp drop at the end of 2025.
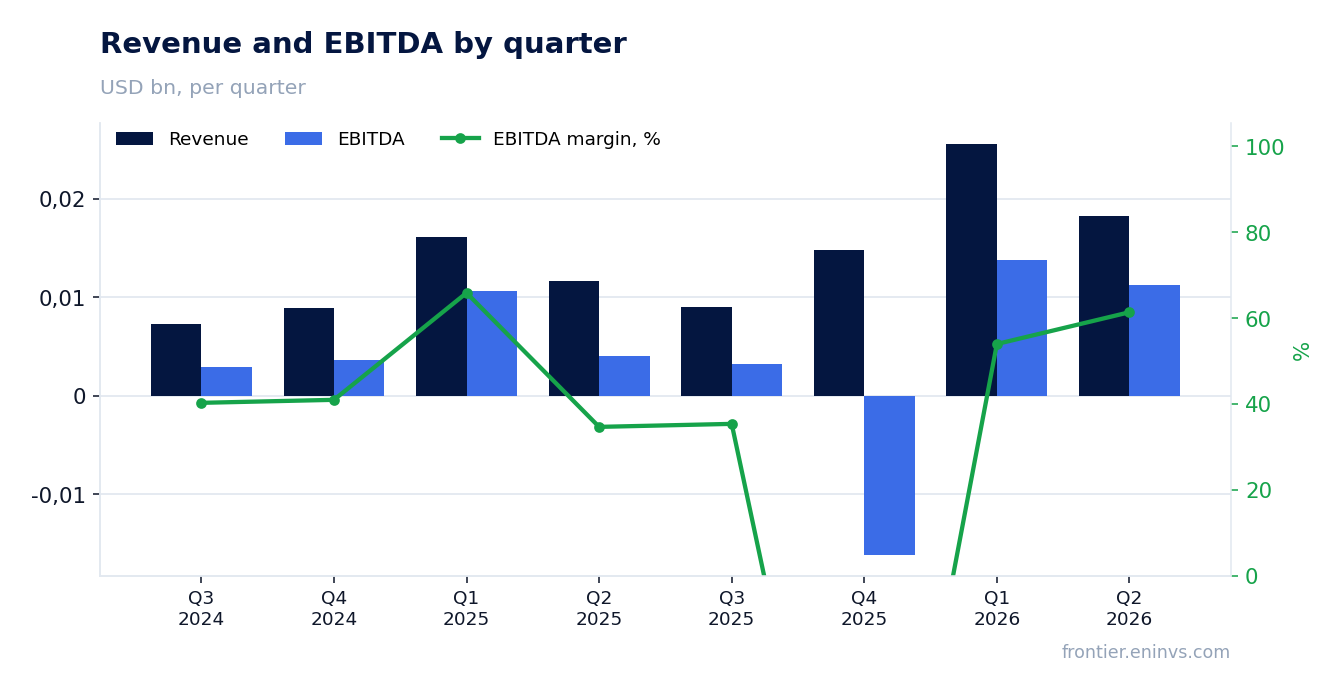
Q2 2026 EBITDA jumped 177.5% to $11.2m, with the margin reaching 61.2% versus 34.7% a year earlier
Q2 2026 EBITDA reached $11.2m, up 177.5% year on year. With revenue growing 57.1%, this implies a sharp margin expansion: the EBITDA margin rose to 61.2% from 34.7% in Q2 2025.
The margin surge reflects operating leverage: costs grew slower than revenue. In Q1 2026, EBITDA was already high at $13.8m on revenue of $25.6m, a 53.9% margin. In Q2, the margin expanded further despite lower revenue, which may point to reduced unit costs or one-off factors.
Operating profit in Q2 2026 was $8.4m versus $0.8m a year earlier. This confirms that the margin improvement occurred at the operating level, not from non-operating items. However, it is worth noting that in Q4 2025 EBITDA was negative at -$16.2m, highlighting the volatility of financial results.
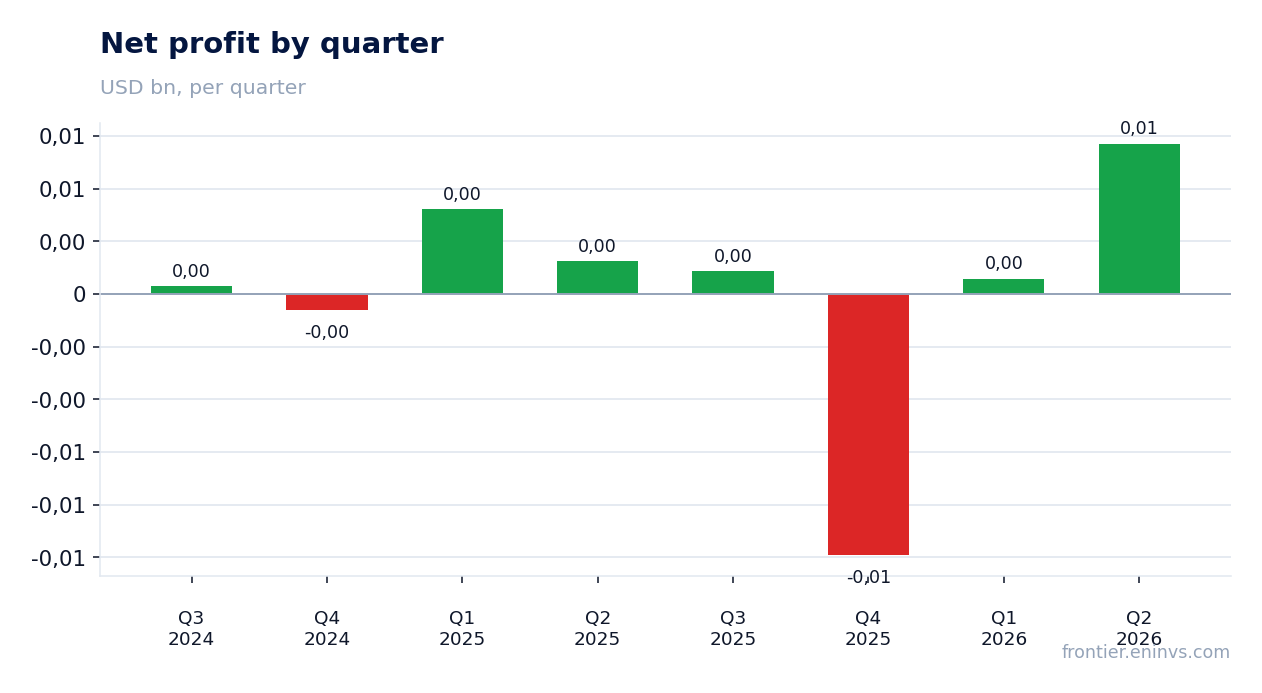
Q2 2026 net profit surged 359.8% to $7.1m, but the gap with cash flow remains significant
Q2 2026 net profit was $7.1m, up 359.8% year on year. The net margin reached 39.1% versus 13.3% in Q2 2025. This profit growth significantly outpaces the EBITDA increase, which may be due to changes in non-operating income or expenses, including taxes and interest.
However, operating cash flow in Q2 2026 was $12.3m, lower than net profit. This means part of the profit is not converting into cash, possibly due to higher receivables or other working capital items. Over the trailing twelve months, operating cash flow was $20.6m, well below the sum of net profit for the same period.
The gap between paper and cash returns is a key risk for investors. If profit is growing through non-cash items, the sustainability of dividends and the ability to fund capital expenditure are called into question. In Q4 2025, the company already faced negative operating cash flow of -$0.3m, which led to a loss.
Operating cash flow over the trailing twelve months was $20.6m, while capital expenditure in Q4 2025 was $1.8m
Operating cash flow over the trailing twelve months was $20.6m. This is below net profit for the same period, indicating a gap between accounting and cash returns. In Q2 2026, operating cash flow was $12.3m, up from $10.1m in Q1 but still below net profit.
Capital expenditure in Q4 2025 was $1.8m, the highest quarterly level in two years. In other quarters, capex was minimal: for example, $0.05m in Q1 2026 and $0.12m in Q2 2025. Such low investment may indicate that the company is not expanding its production base but maintaining current operations.
Free cash flow therefore remains under pressure: with operating cash flow of $20.6m over 12 months and capex of about $2m, free cash flow is roughly $18.6m. This is sufficient to cover dividends, provided that profit is not eroded by working capital growth.
Net debt is negative at -$8.3m, and the net debt/EBITDA LTM ratio is -0.68, indicating no debt burden
Epsilon Energy's net debt at the latest reporting date was negative $8.3m, meaning cash exceeds debt. The net debt/EBITDA ratio over the trailing twelve months is -0.68. This level indicates no debt burden and a significant liquidity cushion.
Compared with the previous reporting date, net debt changed little: it was -$7.4m in Q1 2026 and -$9.5m in Q2 2025. Fluctuations within $2m do not change the picture: the company remains financially sound and does not rely on borrowed funds.
Low leverage is a key advantage amid volatile hydrocarbon prices. It allows the company to maintain dividend payments even during revenue declines, as seen in Q4 2025 when EBITDA was negative but net debt remained negative.
Trailing 12-month dividend yield is 4.04%, below the key rate, but the payout may be unstable due to profit volatility
Epsilon Energy's trailing 12-month dividend yield was 4.04%. This is below the current key rate, making the shares less attractive for income-oriented investors. However, the company is not a classic dividend story: its payouts depend on profit, which fluctuates significantly from quarter to quarter.
In Q4 2025, the company reported a net loss of $12.4m, which could have negatively affected the dividend base. Nevertheless, over the trailing twelve months profit remains positive, and operating cash flow of $20.6m covers potential payments. Our estimate for the current year's dividend assumes a conservative payout, but the exact amount will depend on second-half profit.
The main risk to the dividend is a further divergence between net profit and cash flow. If operating cash flow continues to lag profit, the company may cut payments or use accumulated cash. At the same time, negative net debt provides a cushion: even if profit declines, the company can maintain the dividend at the current level for some time.
EV/EBITDA LTM of 11.1x is above the three-year average of 9.0x, and the portal model implies 21% downside
Epsilon Energy currently trades at an EV/EBITDA LTM of 11.1x. This is above the three-year average of 9.0x. Thus, the shares are trading at a premium to their own history, which can only be justified by sustained growth in profit and cash flow.
Our model, based on current commodity prices and a target EV/EBITDA multiple, values the shares at 21% below the current market price. This is not a consensus forecast but the portal's own calculation. It suggests that the market may be pricing in a more favourable scenario than current hydrocarbon prices imply.
The company's market capitalisation is $143.4m, with EV/EBITDA LTM at 11.1. At the same time, ROE reaches 22.5%, indicating high capital efficiency. However, the combination of a premium valuation and volatile profit creates a risk of correction if next quarter's results fall short of expectations.
Valuation on the latest reported figures
| Metric | Value |
|---|---|
| Market cap | 0.14 bn USD |
| EV/EBITDA (LTM) | 11.1 |
| P/B | 1.15 |
| Net debt / EBITDA (LTM) | -0.68 |
| Operating cash flow (LTM) | 0.02 bn |
| ROE | 22.5% |
| Dividend yield (12m) | 4.0% |
| EV/EBITDA, 3-year average | 9.0 |
Bottom line
Epsilon Energy delivered a strong Q2 2026 report: revenue rose 57.1%, EBITDA jumped 177.5%, and net profit surged 359.8%. The EBITDA margin reached 61.2%, and net debt remains negative. However, a significant portion of profit is not converting into cash flow, and the EV/EBITDA multiple of 11.1x exceeds the three-year average. Our model implies 21% downside. Overall, the shares look neutral: strong operating results and low leverage are offset by a premium valuation and dividend risks.
Open the company's financial profile EPSN →
See also: market overview · valuation map · stock screeners