Energy Transfer LP: record volumes and revenue +78% — but all profit growth is eaten by rising costs
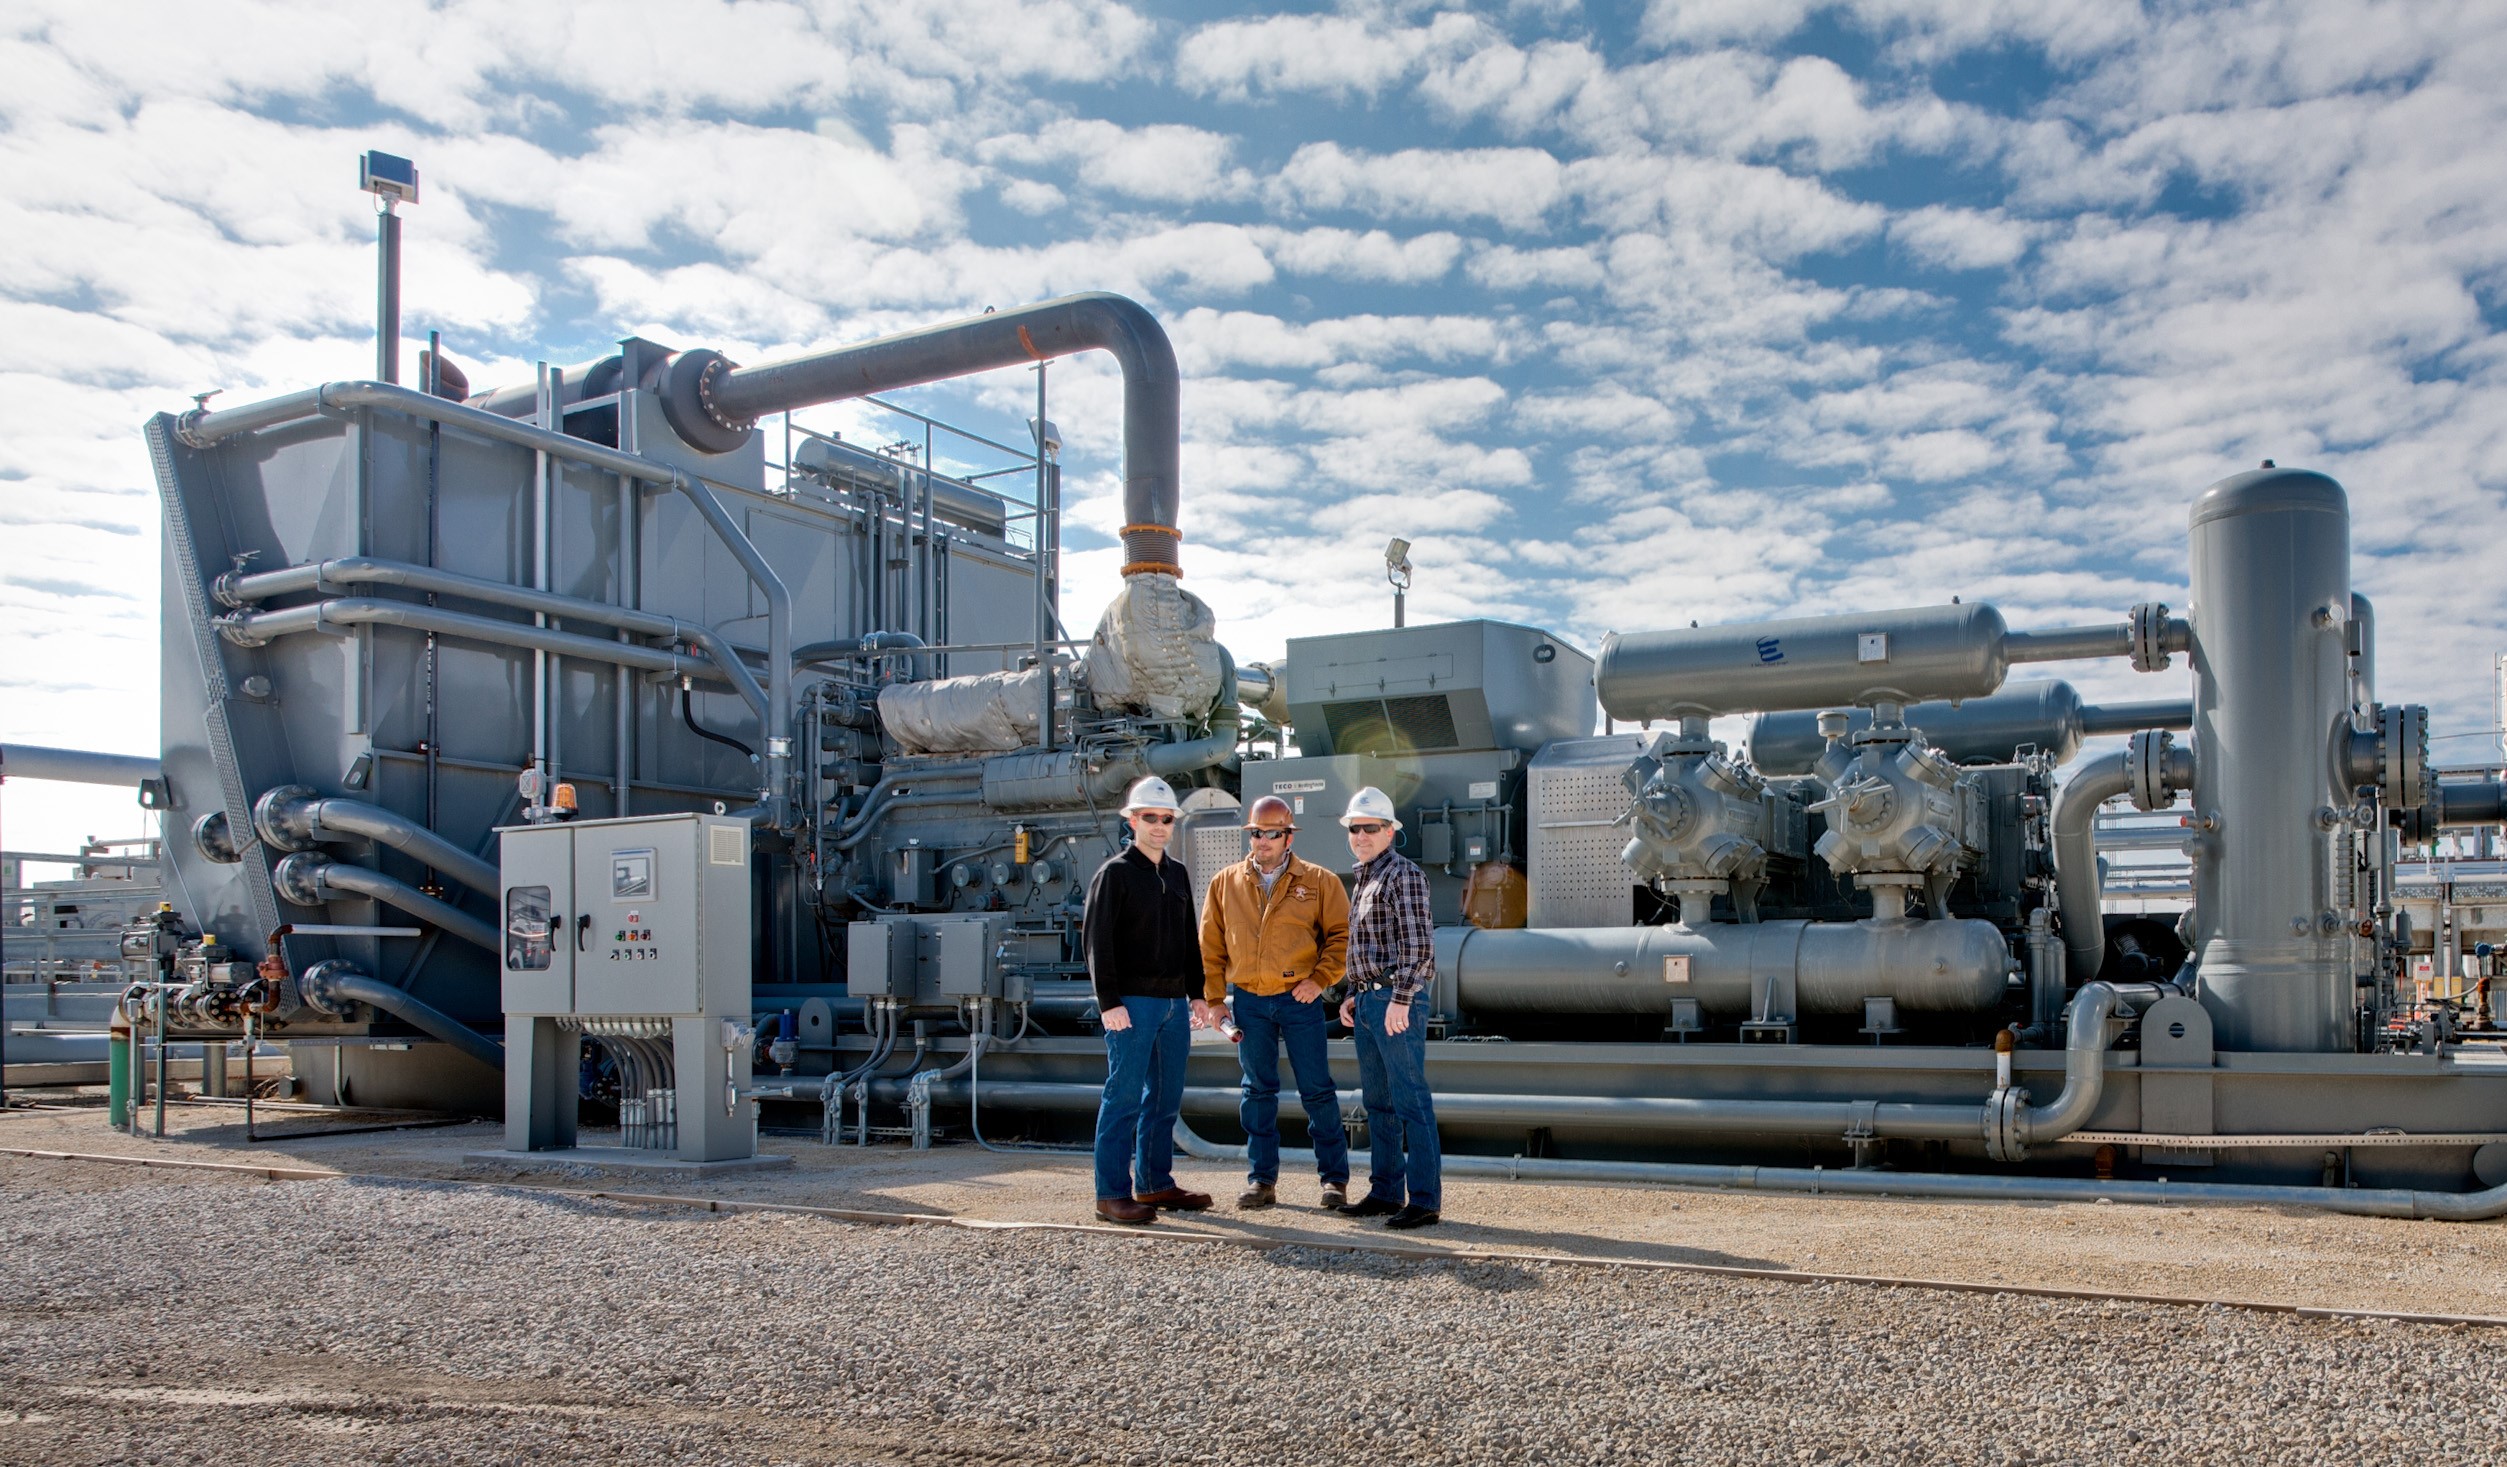
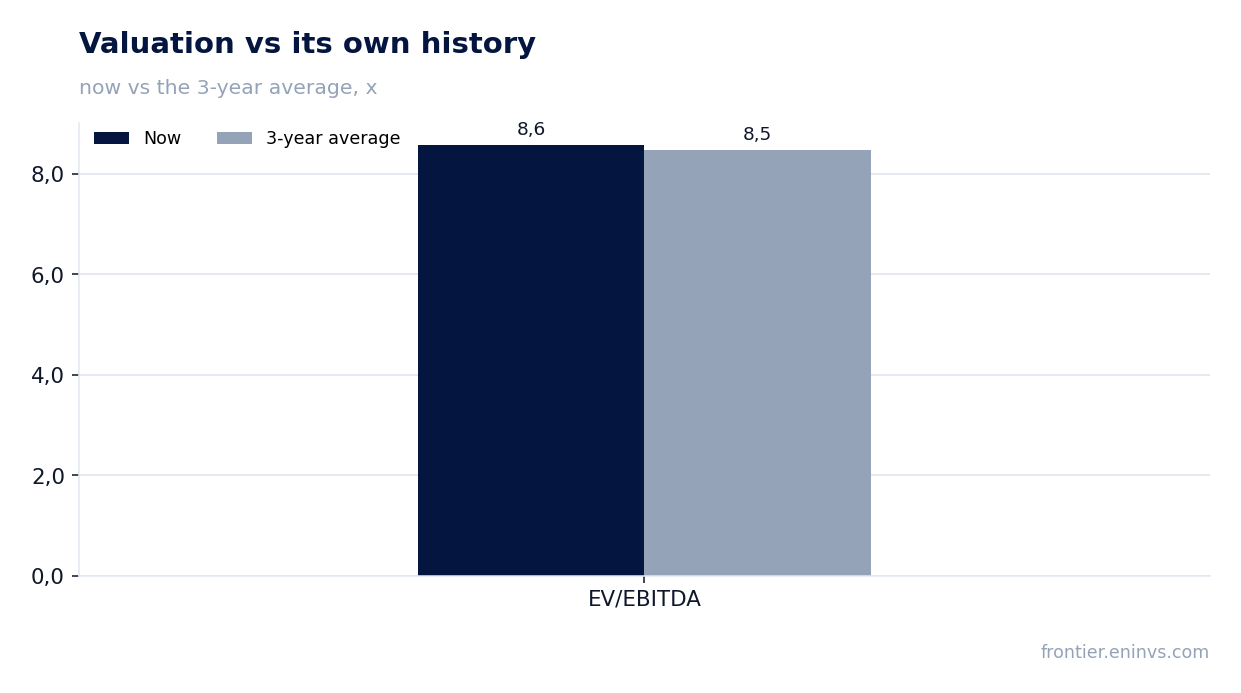
4 августа 2026 года Energy Transfer LP раскрыла результаты за второй квартал 2026 года. Выручка выросла на 78,4% год к году до 34 334 млн долл., скорректированная EBITDA — на 37,2% до 5 066 млн долл., чистая прибыль — на 79,5% до 2 088 млн долл. Акции выглядят привлекательно: при мультипликаторе EV/EBITDA 8,58 против среднего за три года 8,47 и дивидендной доходности 6,2% портал оценивает потенциал роста в +90%.
Key takeaways
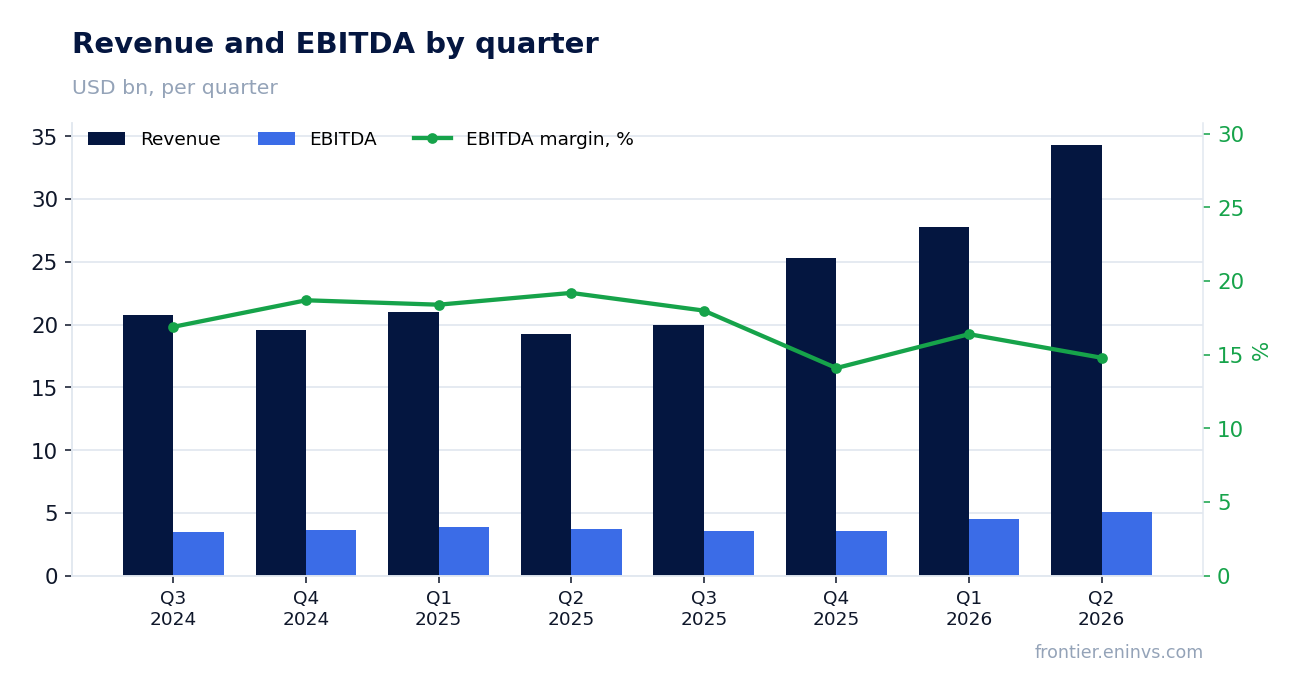
— Revenue +78% — record NGL, oil and gas volumes, but EBITDA margin fell from 19.2% to 14.8%
— EBITDA growth of 37% driven by all segments, especially Sunoco and NGL exports
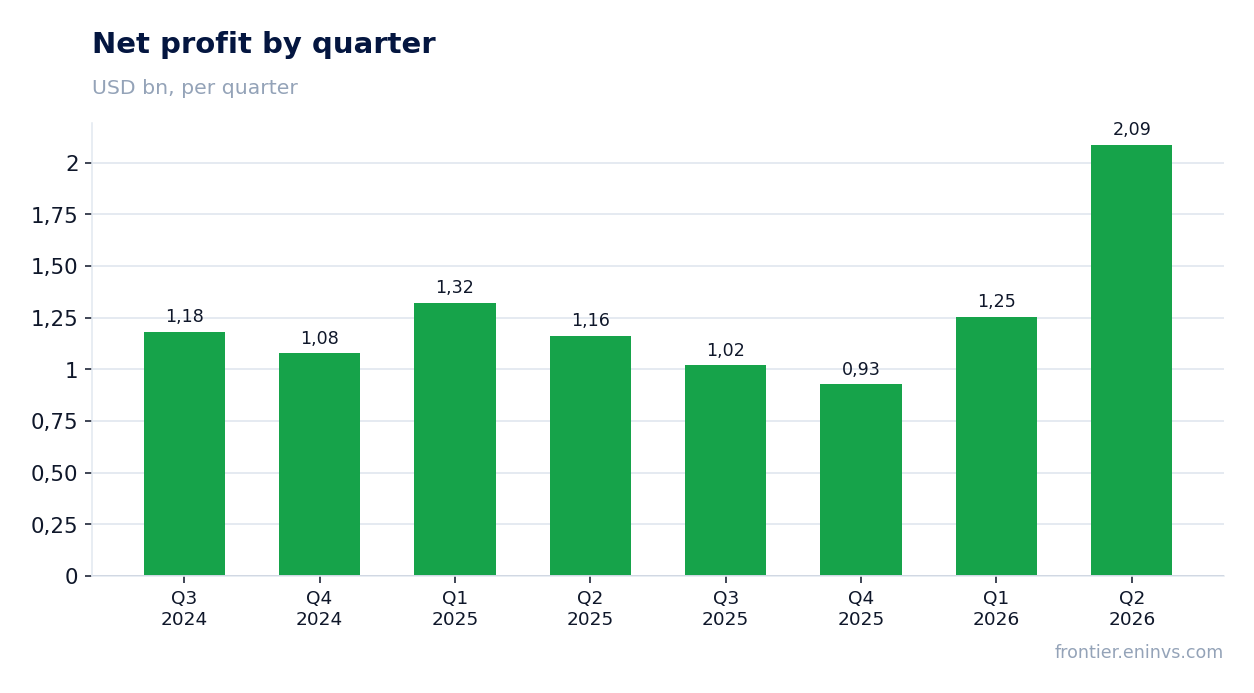
— Net profit +79.5% — operating growth plus one-off items
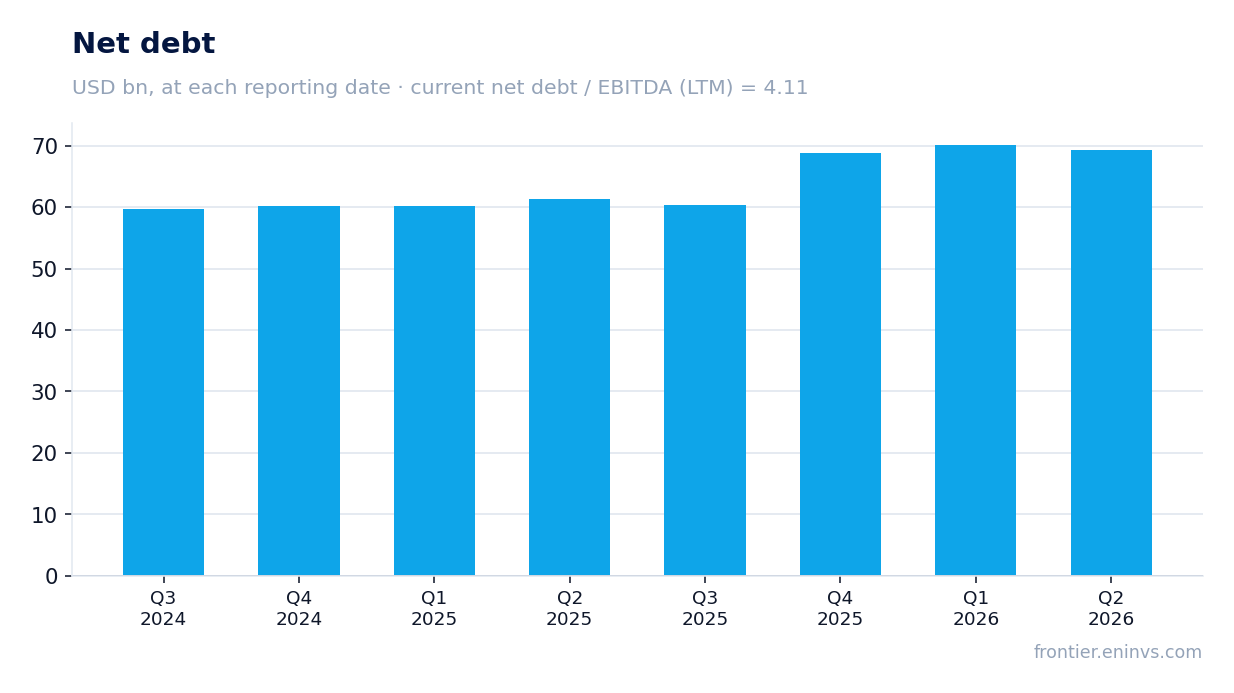
— Debt rose by $7.9bn over the year, but Net Debt/EBITDA of 4.11 is acceptable for an infrastructure company
— Capex increased, but operating cash flow covers it and dividends
— Dividend raised 3% to $0.34 per quarter, yield 6.2% — above average
— Company raised 2026 EBITDA guidance to $18.8–19.1bn
Attractiveness
Key figures, USD bn
| Metric | Q2 2025 | Q2 2026 | Change |
|---|---|---|---|
| Revenue | 19.2 | 34.3 | +78.4% |
| EBITDA | 3.69 | 5.07 | +37.2% |
| Operating profit | 2.31 | 3.57 | +54.8% |
| Net profit | 1.16 | 2.09 | +79.5% |
| Operating cash flow | 2.76 | 4.27 | +54.6% |
| Capex | 1.66 | 1.56 | -5.7% |
| EBITDA margin | 19.2% | 14.8% | -4.4 pp |
| Net margin | 6.0% | 6.1% | +0.1 pp |
Revenue +78% — record NGL, oil and gas volumes, but EBITDA margin fell from 19.2% to 14.8%
In Q2 2026, Energy Transfer LP revenue reached $34,334 million, up 78.4% year-over-year. The main contribution came from record volumes: NGL transportation up 13%, NGL exports up 25%, crude oil transportation up 4%, and midstream gathering up 4%. The company also notes growing demand for gas for power plants and LNG exports.
However, EBITDA margin fell from 19.2% to 14.8%. This is due to faster growth in cost of sales and operating expenses, especially in the Sunoco and NGL segments, where revenue grew on higher purchase costs and business expansion.
EBITDA growth of 37% driven by all segments, especially Sunoco and NGL exports
Adjusted EBITDA for Q2 rose 37.2% to $5,066 million. The strongest growth came from the investment in Sunoco LP segment: EBITDA increased from $454 million to $982 million, mainly due to recent acquisitions. The NGL and refined products segment grew from $1,033 million to $1,308 million thanks to high premiums on NGL export sales and higher terminal fees.
The midstream segment rose from $768 million to $884 million on higher processing volumes and NGL prices. Interstate and intrastate transportation also improved, helped by wider basis differentials and the commissioning of the Hugh Brinson pipeline.
Net profit +79.5% — operating growth plus one-off items
Net income attributable to partners in Q2 was $2,088 million versus $1,163 million a year earlier, up 79.5%. The report shows one-off items: last year there were debt extinguishment losses of $17 million and an impairment of $3 million; this quarter there are none. Unrealized gains on commodity hedging also helped: +$396 million versus +$100 million last year.
Excluding these items, profit growth would have been less impressive but still significant thanks to operating leverage.
Debt rose by $7.9bn over the year, but Net Debt/EBITDA of 4.11 is acceptable for an infrastructure company
Net debt at end-June 2026 was $68,821 million, up $7.9 billion over the last 12 months (down $0.9 billion quarter-on-quarter). The company issued $1.75 billion in subordinated notes in July 2026, partly explaining the debt increase.
Net Debt/EBITDA for the trailing twelve months is 4.11. This is a moderate level for a pipeline company with stable cash flows. Interest expense in Q2 rose from $865 million to $934 million, but operating cash flow covers it with room to spare.
Capex increased, but operating cash flow covers it and dividends
Operating cash flow in Q2 was $4,271 million, well above $2,762 million a year earlier. Capex rose from $1,659 million to $1,564 million (the report states growth capex of $1.10 billion and maintenance capex of $307 million).
Free cash flow after capex is positive and covers dividends, which were about $1,172 million in Q2. The company raised its 2026 capex guidance to $5.6–5.9 billion, which will require discipline, but current cash flow allows it.
Dividend raised 3% to $0.34 per quarter, yield 6.2% — above average
In July 2026, Energy Transfer declared a quarterly distribution of $0.34 per common unit, up 3% from a year earlier. This is the nineteenth consecutive increase. Annualized, the distribution is $1.36 per unit.
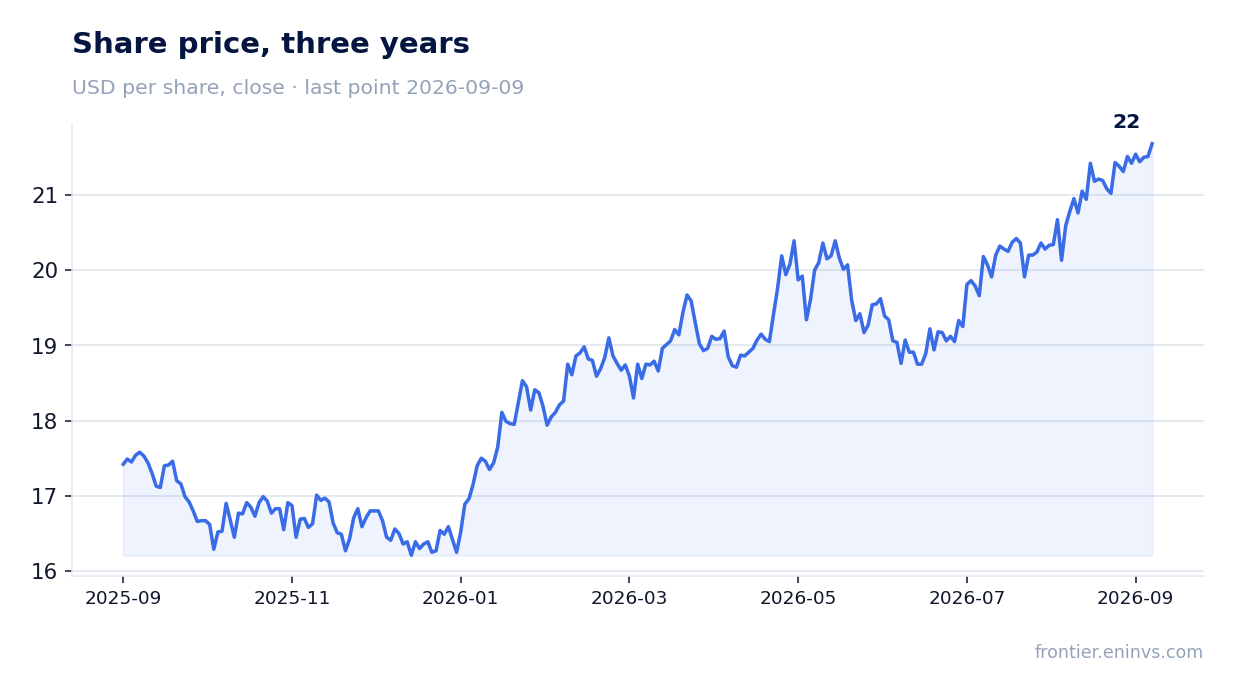
At the current share price of about $20.28, the trailing twelve-month dividend yield is 6.2%. This is above the market average and provides investors with solid income while the company continues to grow distributions. Payments are fully covered by cash flow: Q2 distributions were $1,172 million against operating cash flow of $4,271 million.
Company raised 2026 EBITDA guidance to $18.8–19.1bn
Energy Transfer raised its full-year 2026 adjusted EBITDA guidance to $18.8–19.1 billion from the previous range of $18.2–18.6 billion. This reflects management confidence in continued volume and margin growth, especially in the NGL segment and from recent acquisitions.
Trailing twelve-month EBITDA is $16,743 million, so the new guidance implies acceleration in H2. The company also expects new capacity, such as the Hugh Brinson pipeline and the Nederland export terminal expansion, to support results.
Valuation on the latest reported figures
| Metric | Value |
|---|---|
| Market cap | 74.8 bn USD |
| P/E (LTM) | 14.1 |
| EV/EBITDA (LTM) | 8.6 |
| P/B | 1.53 |
| Net debt / EBITDA (LTM) | 4.11 |
| Operating cash flow (LTM) | 10.1 bn |
| ROE | 33.6% |
| Dividend yield (12m) | 6.2% |
| EV/EBITDA, 3-year average | 8.5 |
Bottom line
Energy Transfer delivered a strong quarter: record volumes, 37% EBITDA growth, and a raised guidance. However, EBITDA margin declined, and profit growth was partly driven by one-off items. Debt rose but remains manageable, and the dividend is steadily increasing. At the current price, the stock trades at an EV/EBITDA multiple of 8.58, only slightly above its three-year average of 8.47, and offers a dividend yield of 6.2%. According to the portal's model, the upside potential is +90%, making the share attractive.
Open the company's financial profile ET →
See also: market overview · valuation map · stock screeners