Endeavour Silver: Q2 2026 profit rose to $66.5 million, but cash flow lags EBITDA
On August 29, Endeavour Silver released its Q2 2026 results. Revenue rose 139.4% year-on-year to $212.1 million, EBITDA jumped 773.7% to $90.8 million, and net profit reached $66.5 million versus a loss a year earlier. EBITDA margin reached 42.8%, net margin – 31.4%. At the current price, the share looks neutral: multiples are above historical levels, while operating cash flow lags EBITDA significantly.
Key takeaways
— Revenue rose 139.4% year-on-year to $212.1 million, but growth decelerated from the first quarter
— EBITDA increased to $90.8 million, but margin declined to 42.8% from 50.1% in the first quarter
— Net profit reached $66.5 million, but operating cash flow was only $39.8 million
— Leverage remains low: net debt to LTM EBITDA ratio is 0.05
— Capital expenditures fell to $29.1 million, supporting free cash flow
— EV/EBITDA LTM stands at 12.0, above historical levels, while P/E LTM is 49.8
— According to the portal's model, the downside to fair value is 66%
Attractiveness
Key figures, USD bn
| Metric | Q2 2025 | Q2 2026 | Change |
|---|---|---|---|
| Revenue | 0.09 | 0.21 | +139.4% |
| EBITDA | 0.01 | 0.09 | +773.7% |
| Operating profit | -0.00 | 0.06 | to profit |
| Net profit | -0.02 | 0.07 | to profit |
| Operating cash flow | 0.02 | 0.04 | +84.6% |
| Capex | 0.05 | 0.03 | -46.3% |
| EBITDA margin | 11.7% | 42.8% | +31.1 pp |
| Net margin | -23.1% | 31.4% | +54.5 pp |
Revenue rose 139.4% year-on-year to $212.1 million, but growth decelerated from the first quarter
In Q2 2026, Endeavour Silver's revenue reached $212.1 million, up 139.4% year-on-year. This continues the strong growth that began in 2025, when Q2 revenue was $88.6 million. However, compared to Q1 2026, when revenue was $209.7 million, growth has essentially stalled – an increase of less than 1.2%.
The deceleration in quarterly dynamics is explained by the fact that the main contribution to year-on-year growth came from the low base of Q2 2025. In Q1 2026, annual growth was 230.2%, slowing to 139.4% in Q2. This does not indicate a deterioration in market conditions, but shows that the low-base effect has run its course.
Revenue for the trailing twelve months (LTM) reached $730.1 million, reflecting a significant increase in the scale of the business. For comparison, full-year 2025 revenue was about $460 million, and 2024 – about $200 million. The company is demonstrating multiple growth, but the sustainability of this growth will depend on silver and gold prices.
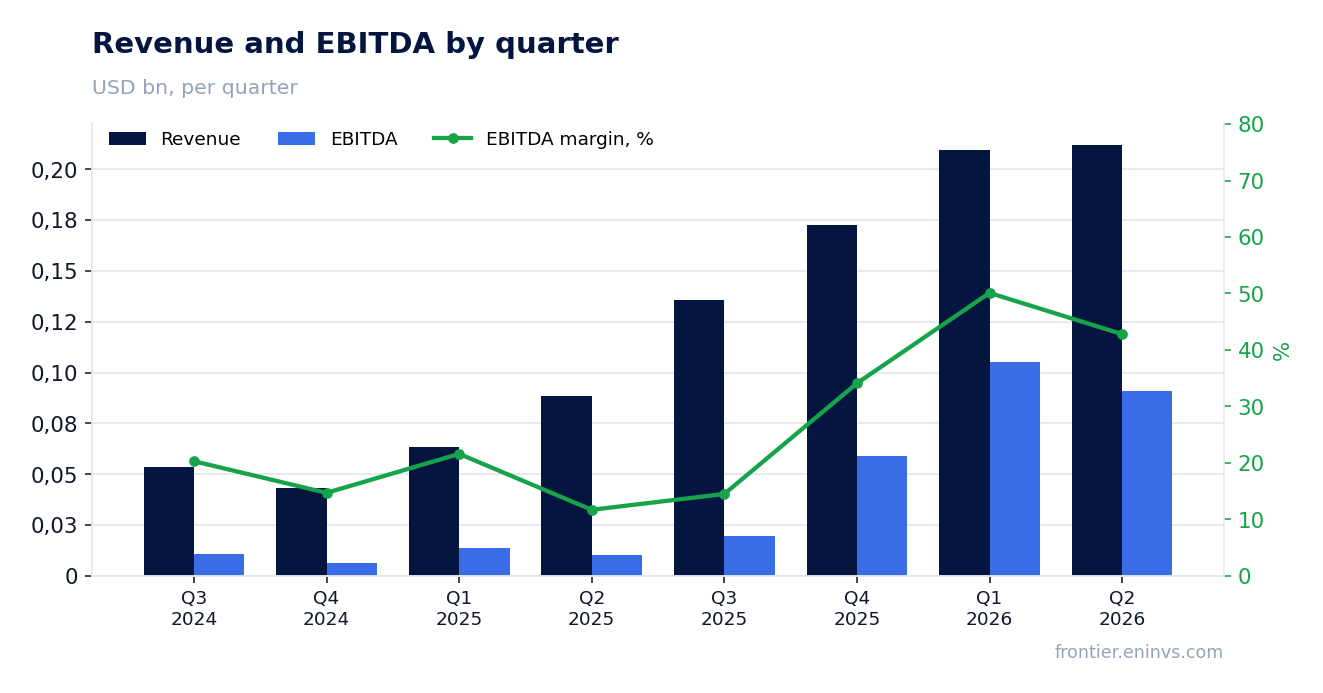
EBITDA increased to $90.8 million, but margin declined to 42.8% from 50.1% in the first quarter
EBITDA in Q2 2026 was $90.8 million, up 773.7% from $10.4 million in Q2 2025. EBITDA margin reached 42.8% versus 11.7% a year earlier. This margin growth is driven by both revenue increase and operating leverage: with revenue up 139.4%, EBITDA grew almost ninefold.
However, compared to Q1 2026, when EBITDA was $105.0 million with a 50.1% margin, Q2 saw a decline in both absolute terms and margin. This may be due to changes in sales structure or cost increases, but the exact reasons are not disclosed in the provided data.
Operating profit in Q2 was $64.7 million, also below the Q1 level of $83.7 million. Nevertheless, the company remains highly profitable: operating margin exceeds 30%. For a mining company, this is a strong result, but it is sensitive to precious metal prices.
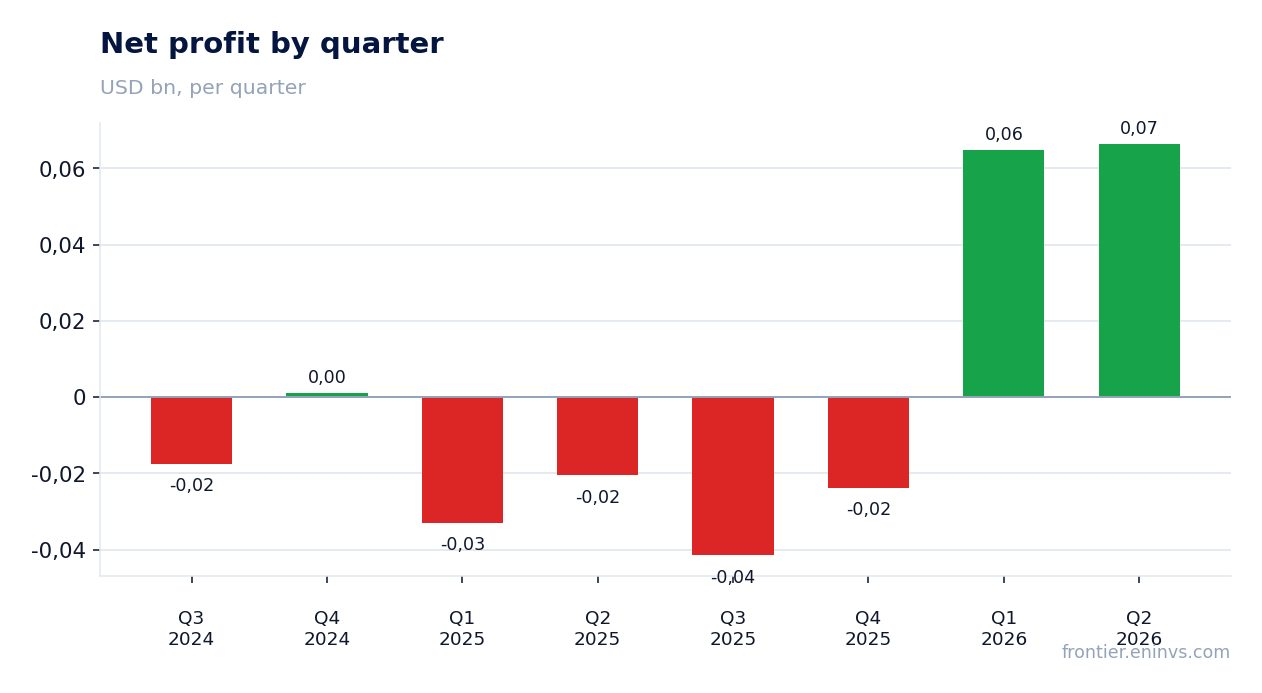
Net profit reached $66.5 million, but operating cash flow was only $39.8 million
Net profit in Q2 2026 was $66.5 million versus a loss of $20.5 million a year earlier. Net margin reached 31.4% against a negative margin of -23.1% a year earlier. This is a significant improvement, but operating cash flow was substantially lower than profit – $39.8 million.
The gap between net profit and operating cash flow may be explained by non-cash items such as depreciation or changes in working capital. In Q1 2026, operating cash flow was even lower – $20.7 million with net profit of $64.9 million. Thus, in Q2 the situation improved slightly but is still far from ideal.
Over the trailing twelve months, operating cash flow was $67.4 million, significantly less than LTM EBITDA of $274.5 million. This suggests that a substantial portion of profit is not converting into cash, which may be related to working capital investments or accounting specifics.
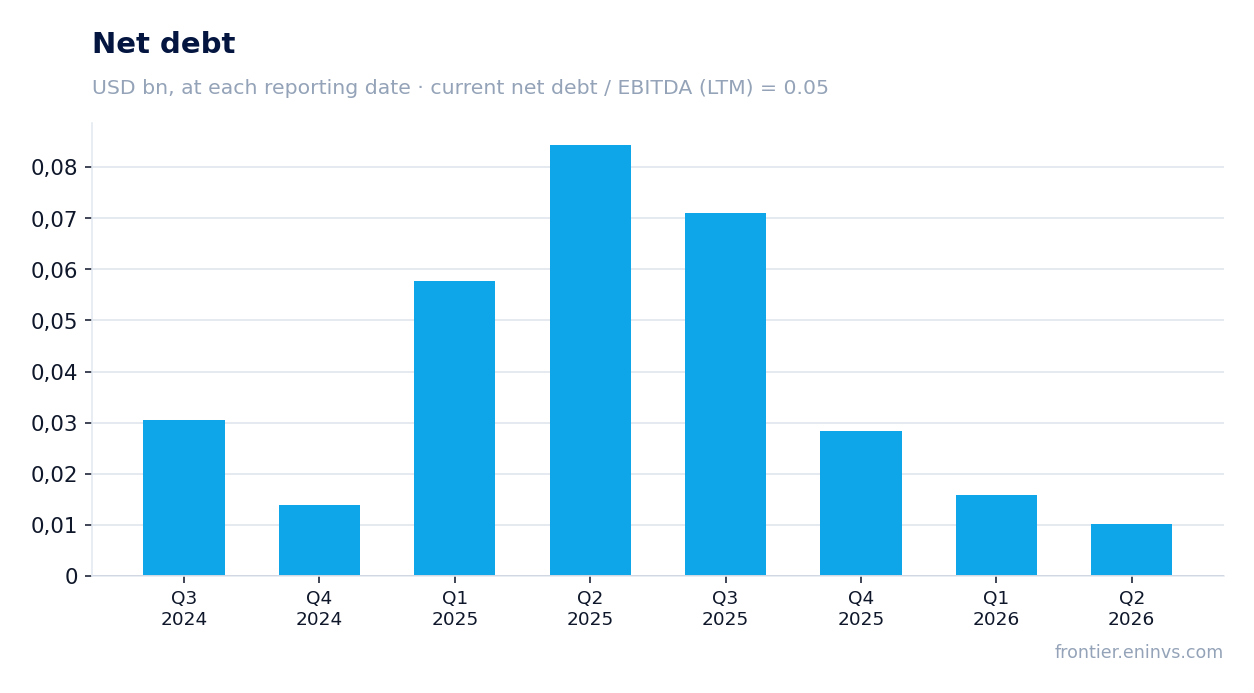
Leverage remains low: net debt to LTM EBITDA ratio is 0.05
Net debt at the latest reporting date was $13.8 million, and the net debt to LTM EBITDA ratio was 0.05. This is a very low level of leverage, giving the company significant financial flexibility. For comparison, in previous periods net debt was higher: for example, at the end of Q2 2025 it was $84.4 million.
The reduction in net debt occurred against the backdrop of EBITDA growth, which allowed the company to strengthen its balance sheet. Low leverage reduces risks in case of falling metal prices and allows financing development from own funds or attracting debt on favorable terms.
However, it should be noted that the net debt to LTM EBITDA ratio has no historical dynamics in the provided data, so it cannot be stated that leverage has decreased – one can only note that it is at a low level.
Capital expenditures fell to $29.1 million, supporting free cash flow
Capital expenditures in Q2 2026 were $29.1 million, lower than in Q1 ($37.9 million) and significantly lower than in Q2 2025 ($54.2 million). The reduction in capital expenditures contributes to free cash flow growth, which is important for financing development and possible dividends.
Operating cash flow of $39.8 million minus capital expenditures of $29.1 million gives free cash flow of about $10.7 million. This is a positive figure, but it is small relative to net profit and EBITDA. In Q1 2026, free cash flow was negative: $20.7 million operating cash flow minus $37.9 million capital expenditures.
The reduction in capital expenditures may be related to the completion of investment projects or cost optimization. In any case, it supports the company's liquidity and reduces the need for external financing.
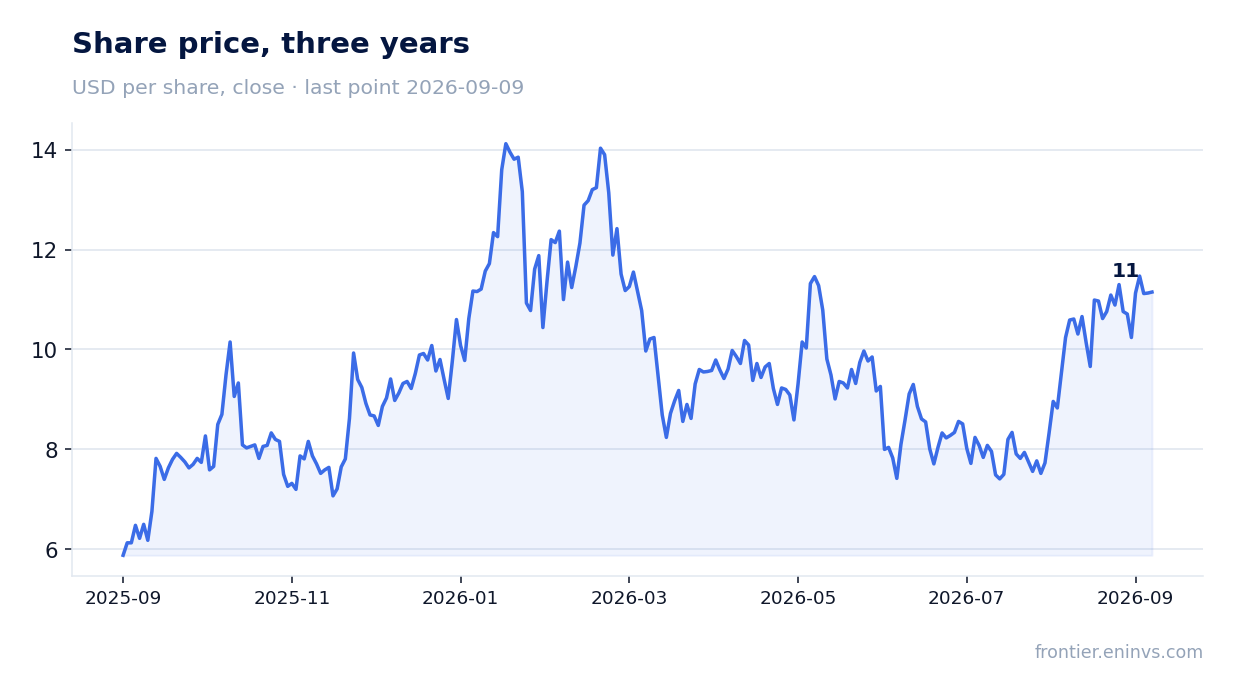
EV/EBITDA LTM stands at 12.0, above historical levels, while P/E LTM is 49.8
Currently, Endeavour Silver's market capitalization is $3,293.8 million, and EV/EBITDA LTM is 12.0. P/E LTM is 49.8. These multiples appear high, especially considering that the company operates in a cyclical industry. For comparison, historical averages over the past three years are not provided in the data, so it cannot be stated that the current level is above or below historical.
According to the portal's model, which re-prices EBITDA at current commodity prices and a target EV/EBITDA, the downside to fair value is estimated at -66%. This means that at current metal prices and the target multiple, the share appears overvalued. However, the portal's model is not a consensus forecast but our own calculation.
High multiples may be justified by expectations of further profit growth, but the current EV/EBITDA of 12.0 suggests that the market is already pricing in significant growth. If silver and gold prices decline, multiples could quickly rise even further, putting pressure on the share.
According to the portal's model, the downside to fair value is 66%
The portal's model, based on re-pricing EBITDA at current commodity prices and a target EV/EBITDA, indicates a downside to fair value of -66%. This is a substantial gap, suggesting that the current share price may be overvalued relative to the fundamental value calculated by our model.
It should be emphasized that this is not a market consensus or a target price, but the result of our own model. It is sensitive to assumptions about metal prices and the target multiple. If silver and gold prices remain high or rise, fair value could be higher.
Nevertheless, the current valuation suggests that the market is pricing in a very optimistic scenario. For an investor, this means that the margin of safety is small, and any disappointment could lead to a significant correction.
Valuation on the latest reported figures
| Metric | Value |
|---|---|
| Market cap | 3.29 bn USD |
| P/E (LTM) | 49.8 |
| EV/EBITDA (LTM) | 12.0 |
| P/B | 6.80 |
| Net debt / EBITDA (LTM) | 0.05 |
| Operating cash flow (LTM) | 0.07 bn |
| ROE | 39.2% |
Bottom line
Bottom line: In Q2 2026, Endeavour Silver showed strong revenue and profit growth, but growth decelerated from Q1, and operating cash flow remains significantly below EBITDA. Leverage is low, capital expenditures are declining, supporting free cash flow. However, EV/EBITDA and P/E multiples are at high levels, and the portal's model indicates a 66% downside to fair value. At the current price, the share looks neutral: strong operating results are already priced in, while risks of falling metal prices and weak cash conversion limit upside potential.
Open the company's financial profile EXK →
See also: market overview · valuation map · stock screeners