Freeport-McMoRan: copper prices fell, but production is ramping up — the question is the share price
23 июля 2026 года Freeport-McMoRan раскрыла результаты за второй квартал 2026 года: выручка снизилась на 8,8% год к году до 6 917 млн долларов, EBITDA — на 18,5% до 2 526 млн, чистая прибыль — на 36,4% до 984 млн. На фоне падения цен на медь компания продолжает наращивать добычу и сокращать долг, но акции торгуются значительно дороже своей трёхлетней истории, что делает их скорее непривлекательными на текущем уровне.
Key takeaways
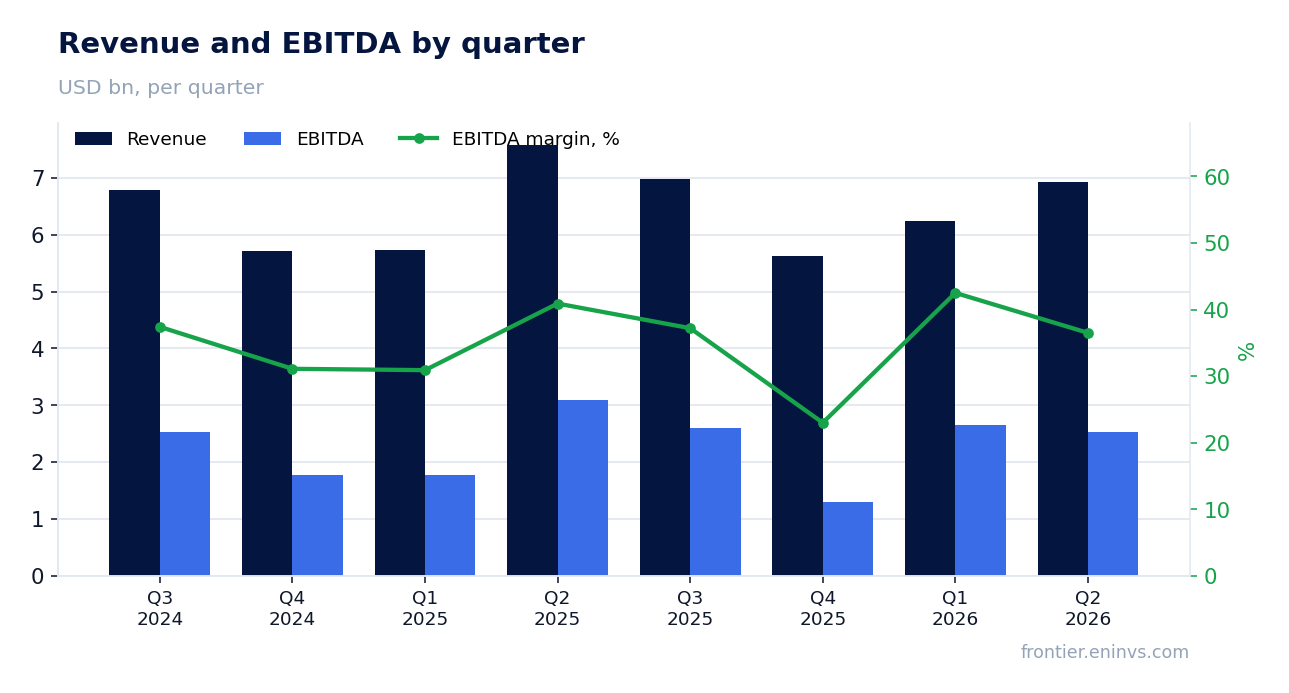
— Revenue fell 8.8% due to lower copper prices and lower sales volumes in Indonesia
— EBITDA declined 18.5%, but the margin remained high at 36.5%
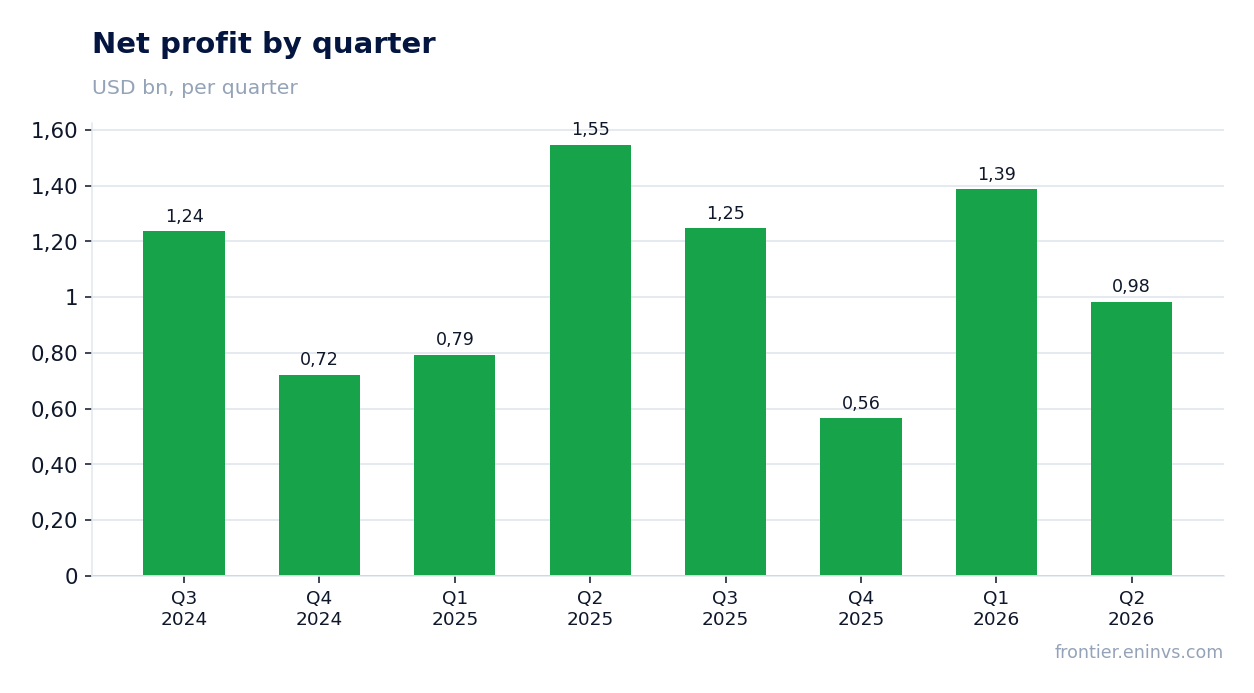
— Net profit fell 36.4% due to one-off charges and weak performance in Indonesia
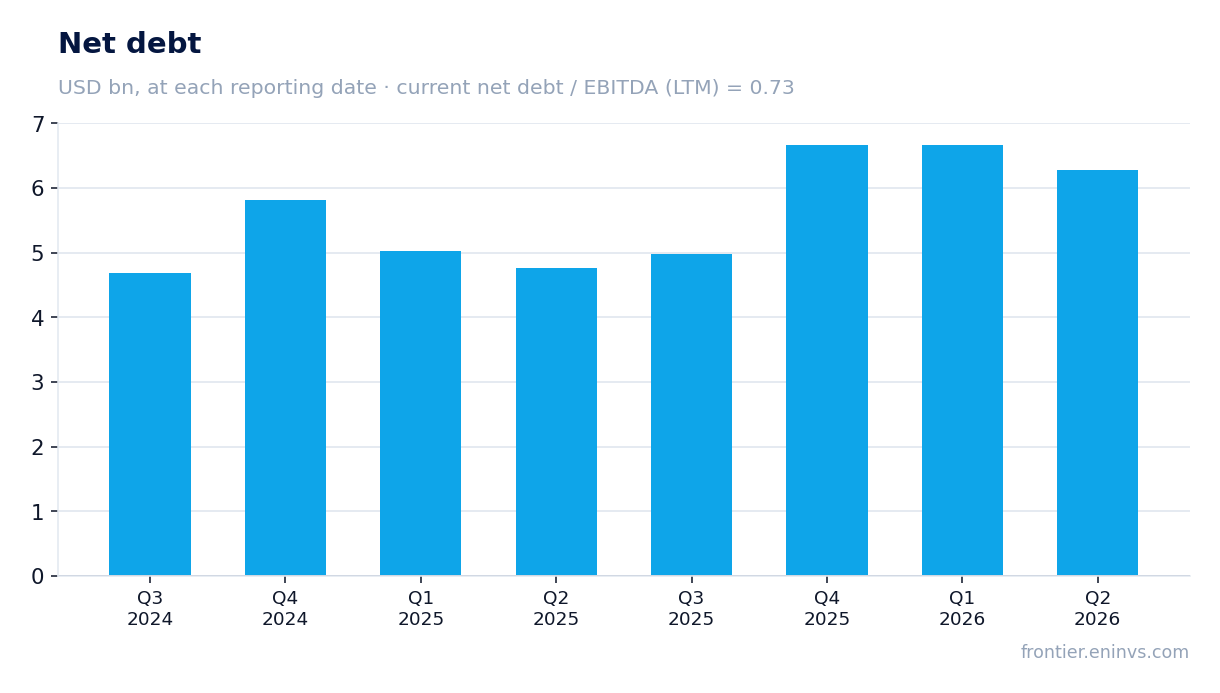
— Leverage remains moderate: net debt/EBITDA LTM is 0.73
— Capex increased, but operating cash flow covers it with a surplus
— Quarterly dividend was $0.15 per share, but the yield is low
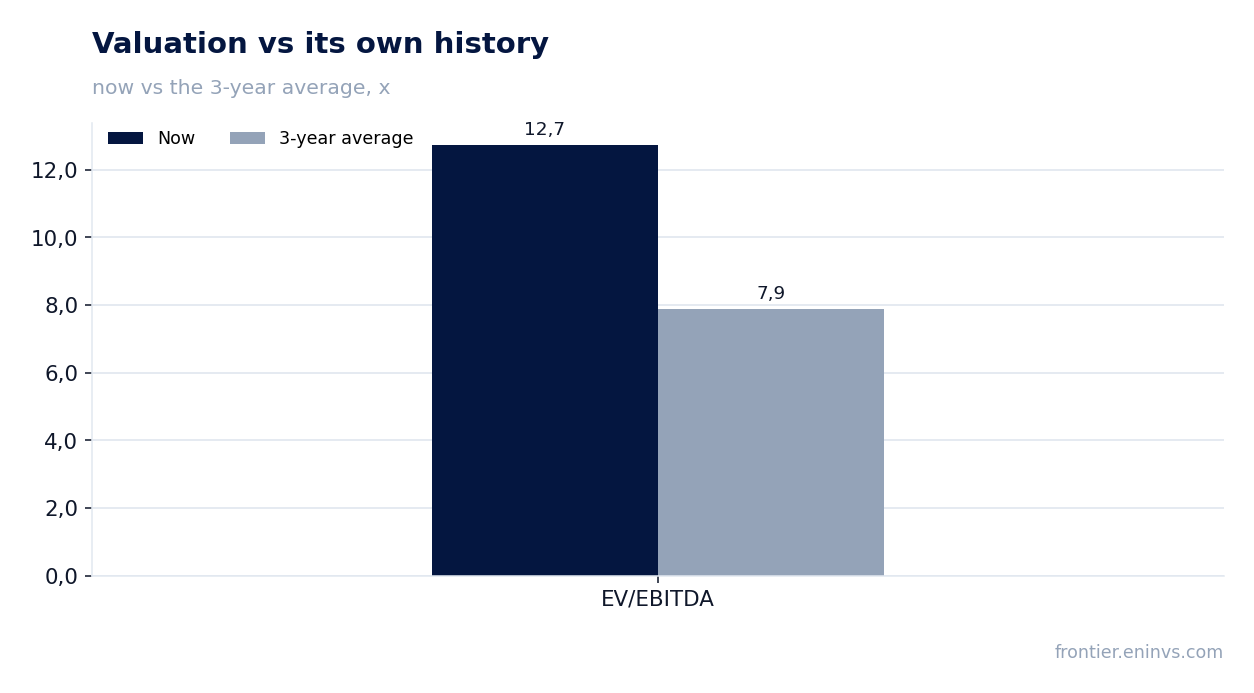
— Shares trade at a premium to their own history: EV/EBITDA LTM is 12.7 versus the 3-year average of 7.9
Attractiveness
Key figures, USD bn
| Metric | Q2 2025 | Q2 2026 | Change |
|---|---|---|---|
| Revenue | 7.58 | 6.92 | -8.8% |
| EBITDA | 3.10 | 2.53 | -18.5% |
| Operating profit | 2.43 | 2.00 | -17.6% |
| Net profit | 1.55 | 0.98 | -36.4% |
| Operating cash flow | 2.19 | 2.05 | -6.7% |
| Capex | 1.26 | 1.10 | -12.5% |
| EBITDA margin | 40.9% | 36.5% | -4.4 pp |
| Net margin | 20.4% | 14.2% | -6.2 pp |
Revenue fell 8.8% due to lower copper prices and lower sales volumes in Indonesia
In Q2 2026, Freeport-McMoRan's revenue was $6,917 million, down 8.8% year-on-year. The main reason is lower average realized copper prices of $6.17 per pound versus $4.54 a year ago, as well as lower sales volumes in Indonesia: copper sales fell from 443 million pounds to 153 million pounds due to the phased ramp-up of the Grasberg Block Cave underground mine after the September 2025 incident.
In the US and South America, sales volumes remained stable: 312 million pounds versus 308 million a year ago and 245 million versus 265 million, respectively. The company reaffirmed its 2026 copper sales guidance of approximately 3.1 billion pounds, implying acceleration in the second half.
EBITDA declined 18.5%, but the margin remained high at 36.5%
EBITDA in Q2 2026 was $2,526 million, down 18.5% year-on-year. EBITDA margin declined from 40.9% to 36.5%, but remained high thanks to higher gold and molybdenum prices, which partially offset lower copper prices.
Average realized gold prices rose from $3,291 to $4,520 per ounce, molybdenum from $21.10 to $28.75 per pound. This helped support the margin despite higher unit costs: unit net cash costs rose from $1.13 to $1.97 per pound of copper, mainly due to lower volumes in Indonesia.
Net profit fell 36.4% due to one-off charges and weak performance in Indonesia
Net profit in Q2 2026 was $984 million, down 36.4% year-on-year. The company reports adjusted net income of $1.1 billion, or $0.74 per share, after excluding one-off charges of $96 million related to restoration costs following the incident in Indonesia.
The decline also reflects lower sales volumes in Indonesia and higher unit costs. However, in H1 2026 net profit rose to $1,865 million from $1,124 million a year earlier, driven by high gold and molybdenum prices.
Leverage remains moderate: net debt/EBITDA LTM is 0.73
At the end of Q2 2026, Freeport-McMoRan's net debt was $6,279 million, down $385 million from the previous quarter. Net debt to EBITDA for the last twelve months is 0.73, a moderate level for a mining company.
The company notes that net debt, excluding debt for downstream processing facilities in Indonesia, is $2.1 billion, with a target range of $3-4 billion. This provides financial flexibility for capital investments and shareholder returns.
Capex increased, but operating cash flow covers it with a surplus
In Q2 2026, capital expenditures were $1,104 million, lower than a year earlier ($1,261 million). Operating cash flow for the quarter was $2,048 million, covering capex with a surplus: free cash flow before dividends was about $944 million.
Over the last twelve months, operating cash flow reached $5,600 million, and capex for the same period was about $4,438 million (sum of quarterly values). The company reaffirmed its 2026 capex guidance of $4.3 billion, including $3.0 billion for major projects, implying continued positive free cash flow.
Quarterly dividend was $0.15 per share, but the yield is low
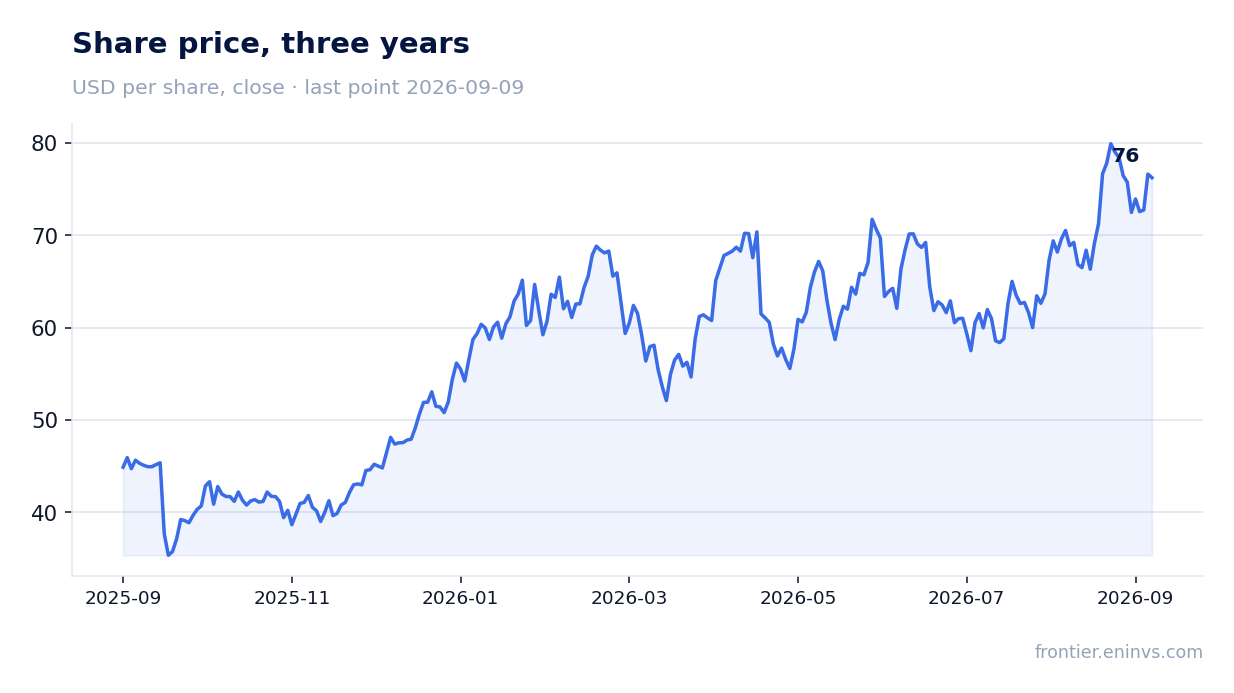
In June 2026, the board declared quarterly dividends of $0.15 per share, including a base dividend of $0.075 and a variable dividend of $0.075. Over the last twelve months, the dividend yield was 0.79% at the current share price.
The company continues to pay dividends under its policy of returning up to 50% of free cash flow to shareholders. However, at the current share price, the yield is low, making the dividend component less attractive for income-oriented investors.
Shares trade at a premium to their own history: EV/EBITDA LTM is 12.7 versus the 3-year average of 7.9
Currently, Freeport-McMoRan's market capitalization is $109,238 million, and EV/EBITDA for the last twelve months is 12.7. This is significantly higher than the 3-year average EV/EBITDA of 7.9, indicating that the shares are overvalued relative to their own history.
According to the portal's model, with EBITDA re-priced to current copper prices and the target EV/EBITDA, the upside to fair value is minus 41%. This means the market has already priced in an optimistic scenario of production recovery and higher copper prices.
Valuation on the latest reported figures
| Metric | Value |
|---|---|
| Market cap | 109 bn USD |
| P/E (LTM) | 26.1 |
| EV/EBITDA (LTM) | 12.7 |
| P/B | 5.78 |
| Net debt / EBITDA (LTM) | 0.73 |
| Operating cash flow (LTM) | 5.60 bn |
| ROE | 19.9% |
| Dividend yield (12m) | 0.8% |
| EV/EBITDA, 3-year average | 7.9 |
Bottom line
Freeport-McMoRan delivered strong operational results: the company is ramping up production, reducing debt, and generating sufficient cash flow to cover capex. However, lower copper prices and one-off charges led to a decline in profit in Q2, and the shares trade at a premium to their own history, with the portal's model implying a 41% downside. For investors, the key question is whether the recovery in production and copper prices will justify such a valuation, or whether the market has already priced in an overly optimistic scenario.
Open the company's financial profile FCX →
See also: market overview · valuation map · stock screeners