Franco-Nevada Corporation: revenue up 57%, but the portal's model sees 48% downside

25 августа Franco-Nevada Corporation раскрыла результаты за второй квартал 2026 года. Выручка выросла на 57,3% год к году, до 580,9 млн долл., EBITDA – на 43,5%, до 530,7 млн долл., чистая прибыль – на 43,3%, до 354,0 млн долл. На фоне сильных результатов акции торгуются по мультипликатору EV/EBITDA 24,1x против среднего за три года 23,0x, а по модели портала потенциал снижения составляет -48%, что делает бумагу непривлекательной на текущей цене.
Key takeaways
— Revenue in Q2 2026 grew 57.3% YoY to $580.9 million, driven by higher gold prices and increased production volumes.
— EBITDA margin declined to 91.4% from 100.1% a year earlier, reflecting higher operating costs and a larger share of lower-margin streaming agreements.
— Net profit rose 43.3% YoY to $354.0 million, but net margin fell from 66.9% to 60.9%.
— Operating cash flow in Q2 2026 was $482.5 million, nearly double capital expenditures of $98.5 million.
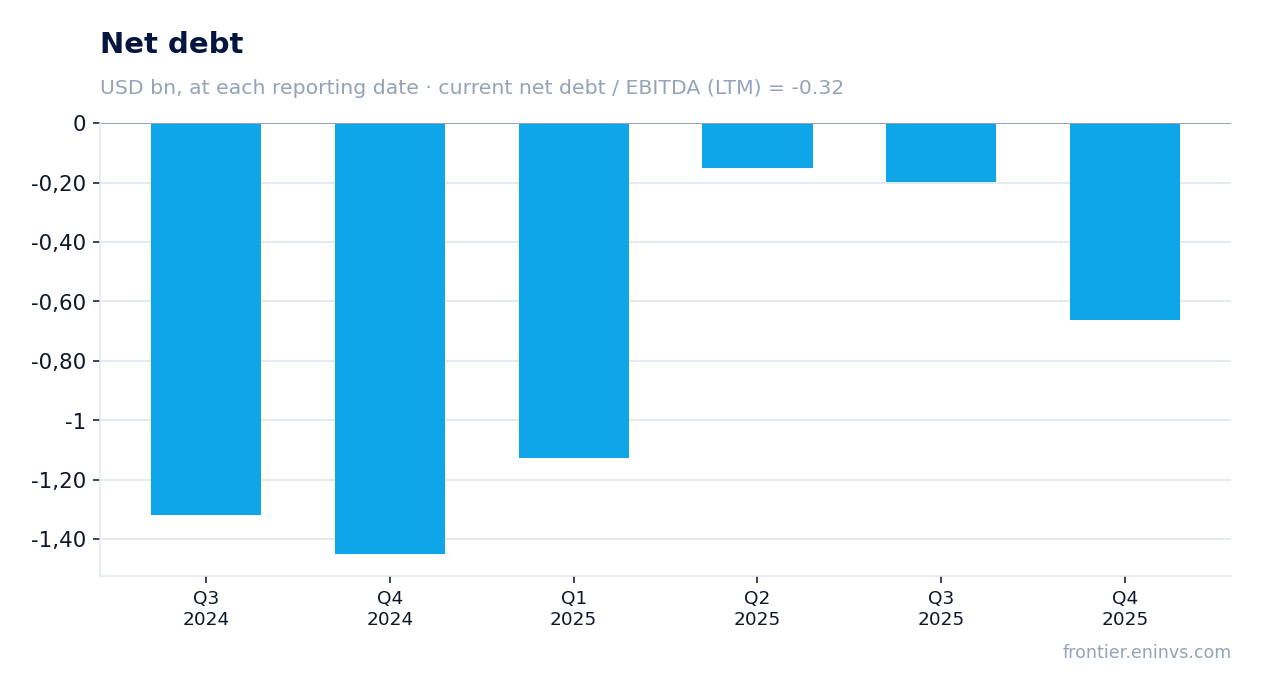
— The company maintains a net cash position: net debt was -$662.4 million, equivalent to -0.32x EBITDA over the last twelve months.
— Dividend yield over the last twelve months is 0.33%, below historical levels and the key rate, making dividends a minor factor for investors.
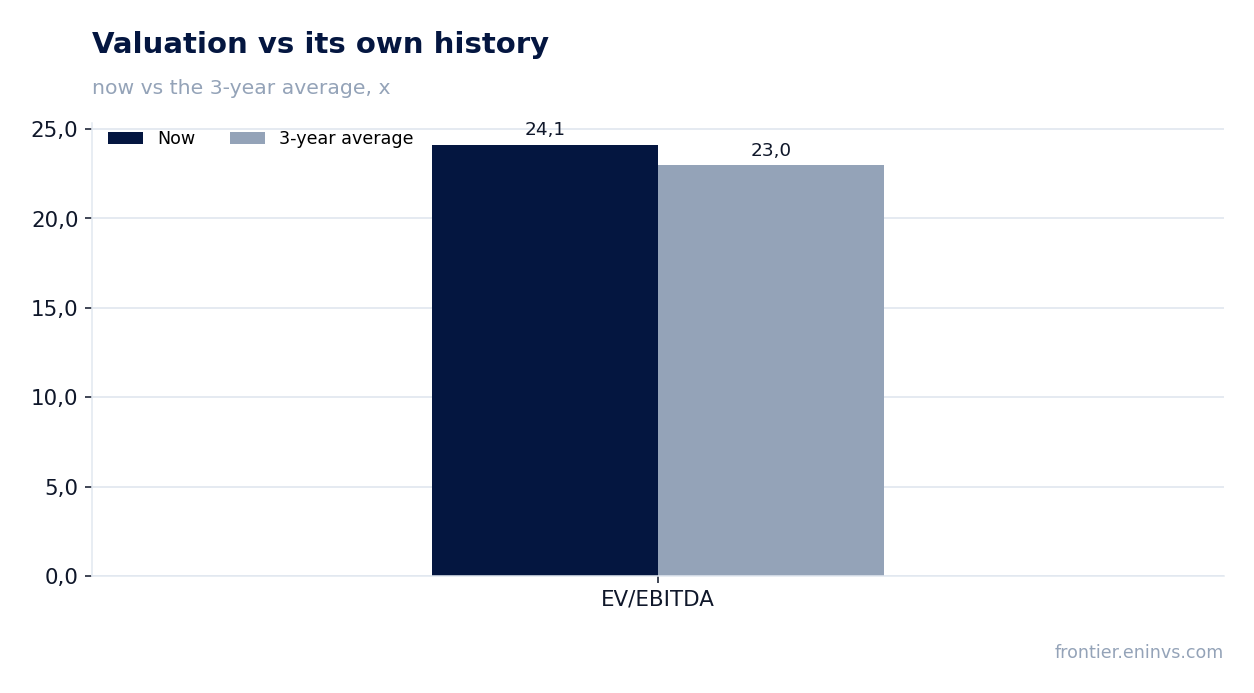
— EV/EBITDA multiple of 24.1x exceeds the three-year average of 23.0x, and the portal's model suggests the stock is overvalued by 48%.
Attractiveness
Key figures, USD bn
| Metric | Q2 2025 | Q2 2026 | Change |
|---|---|---|---|
| Revenue | 0.37 | 0.58 | +57.3% |
| EBITDA | 0.37 | 0.53 | +43.5% |
| Operating profit | 0.31 | 0.45 | +46.1% |
| Net profit | 0.25 | 0.35 | +43.3% |
| Operating cash flow | 0.43 | 0.48 | +12.1% |
| Capex | 1.36 | 0.10 | -92.8% |
| EBITDA margin | 100.1% | 91.4% | -8.7 pp |
| Net margin | 66.9% | 60.9% | -6.0 pp |
Revenue in Q2 2026 grew 57.3% YoY to $580.9 million, driven by higher gold prices and increased production volumes.
In Q2 2026, Franco-Nevada Corporation's revenue reached $580.9 million, 57.3% higher than in the same period last year. This continues a strong trend: Q1 2026 saw growth of 76.6%, and Q4 2025 – 86.1%. The main drivers remain the favorable gold market and increased production volumes at the company's assets.
Over the last twelve months, revenue reached $2,300.0 million, reflecting a steady upward trend. The company continues to benefit from its diversified royalty and streaming model, which provides a stable income stream without significant operating costs.
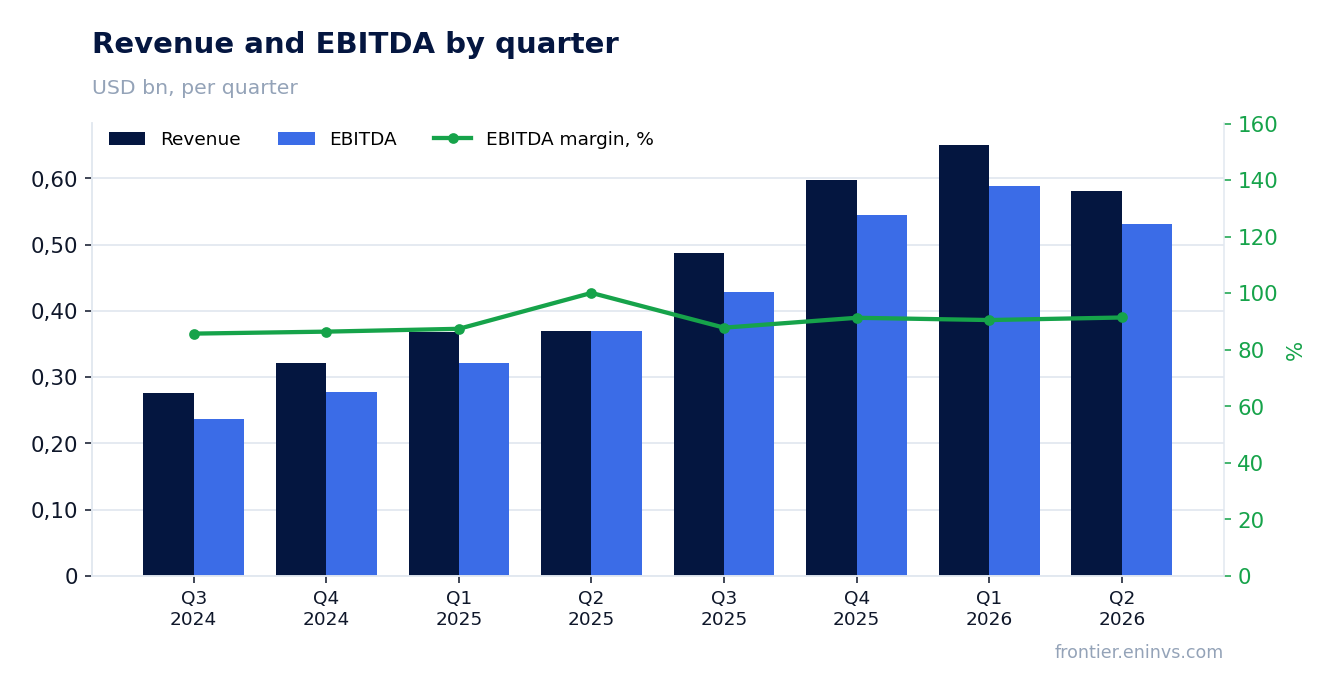
EBITDA margin declined to 91.4% from 100.1% a year earlier, reflecting higher operating costs and a larger share of lower-margin streaming agreements.
EBITDA in Q2 2026 was $530.7 million, up 43.5% YoY. However, the EBITDA margin declined to 91.4% from 100.1% in Q2 2025. This is due to a shift in revenue mix: a larger share of streaming agreements, which require upfront payments and carry higher costs.
The margin decline is not critical, as absolute profitability continues to grow. Nevertheless, investors should note that further expansion of the streaming portfolio could pressure margins in the future.
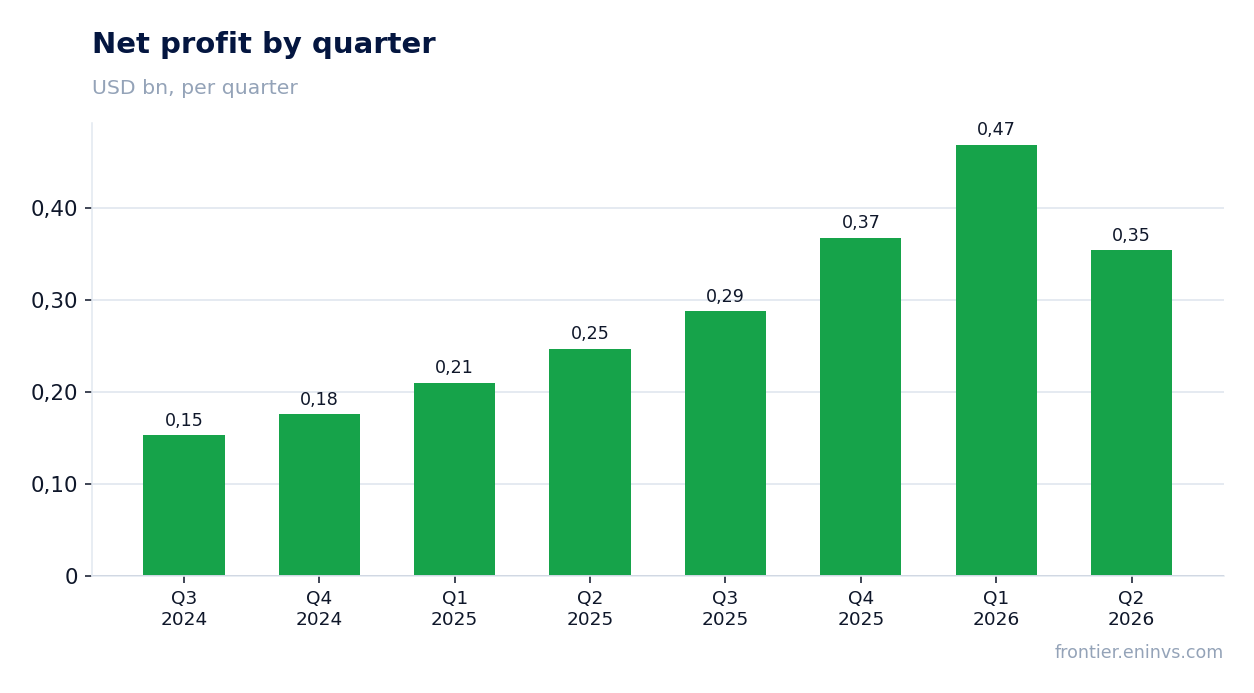
Net profit rose 43.3% YoY to $354.0 million, but net margin fell from 66.9% to 60.9%.
Net profit for Q2 2026 was $354.0 million, 43.3% higher than a year earlier. The growth was driven by higher revenue and operating profit, which reached $446.7 million.
Net margin declined to 60.9% from 66.9% in Q2 2025. The reason is faster growth in tax and interest expenses, as well as lower EBITDA margin. Over the last twelve months, net profit was $1,477.8 million, confirming strong profit generation.
Operating cash flow in Q2 2026 was $482.5 million, nearly double capital expenditures of $98.5 million.
Operating cash flow in Q2 2026 reached $482.5 million, well above capital expenditures of $98.5 million. Free cash flow remains positive at about $384 million for the quarter, providing resources for dividend payments and new investments.
Over the last twelve months, operating cash flow was $1,500.0 million, confirming the high quality of earnings. The company does not need to raise debt to finance its operations and maintains financial flexibility.
The company maintains a net cash position: net debt was -$662.4 million, equivalent to -0.32x EBITDA over the last twelve months.
As of the latest reporting date, Franco-Nevada Corporation's net debt was -$662.4 million, meaning the company has a net cash position. The net debt to EBITDA ratio over the last twelve months stands at -0.32x, indicating no debt burden.
Over the last twelve months, net debt increased by $0.8 billion, but this does not change the overall picture: the company remains financially strong and able to finance its investments from internal funds.
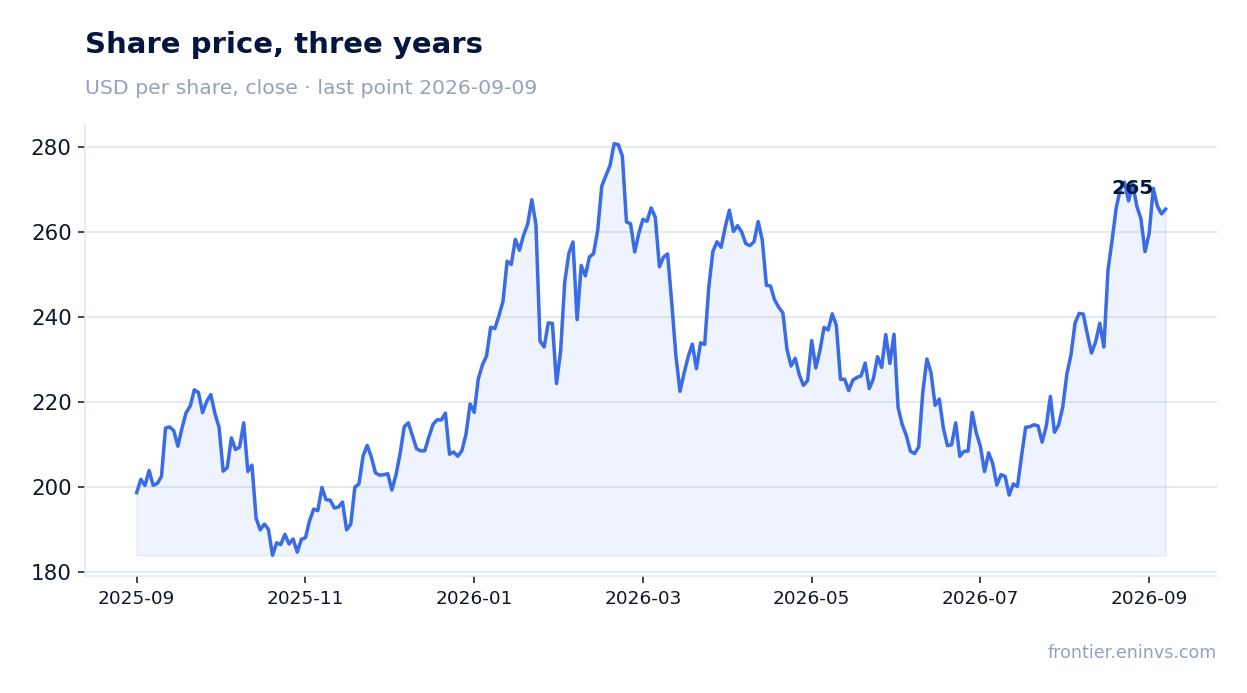
Dividend yield over the last twelve months is 0.33%, below historical levels and the key rate, making dividends a minor factor for investors.
Over the last twelve months, Franco-Nevada Corporation paid dividends providing a yield of 0.33% on the current share price. This is significantly below the key rate and historical yield levels that investors typically expect from dividend stocks.
The low dividend yield is explained by the significant rise in the company's share price over the past year. For income-oriented investors, the stock is currently of little interest, but for long-term investments the company remains attractive due to capital appreciation.
EV/EBITDA multiple of 24.1x exceeds the three-year average of 23.0x, and the portal's model suggests the stock is overvalued by 48%.
The current EV/EBITDA multiple is 24.1x, above the three-year average of 23.0x. P/E over the last twelve months stands at 34.6x, also indicating a high valuation of the business.
According to the portal's model, which re-prices EBITDA at current commodity prices, the potential downside for the shares is -48% from the current market price. This means the market has already priced in an optimistic scenario, and further growth is unlikely without a significant improvement in market conditions.
Valuation on the latest reported figures
| Metric | Value |
|---|---|
| Market cap | 51.1 bn USD |
| P/E (LTM) | 34.6 |
| EV/EBITDA (LTM) | 24.1 |
| P/B | 6.70 |
| Net debt / EBITDA (LTM) | -0.32 |
| Operating cash flow (LTM) | 1.50 bn |
| ROE | 17.3% |
| Dividend yield (12m) | 0.3% |
| EV/EBITDA, 3-year average | 23.0 |
Bottom line
Franco-Nevada Corporation is delivering strong results: revenue and profit are growing at double-digit rates, the company maintains a net cash position and generates significant free cash flow. However, the current valuation already reflects an optimistic scenario: multiples are above historical averages, and the portal's model indicates 48% downside. Dividend yield is minimal, making the stock unattractive for income-oriented investors. If gold prices remain high, the company could continue to grow, but at the current price the margin of safety is limited. Verdict – unattractive.
Open the company's financial profile FNV →
See also: market overview · valuation map · stock screeners