Gerdau: profit up 86%, but the recovery rests on margin, not volumes
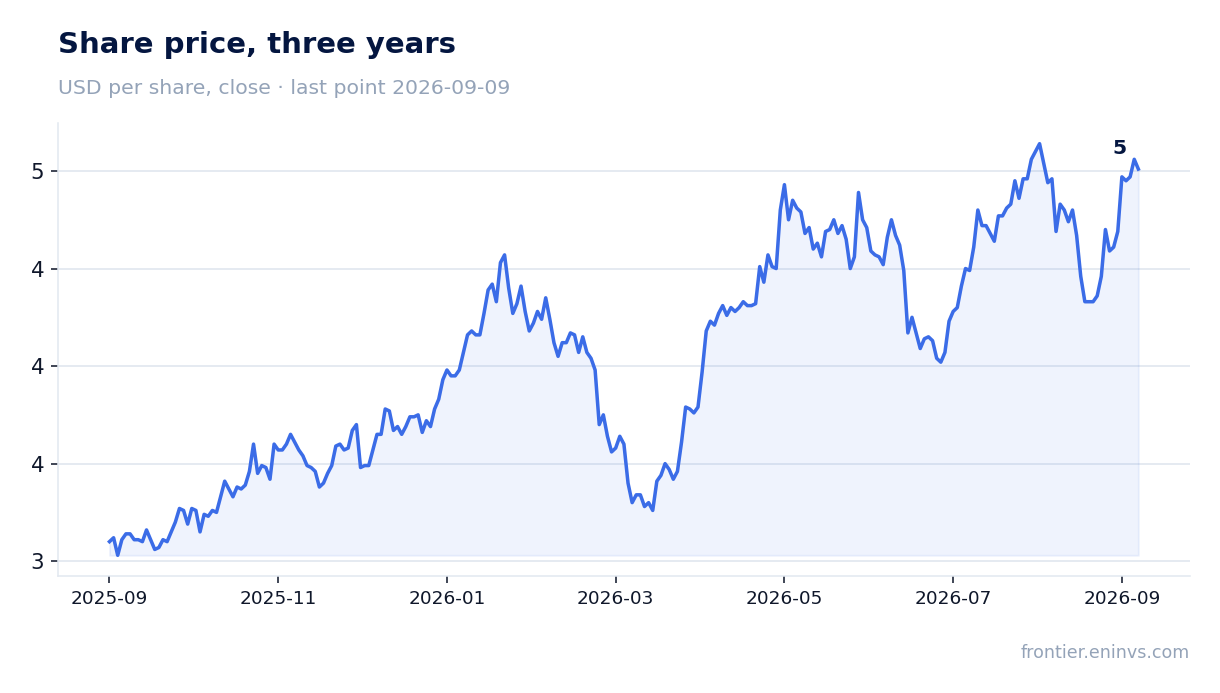
Gerdau reported second-quarter 2026 results. Revenue rose 12.0% year on year to USD 3,519.2m, EBITDA added 47.5%, and net profit jumped 86.2% to USD 288.7m. The EBITDA margin climbed to 18.2% from 13.8% a year earlier, and margin expansion, not volume growth, drove the bulk of the result. At the current price the stock trades at 6.74x LTM EBITDA with net debt at 0.85x EBITDA and a trailing dividend yield near 2.0%; our model puts fair value 70% below the market, hence the verdict: rather unattractive.
Key takeaways
— Revenue rose 12.0% year on year to USD 3,519.2m, the strongest quarterly print in two years
— EBITDA added 47.5% and the margin climbed to 18.2% from 13.8% — the gain came entirely from margin, not volumes
— Net profit rose 86.2% to USD 288.7m, but was already USD 202.0m a quarter earlier — the trend is sequential, not one-off
— Leverage at 0.85x LTM EBITDA is moderate, but absolute net debt rose to USD 1,598.6m from USD 1,425.7m at end-2025
— Quarterly operating cash flow was USD 302.3m against capex of USD 217.1m — free cash flow stays positive but thin
— Trailing 12-month dividend yield of 2.0% sits below the policy rate and does not compensate for re-rating risk
— At P/E 38.4 and EV/EBITDA 6.74 the market already prices a durable margin recovery, while our model shows 70% downside to fair value
Attractiveness
Key figures, USD bn
| Metric | Q2 2025 | Q2 2026 | Change |
|---|---|---|---|
| Revenue | 3.14 | 3.52 | +12.0% |
| EBITDA | 0.43 | 0.64 | +47.5% |
| Operating profit | 0.27 | 0.46 | +72.4% |
| Net profit | 0.16 | 0.29 | +86.2% |
| Operating cash flow | 0.18 | 0.30 | +66.1% |
| Capex | 0.30 | 0.22 | -28.8% |
| EBITDA margin | 13.8% | 18.2% | +4.4 pp |
| Net margin | 4.9% | 8.2% | +3.3 pp |
Revenue rose 12.0% year on year to USD 3,519.2m, the strongest quarterly print in two years
In the second quarter of 2026 Gerdau's revenue reached USD 3,519.2m, up 12.0% from the second quarter of 2025. This is the strongest quarterly figure in two years: the previous peak was Q3 2025 at USD 3,341.4m. Growth accelerated from the first quarter, when revenue added 7.8%.
The sequential trend is also positive: quarter on quarter revenue rose from USD 3,331.5m to USD 3,519.2m, or 5.6%. This suggests demand for the company's products is recovering after a weak fourth quarter of 2025, when revenue fell to USD 3,180.3m.
Unlike profit, revenue growth looks moderate and does not explain the margin jump. The main contribution to the improved financial result came not from higher sales volumes but from pricing and the cost structure.
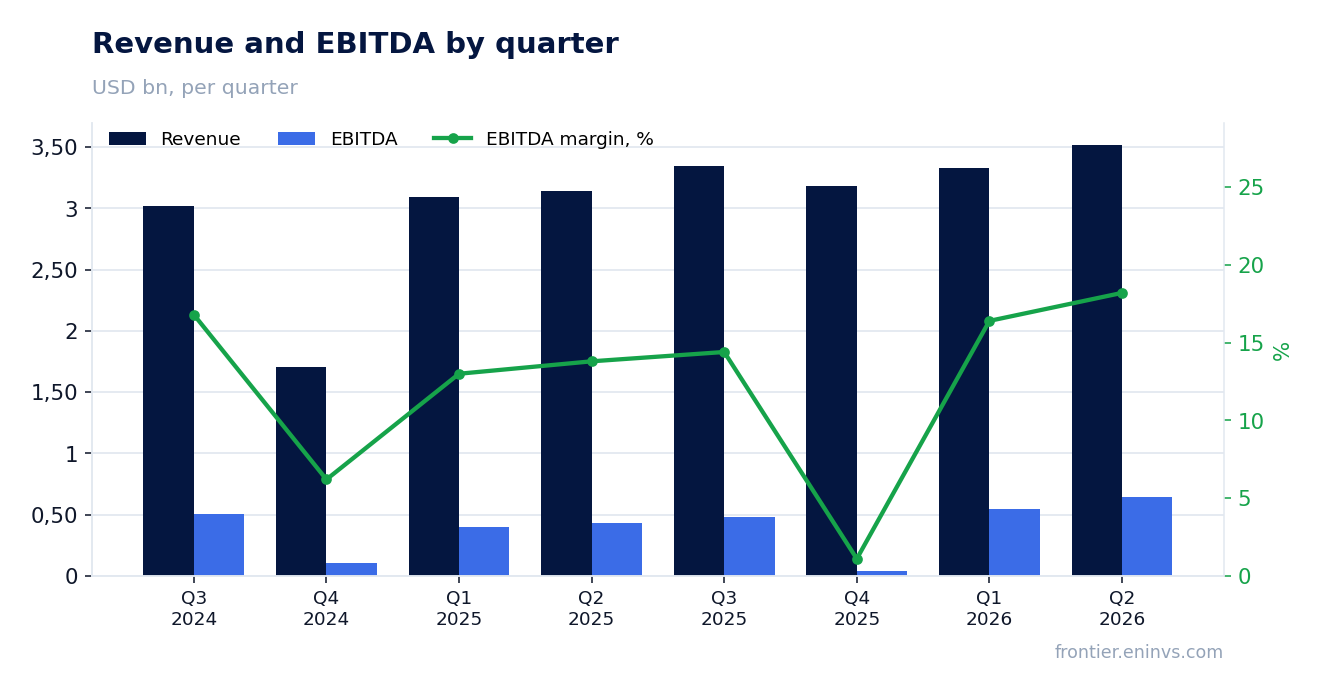
EBITDA added 47.5% and the margin climbed to 18.2% from 13.8% — the gain came entirely from margin, not volumes
EBITDA in the second quarter of 2026 was USD 640.6m, up 47.5% from a year earlier. The EBITDA margin rose to 18.2% from 13.8% in Q2 2025. The gap is explained by revenue growing only 12.0% while EBITDA grew nearly one and a half times faster.
Operating profit increased to USD 459.3m from USD 266.4m a year earlier. This means the improvement occurred at the operating expense level, not through one-off items below the operating line. The company does not disclose cost-line details, but the scale of margin improvement points to lower unit costs or favourable pricing.
For comparison: in the fourth quarter of 2025 EBITDA was only USD 36.6m and the operating loss was USD 138.4m. The current quarter is a recovery from the collapse at the end of last year, and the sustainability of that recovery is not yet confirmed.
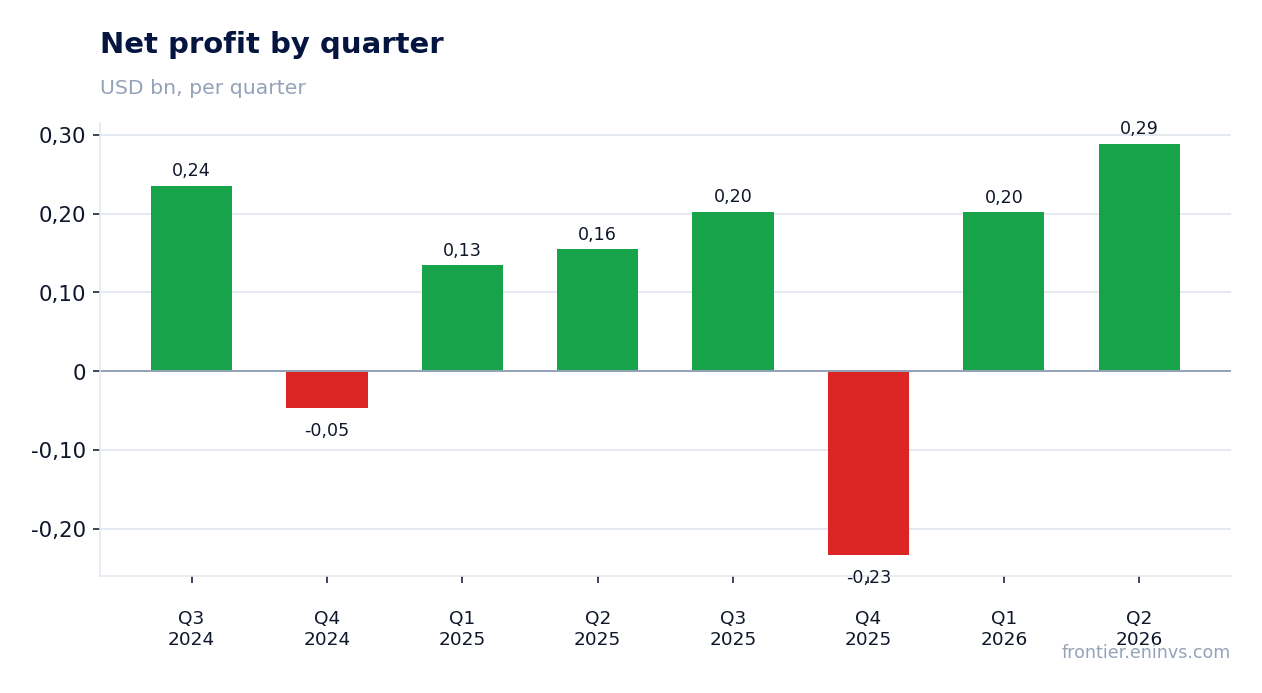
Net profit rose 86.2% to USD 288.7m, but was already USD 202.0m a quarter earlier — the trend is sequential, not one-off
Net profit in the second quarter of 2026 was USD 288.7m, up 86.2% from the second quarter of 2025. The net margin rose to 8.2% from 4.9%. However, it is important to look at the sequential trend: in the first quarter of 2026 profit was already USD 202.0m, so quarter-on-quarter growth was 42.9%.
This means the improvement is not a one-quarter event. The company has been consistently growing profit for two consecutive quarters after a loss in the fourth quarter of 2025. Nevertheless, the year-ago base in Q2 2025 was low at USD 155.1m, which amplifies the percentage growth.
Net profit over the trailing twelve months was USD 257.8m. This is below the quarterly figure, reflecting the impact of the loss-making fourth quarter of 2025 on the annual result.
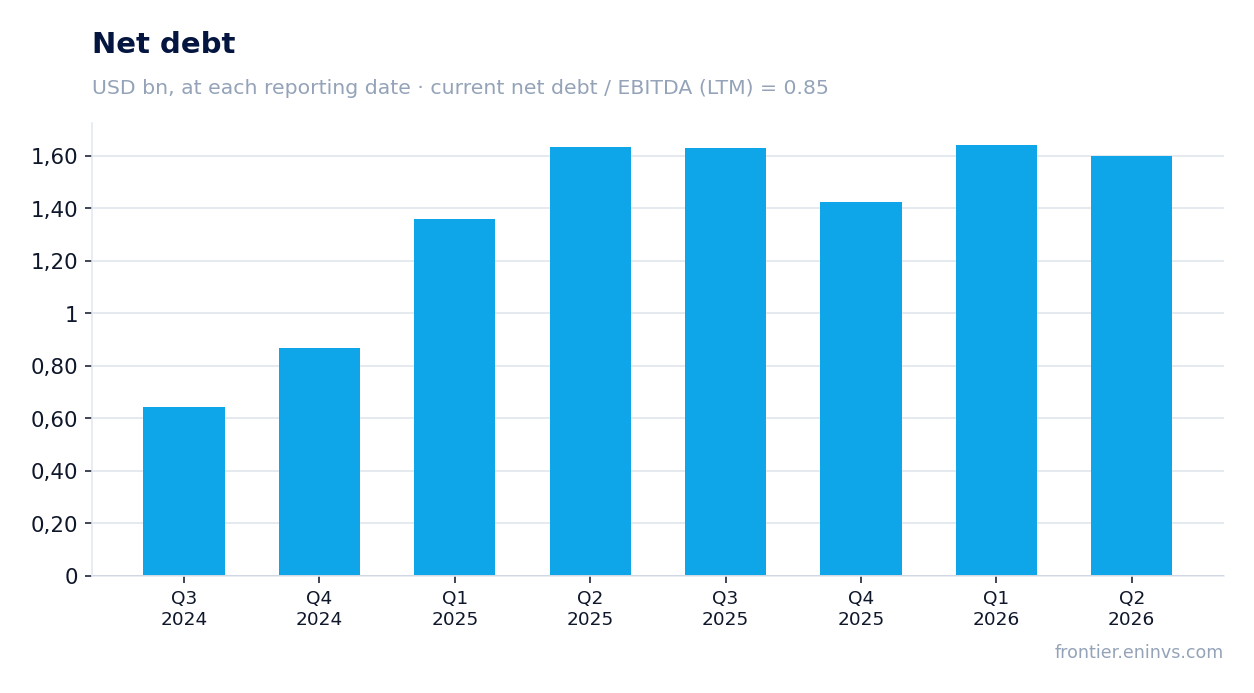
Leverage at 0.85x LTM EBITDA is moderate, but absolute net debt rose to USD 1,598.6m from USD 1,425.7m at end-2025
Gerdau's net debt at the end of the second quarter of 2026 was USD 1,598.6m. This is above the end-2025 level of USD 1,425.7m. The net debt to LTM EBITDA ratio stands at 0.85. This is a moderate burden that does not create immediate risks to financial stability.
The rise in absolute debt occurred alongside EBITDA growth, which kept the ratio at a comfortable level. However, the debt trend matters: since end-2024, when it was USD 867.6m, it has nearly doubled. The company is increasing leverage, likely financing investment and dividends.
Interest expenses are not disclosed in the provided data, but at the current debt level and market rates they could put noticeable pressure on net profit. This is one of the factors to watch in the next report.
Quarterly operating cash flow was USD 302.3m against capex of USD 217.1m — free cash flow stays positive but thin
Operating cash flow in the second quarter of 2026 was USD 302.3m, with capital expenditure of USD 217.1m. Free cash flow was therefore about USD 85.2m. This is a positive figure, but it is small relative to revenue and profit.
For comparison: in the first quarter of 2026 operating cash flow was USD 300.8m with capex of USD 240.2m, so free cash flow was even smaller at about USD 60.6m. The company generates cash flow, but a significant portion goes to maintaining and developing production capacity.
Over the trailing twelve months operating cash flow was USD 1,500.0m. This is a substantial sum that covers capital expenditure and allows dividend payments. However, with rising debt and volatile profit, the sustainability of cash flow remains a key question.
Trailing 12-month dividend yield of 2.0% sits below the policy rate and does not compensate for re-rating risk
Gerdau's trailing 12-month dividend yield is 2.0%. This is a modest level that does not compensate for the risks associated with profit volatility and rising debt. For comparison: in the fourth quarter of 2025 the company posted a loss, which casts doubt on the sustainability of the dividend base.
Our estimate for the current year's dividend assumes a conservative scenario: if 2026 net profit is around USD 1.0bn and the payout ratio remains at 30%, the dividend could be around USD 0.3 per share. This corresponds to a yield of about 2.5% at the current price. However, this estimate is sensitive to profit and could be cut if the EBITDA margin fails to hold at 18%.
The key risk to the dividend is a repeat of a loss-making quarter, as at the end of 2025. If profit turns negative again, the company may reduce payments. With the current yield at 2.0% and the policy rate above that level, the dividend is not a sufficient argument to buy the stock.
At P/E 38.4 and EV/EBITDA 6.74 the market already prices a durable margin recovery, while our model shows 70% downside to fair value
Gerdau shares trade at a trailing 12-month P/E of 38.4 and EV/EBITDA of 6.74. These are high multiples for a company with volatile profit and unstable margins. The market appears to expect that the profit recovery that began in the first quarter of 2026 will continue in subsequent periods.
Our model, based on current commodity prices and a target EV/EBITDA, puts fair value 70% below the current market capitalisation. This means that under a conservative scenario the stock is overvalued. The model is not a market consensus or a target price — it is our own calculation showing how much the current price depends on optimistic expectations.
For comparison: EV/EBITDA of 6.74 implies sustainable EBITDA of around USD 1.7bn. If EBITDA returns to 2025 levels, the multiple would be significantly higher, putting pressure on the share price. P/E of 38.4 also looks inflated against trailing 12-month profit of USD 257.8m.
Valuation on the latest reported figures
| Metric | Value |
|---|---|
| Market cap | 9.90 bn USD |
| P/E (LTM) | 38.4 |
| EV/EBITDA (LTM) | 6.7 |
| P/B | 1.01 |
| Net debt / EBITDA (LTM) | 0.85 |
| Operating cash flow (LTM) | 1.50 bn |
| ROE | 10.9% |
| Dividend yield (12m) | 2.0% |
Bottom line
The strong side of the report is the recovery in profit and margin: EBITDA rose 47.5% and net profit 86.2%. However, this growth rests on a low base and margin improvement, not on sustainable volume growth. Debt rose to USD 1,598.6m, free cash flow remains thin, and a 2.0% dividend yield does not compensate for the risks. At P/E 38.4 and EV/EBITDA 6.74 the market already prices an optimistic scenario, while our model shows 70% downside to fair value. The verdict is rather unattractive: a re-rating would require a sustainable margin above 18% and a reduction in leverage.
Open the company's financial profile GGB →
See also: market overview · valuation map · stock screeners