Gulfport Energy: revenue fell 27.8%, but cash remained – free cash flow holds at $6.4 million
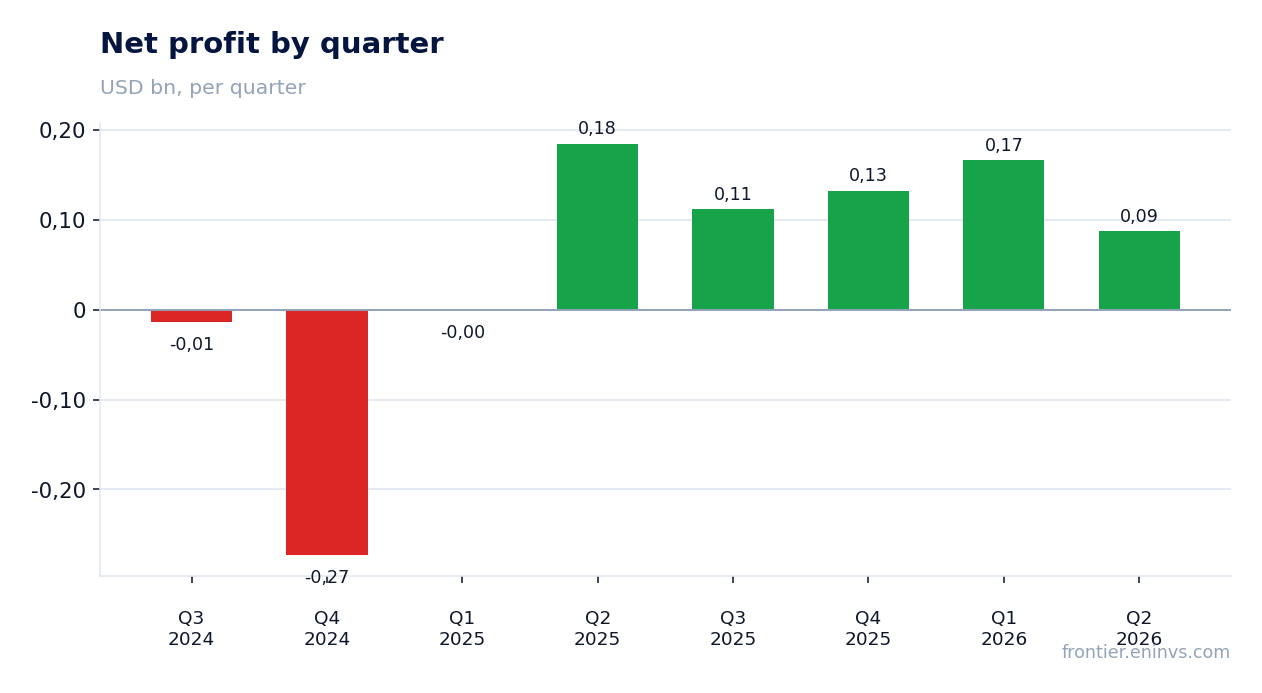
On August 3, Gulfport Energy released its second-quarter 2026 results. Revenue fell 27.8% year-on-year to $323.2 million, EBITDA declined 44.8% to $200.2 million, and net income dropped 52.8% to $87.1 million. The EBITDA margin compressed to 55.4% from 72.5% a year earlier, yet free cash flow remained positive at $6.4 million. With an EV/EBITDA multiple of 4.15 against its own three-year average of 3.75 and the portal model implying a 8% downside to fair value, the stock looks neutral: operating efficiency persists, but falling gas prices and rising debt limit upside.
Key takeaways
— Revenue fell 27.8% due to gas prices, not production volumes
— EBITDA margin compressed to 55.4% – almost all of the difference came from realised prices
— Free cash flow remained positive, but capex growth almost consumed it
— Debt rose to $921.3 million, with net debt/EBITDA LTM at 0.81
— No dividends are paid; all free liquidity goes to share buybacks
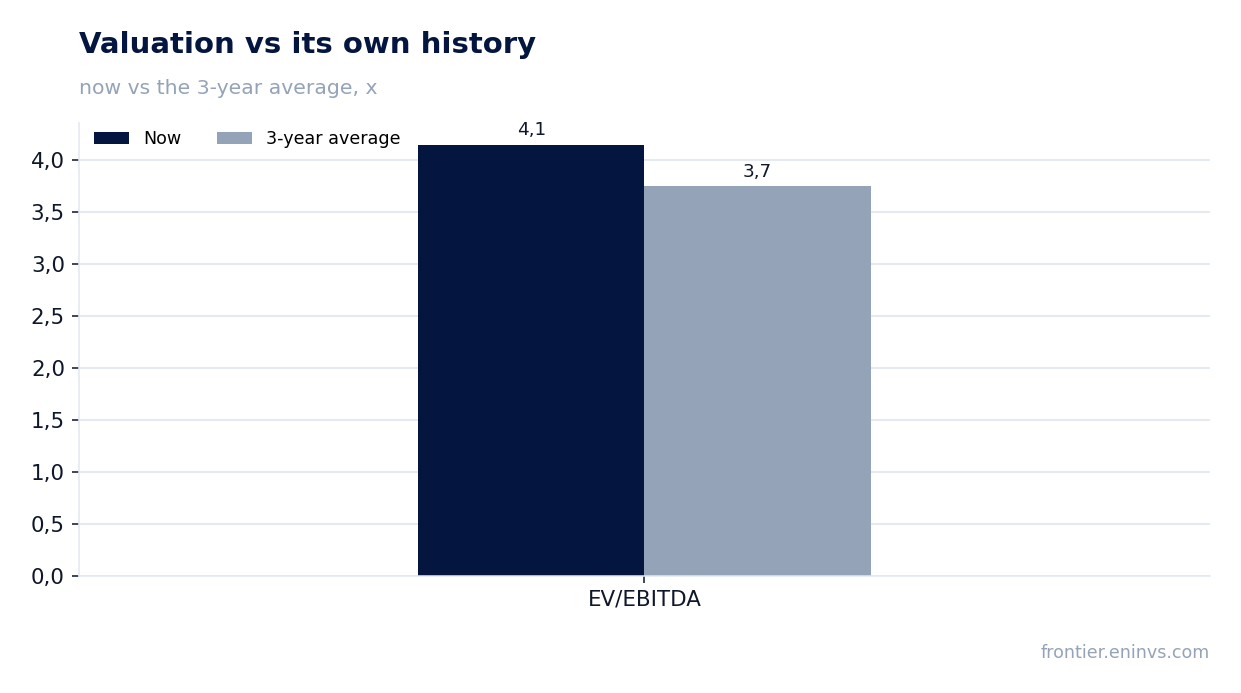
— Valuation: EV/EBITDA 4.15 versus its own three-year average of 3.75 – the stock trades above its history
Attractiveness
Key figures, USD bn
| Metric | Q2 2025 | Q2 2026 | Change |
|---|---|---|---|
| Revenue | 0.45 | 0.32 | -27.8% |
| EBITDA | 0.32 | 0.18 | -44.8% |
| Operating profit | 0.25 | 0.13 | -49.3% |
| Net profit | 0.18 | 0.09 | -52.8% |
| Operating cash flow | 0.23 | 0.15 | -35.2% |
| Capex | 0.14 | 0.17 | +20.9% |
| EBITDA margin | 72.5% | 55.4% | -17.1 pp |
| Net margin | 41.2% | 26.9% | -14.3 pp |
Revenue fell 27.8% due to gas prices, not production volumes
Revenue in the second quarter of 2026 was $323.2 million, down 27.8% year-on-year. Production in oil equivalent terms fell only 4.3% to 962.8 thousand barrels of oil equivalent per day. The main blow came from prices: the average realised gas price excluding hedges fell to $2.48 per thousand cubic feet from $2.97 a year earlier.
The decline in gas prices was partly offset by higher oil and NGL prices. The average oil price excluding hedges rose to $85.86 per barrel from $58.20, and NGL to $33.94 from $27.91. However, gas still dominates revenue, so the overall result was negative.
Gas production volumes declined only slightly – from 891 to 878 million cubic feet per day, mainly due to the SCOOP asset, where production fell 20%. The Utica Marcellus asset showed an almost flat result – 755.5 million cubic feet per day versus 736.4 million a year earlier.
EBITDA margin compressed to 55.4% – almost all of the difference came from realised prices
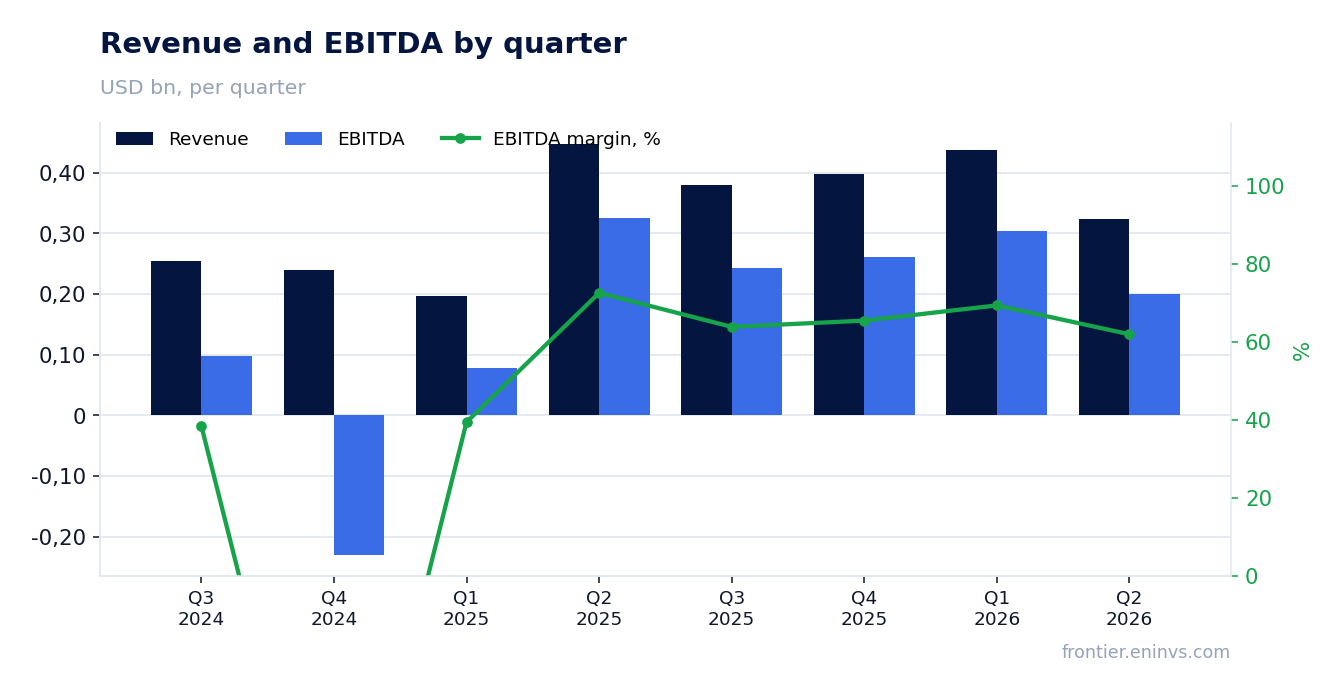
EBITDA in the second quarter of 2026 was $200.2 million, down 44.8% year-on-year. The EBITDA margin narrowed to 55.4% from 72.5% a year earlier. The main reason is the drop in revenue with relatively stable operating expenses.
Operating expenses declined only slightly: total operating costs were $196.2 million versus $196.8 million a year earlier. Within the structure, lease operating expenses rose to $19.8 million from $17.6 million, and transportation costs to $84.6 million from $86.5 million. Administrative expenses remained almost flat at $10.7 million.
Thus, the margin compression is almost entirely explained by lower realised prices, not by higher unit costs. This is important because it points to the company maintaining operating efficiency.
Free cash flow remained positive, but capex growth almost consumed it
Operating cash flow in the second quarter of 2026 was $149.9 million, down 35.2% year-on-year. Capital expenditures rose to $175.0 million from $144.8 million. As a result, adjusted free cash flow was only $6.4 million versus $64.6 million a year earlier.
The increase in capital expenditures is linked to a larger drilling programme: the company spent $40.3 million on acreage acquisitions under the 2026 programme, which targets up to $140 million of such investments by year-end. Excluding these discretionary costs, free cash flow would have been significantly higher.
Nevertheless, even with higher capex, the company remains capable of generating positive free cash flow, which is important for funding share buybacks.
Debt rose to $921.3 million, with net debt/EBITDA LTM at 0.81
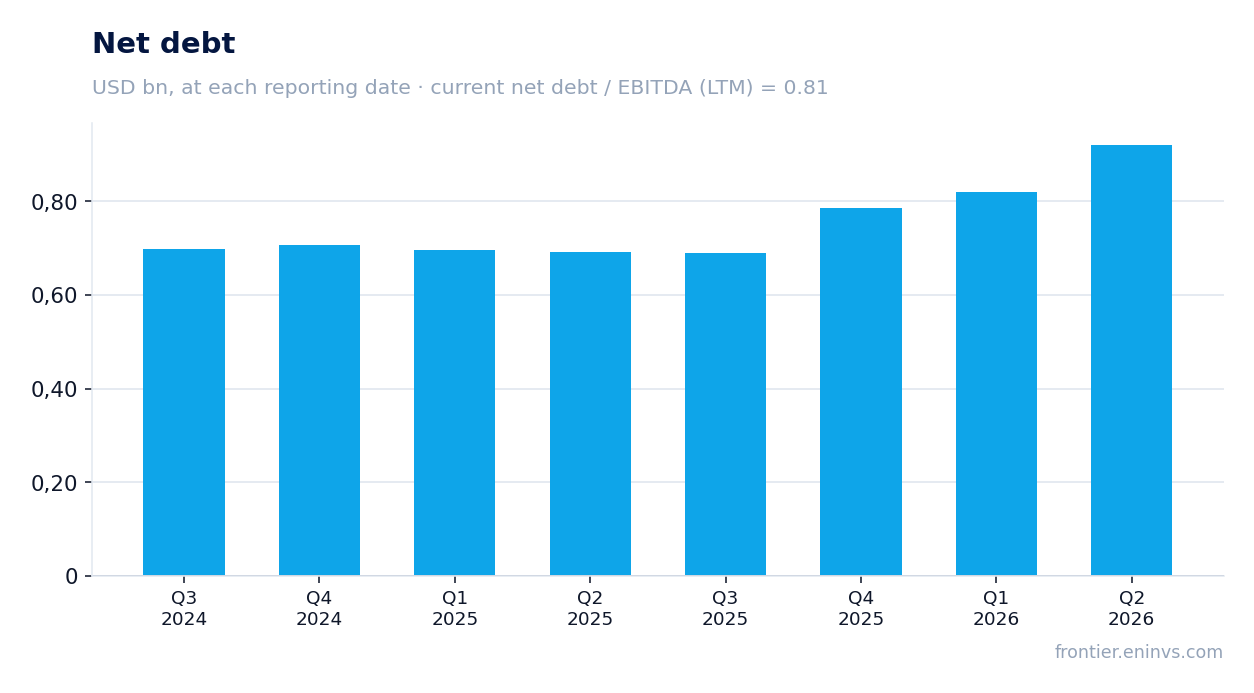
Net debt at the end of the second quarter of 2026 was $921.3 million, up $100.2 million since the start of the year. The net debt/EBITDA ratio for the trailing twelve months is 0.81 – a moderate level, but it has increased from previous periods.
The rise in debt is partly linked to share buybacks: in the first half, the company spent $242.3 million on these purposes, including $17.2 million on purchases from a related party. The company also increased capital expenditures, which required additional funding.
Interest expenses rose to $15.8 million per quarter from $13.7 million a year earlier. At the current level of debt and EBITDA, the company maintains a comfortable cushion for servicing its obligations.
No dividends are paid; all free liquidity goes to share buybacks
Gulfport Energy does not pay dividends. All free liquidity is directed to share buybacks: in the first half of 2026, the company spent $242.3 million on these purposes, including $17.2 million on purchases from a related party. The number of shares outstanding decreased to 17.7 million from 18.8 million at the end of 2025.
Buybacks are funded from operating cash flow and partly from debt. At the current share price and generated free cash flow, the company can continue buybacks, but their scale may be limited if gas prices remain low.
For income-oriented investors, this stock is not suitable. However, the reduction in share count supports earnings per share: in the first half of 2026, diluted earnings per share were $13.82 versus $9.01 a year earlier.
Valuation: EV/EBITDA 4.15 versus its own three-year average of 3.75 – the stock trades above its history
The current EV/EBITDA multiple for the trailing twelve months is 4.15, above its own three-year average of 3.75. This means the stock trades at a premium to its historical valuation, despite the decline in revenue and EBITDA.
The P/E LTM multiple is 6.55, which may also indicate a relatively low valuation by earnings, but trailing twelve-month earnings include one-off factors, notably non-cash derivative gains. Return on equity (ROE) is 19.2%.
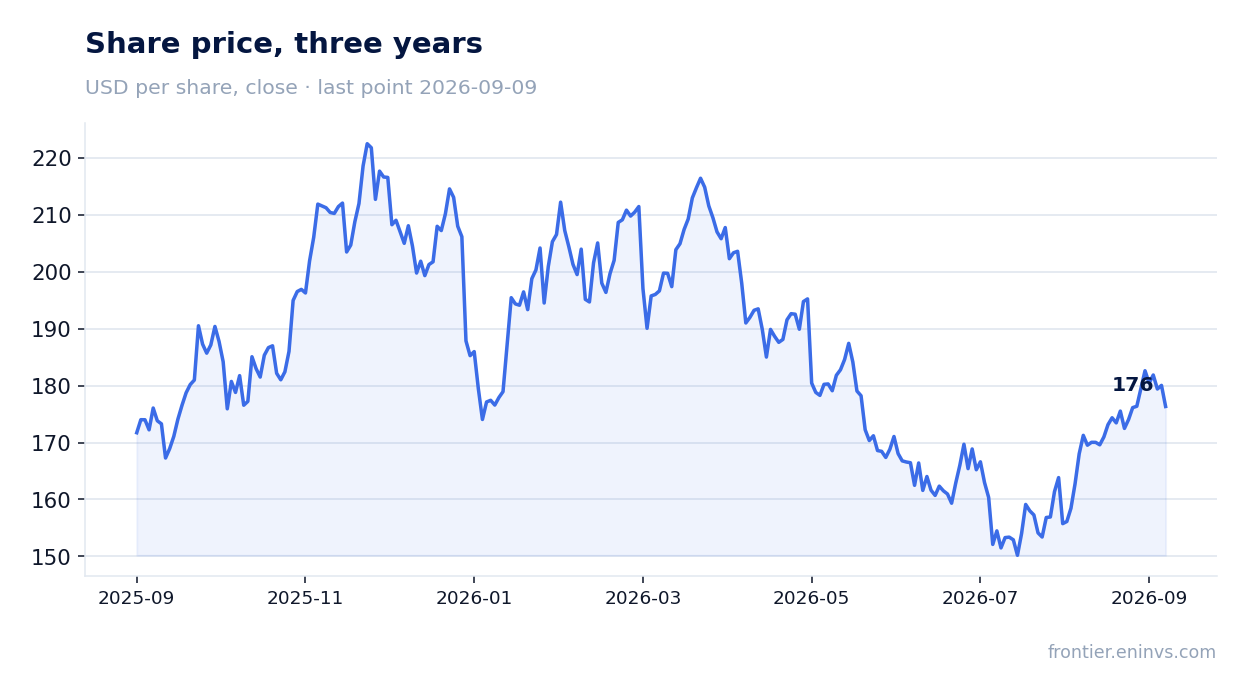
According to the portal model, which re-prices EBITDA at current commodity prices at the target EV/EBITDA, the fair value implies a 8% downside to the current price. This is our own estimate, not a market consensus.
Valuation on the latest reported figures
| Metric | Value |
|---|---|
| Market cap | 3.25 bn USD |
| P/E (LTM) | 6.5 |
| EV/EBITDA (LTM) | 4.1 |
| P/B | 1.77 |
| Net debt / EBITDA (LTM) | 0.81 |
| Operating cash flow (LTM) | 0.80 bn |
| ROE | 19.2% |
| EV/EBITDA, 3-year average | 3.7 |
Bottom line
The report's strength remains the ability to generate positive free cash flow even with revenue falling 27.8% and EBITDA margin compressing to 55.4%. However, this flow is nearly exhausted: $6.4 million is a minimal level, and rising capex and buybacks are partly funded by debt, which rose to $921.3 million. The valuation above its own three-year history (EV/EBITDA 4.15 versus 3.75) and the 8% downside from the portal model do not inspire optimism. The question for a holder now is whether the company can keep free cash flow positive if gas prices fall further, and whether buybacks will have to be scaled back.
Open the company's financial profile GPOR →
See also: market overview · valuation map · stock screeners