Green Thumb Industries: revenue grows for a fourth straight quarter, but EBITDA falls 23% on one-off licensing fees and higher personnel costs

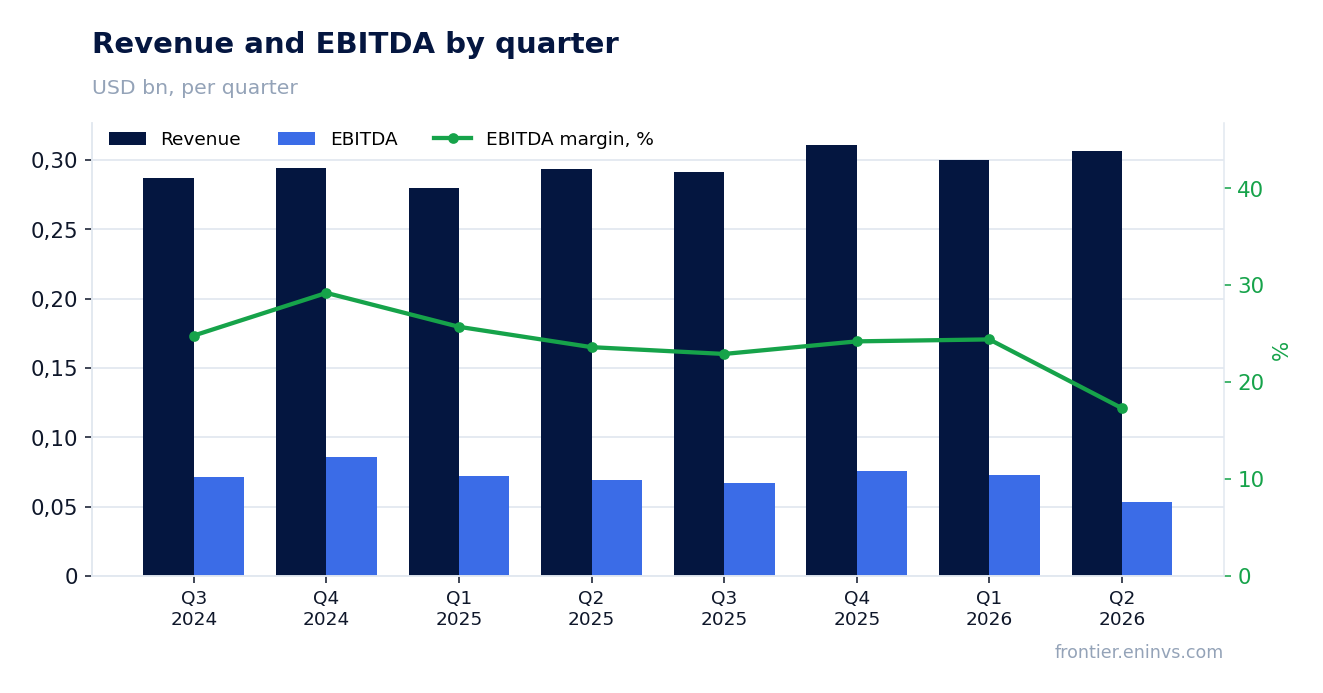
On August 4, Green Thumb Industries reported second-quarter 2026 results. Revenue rose 4.6% year over year to $306.7 million, net income was $4.9 million versus a loss a year earlier, but EBITDA fell 23.1% to $53.1 million, while normalized EBITDA was nearly flat at $84.3 million. At the current price the stock looks rather attractive: EV/EBITDA LTM of 7.7x is below its three-year average, and the portal's model points to about 18% upside.
Key takeaways
— Revenue grows for a fourth straight quarter, but growth slowed to 4.6% on pricing pressure
— EBITDA fell 23.1% due to one-off licensing fees of $15.8 million and higher personnel costs
— Normalized EBITDA was nearly flat, with margin down to 27.5% from 28.2%
— Net income of $4.9 million includes a one-off tax benefit from the end of 280E
— Leverage is moderate: net debt of $277 million, net debt/EBITDA LTM of 0.99x
— The company repurchased $48.3 million of shares, supporting the price but reducing cash flow
— EV/EBITDA LTM of 7.7x is below historical levels, and the portal's model implies 18% upside
Attractiveness
Key figures, USD bn
| Metric | Q2 2025 | Q2 2026 | Change |
|---|---|---|---|
| Revenue | 0.29 | 0.31 | +4.6% |
| EBITDA | 0.07 | 0.05 | -23.1% |
| Operating profit | 0.04 | 0.02 | -49.4% |
| Net profit | -0.00 | 0.00 | to profit |
| Operating cash flow | 0.06 | 0.03 | -48.6% |
| Capex | 0.02 | 0.02 | +6.3% |
| EBITDA margin | 23.6% | 17.3% | -6.3 pp |
| Net margin | -0.2% | 1.6% | +1.8 pp |
Revenue grows for a fourth straight quarter, but growth slowed to 4.6% on pricing pressure
In the second quarter of 2026, Green Thumb Industries' revenue reached $306.7 million, up 4.6% year over year. This is the fourth consecutive quarter of annual growth, but the pace slowed: growth was 7.4% in Q1 2026 and 5.7% in Q4 2025.
The main contributors were retail sales in Minnesota, where adult-use sales began on September 17, 2025, as well as growth in Connecticut, Florida, and Ohio. Retail revenue rose 3.6% year over year, while consumer packaged goods revenue increased 3.7%. However, comparable sales at stores open at least 12 months fell 1.1% on a base of 103 stores.
Pricing pressure and increased competition are holding back growth. The company notes that consumers continue to choose cannabis, but prices are declining in key states. Adult-use sales in Virginia are expected to launch on July 1, 2027, and the company holds a conditional license in Texas – these markets could become drivers in the future.
EBITDA fell 23.1% due to one-off licensing fees of $15.8 million and higher personnel costs
EBITDA in Q2 2026 was $53.1 million, down 23.1% from a year earlier. The main reason is one-off licensing fees of $15.8 million related to the RYTHM brand, recorded in cost of goods sold. Excluding these fees, EBITDA would have been significantly higher.
The second factor is higher personnel costs. Total SG&A expenses rose to $117.9 million, or 38.4% of revenue, from $106.8 million, or 36.4% of revenue, a year earlier. The company attributes this to planned changes in its compensation structure aimed at retaining employees.
Gross margin fell to 45.0% from 49.9% a year earlier. Besides licensing fees, pricing pressure also weighed on it. As a result, operating income dropped to $20.0 million from $39.4 million a year earlier.
Normalized EBITDA was nearly flat, with margin down to 27.5% from 28.2%
Normalized EBITDA, which excludes licensing fees, non-cash stock-based compensation, and other non-operating adjustments, was $84.3 million, or 27.5% of revenue, versus $82.7 million, or 28.2% of revenue, a year earlier. Thus, excluding one-off factors, the company showed a slight increase in absolute terms, but margin declined slightly.
The 0.7 percentage point margin decline is due to higher personnel costs, which the company calls a deliberate decision to retain key employees. This factor is likely to persist in coming quarters, limiting margin growth.
Normalized EBITDA is an important metric for assessing operating efficiency, as it is cleared of one-off effects. Its stability indicates that the business continues to generate profit despite pricing pressure.
Net income of $4.9 million includes a one-off tax benefit from the end of 280E
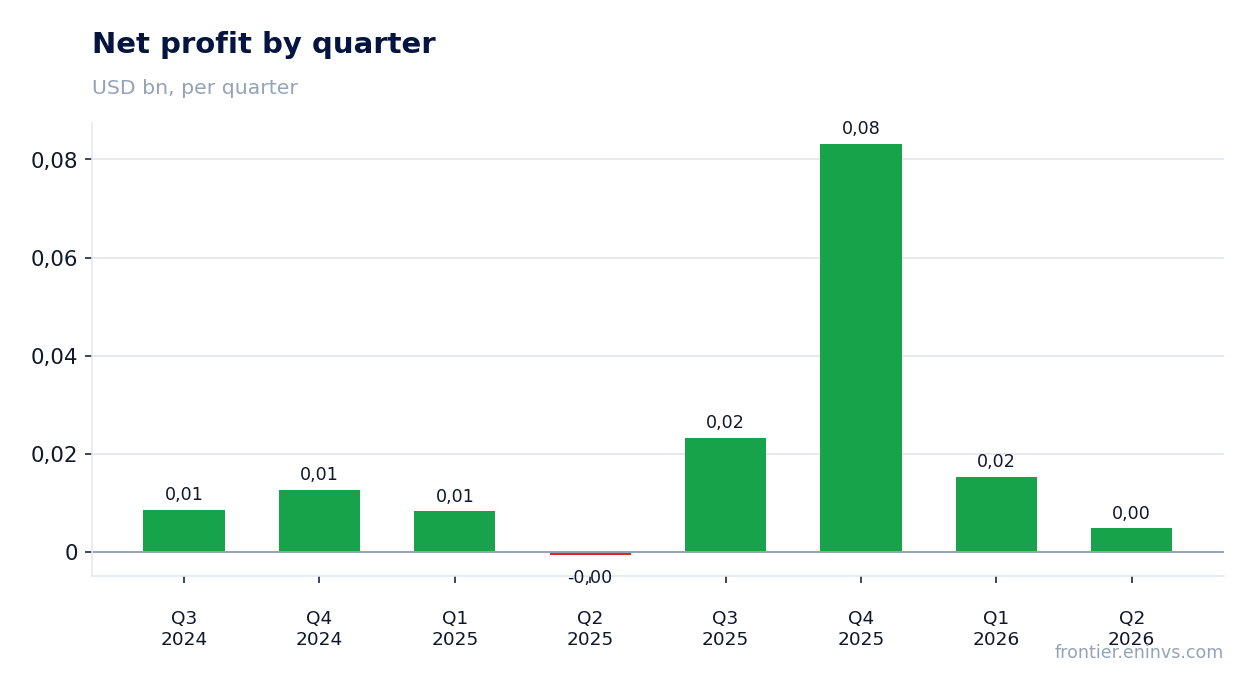
Net income in Q2 2026 was $4.9 million, or $0.02 per share, versus a loss of $0.6 million a year earlier. However, this result includes a one-off tax effect: income tax expense fell to $12.5 million from $21.6 million a year earlier.
The lower tax burden is due to the Department of Justice's decision to reclassify medical cannabis to Schedule III, which ended the application of Section 280E of the Internal Revenue Code for part of the business. This decision took effect on April 28, 2026. Without this effect, net income would have been lower.
Operating income fell to $20.0 million from $39.4 million a year earlier, reflecting margin pressure. Thus, the increase in net income is mainly due to the tax factor, not improved operations.
Leverage is moderate: net debt of $277 million, net debt/EBITDA LTM of 0.99x
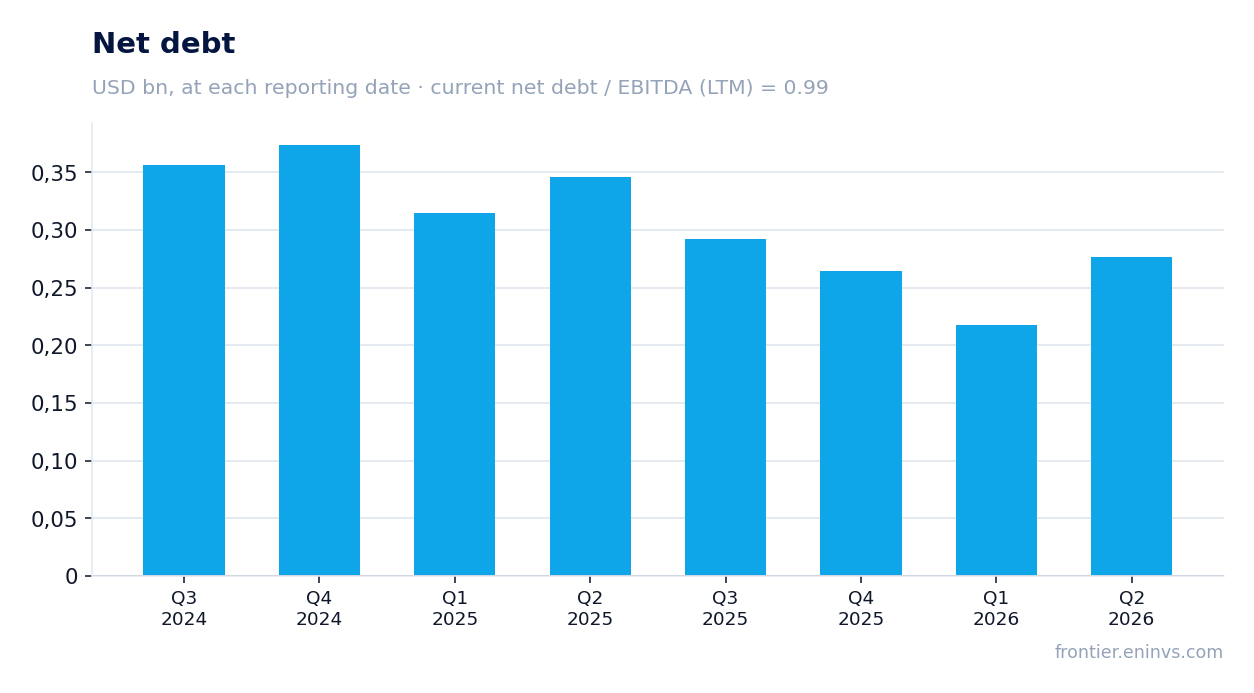
Net debt at the end of Q2 2026 was $277 million, up $59 million from the previous reporting date ($218 million as of March 31, 2026). The net debt/EBITDA ratio for the trailing twelve months is 0.99x, a moderate level.
Total debt stands at $283 million, including current and long-term portions. The company holds significant cash of $283.6 million at quarter-end, roughly equal to total debt. This provides financial stability.
Interest expense for the quarter was $6.1 million, while interest income was $4.3 million. Net interest expense is small relative to EBITDA, reducing the debt burden. The company does not disclose a debt repayment schedule, but the current debt level is not a concern.
The company repurchased $48.3 million of shares, supporting the price but reducing cash flow
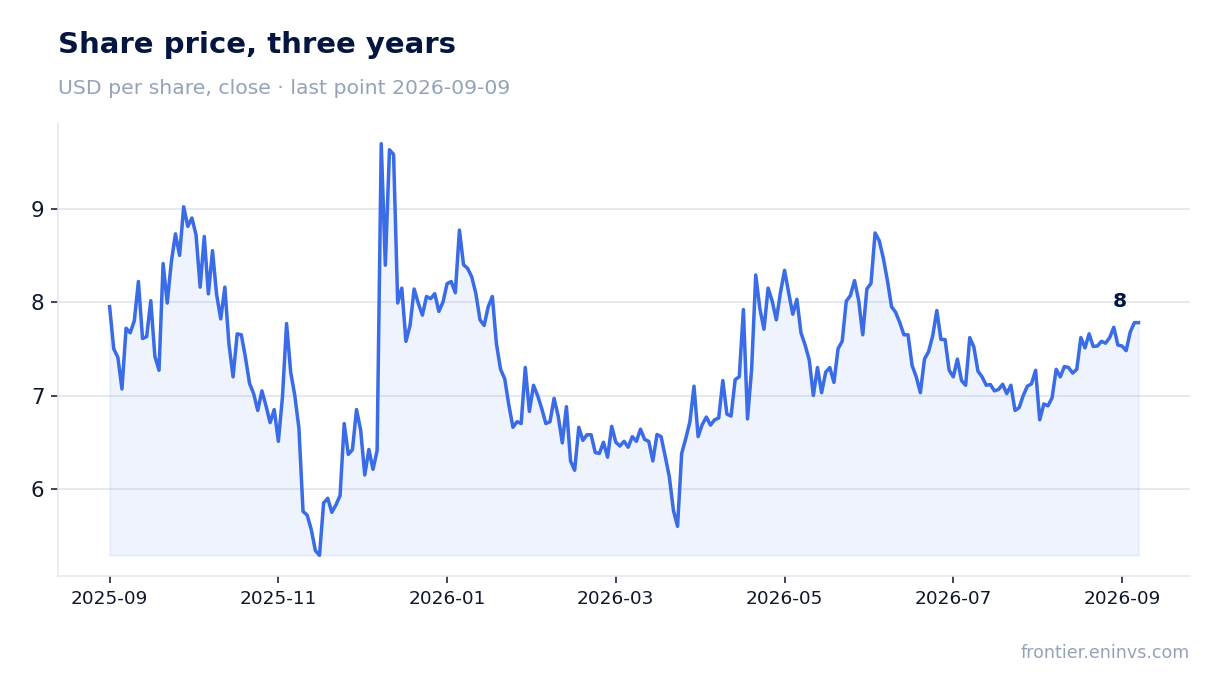
During Q2 2026, Green Thumb Industries repurchased about 7.9 million subordinate voting shares for $48.3 million at an average price of $6.11 per share. Since the program's inception, 29.5 million shares have been repurchased for $203.4 million at an average price of $6.90. The remaining repurchase authority is $62.3 million through September 22, 2026.
Operating cash flow for the quarter was $29.0 million, significantly lower than in previous quarters (e.g., $75.8 million in Q1 2026). The decline is due to higher expenses and tax payments. Capital expenditures were $20.2 million, so free cash flow was modest.
Share repurchases support the price and reduce the number of shares outstanding, but reduce liquidity. At the current cash flow level, further repurchases may be limited. The company is also investing in new store openings, such as RISE Dispensary Hanover in Pennsylvania, opened on July 31, 2026.
EV/EBITDA LTM of 7.7x is below historical levels, and the portal's model implies 18% upside
Currently, EV/EBITDA for the trailing twelve months is 7.7x, and P/E LTM is 14.1x. For comparison, the company historically traded at higher multiples, making the current valuation attractive. Market capitalization is $1.79 billion.
The portal's model, which re-prices EBITDA at current commodity prices at the target EV/EBITDA, indicates upside to fair value of 18%. This is our own estimate, not a market consensus.
Since the report's release, the stock has risen 9.2%, and on the release day it gained 2.0%. The market reacted positively to the results despite the EBITDA decline. However, further growth requires improved operating efficiency and reduced pricing pressure.
Valuation on the latest reported figures
| Metric | Value |
|---|---|
| Market cap | 1.79 bn USD |
| P/E (LTM) | 14.1 |
| EV/EBITDA (LTM) | 7.7 |
| P/B | 0.94 |
| Net debt / EBITDA (LTM) | 0.99 |
| Operating cash flow (LTM) | 0.29 bn |
| ROE | 1.0% |
Bottom line
Green Thumb Industries showed revenue growth for a fourth consecutive quarter, but the pace slowed to 4.6%, and EBITDA fell 23.1% due to one-off licensing fees and higher personnel costs. Normalized EBITDA was nearly flat, and net income rose thanks to the tax effect from the end of 280E. Leverage is moderate, and the EV/EBITDA LTM of 7.7x is below historical levels. The portal's model indicates 18% upside, making the stock attractive for investors willing to accept the risks of pricing pressure and potentially sustained high expenses.
Open the company's financial profile GTBIF →
See also: market overview · valuation map · stock screeners