Warrior Met Coal: profit up 15.6x, but volumes from Blue Creek, not price, drove revenue
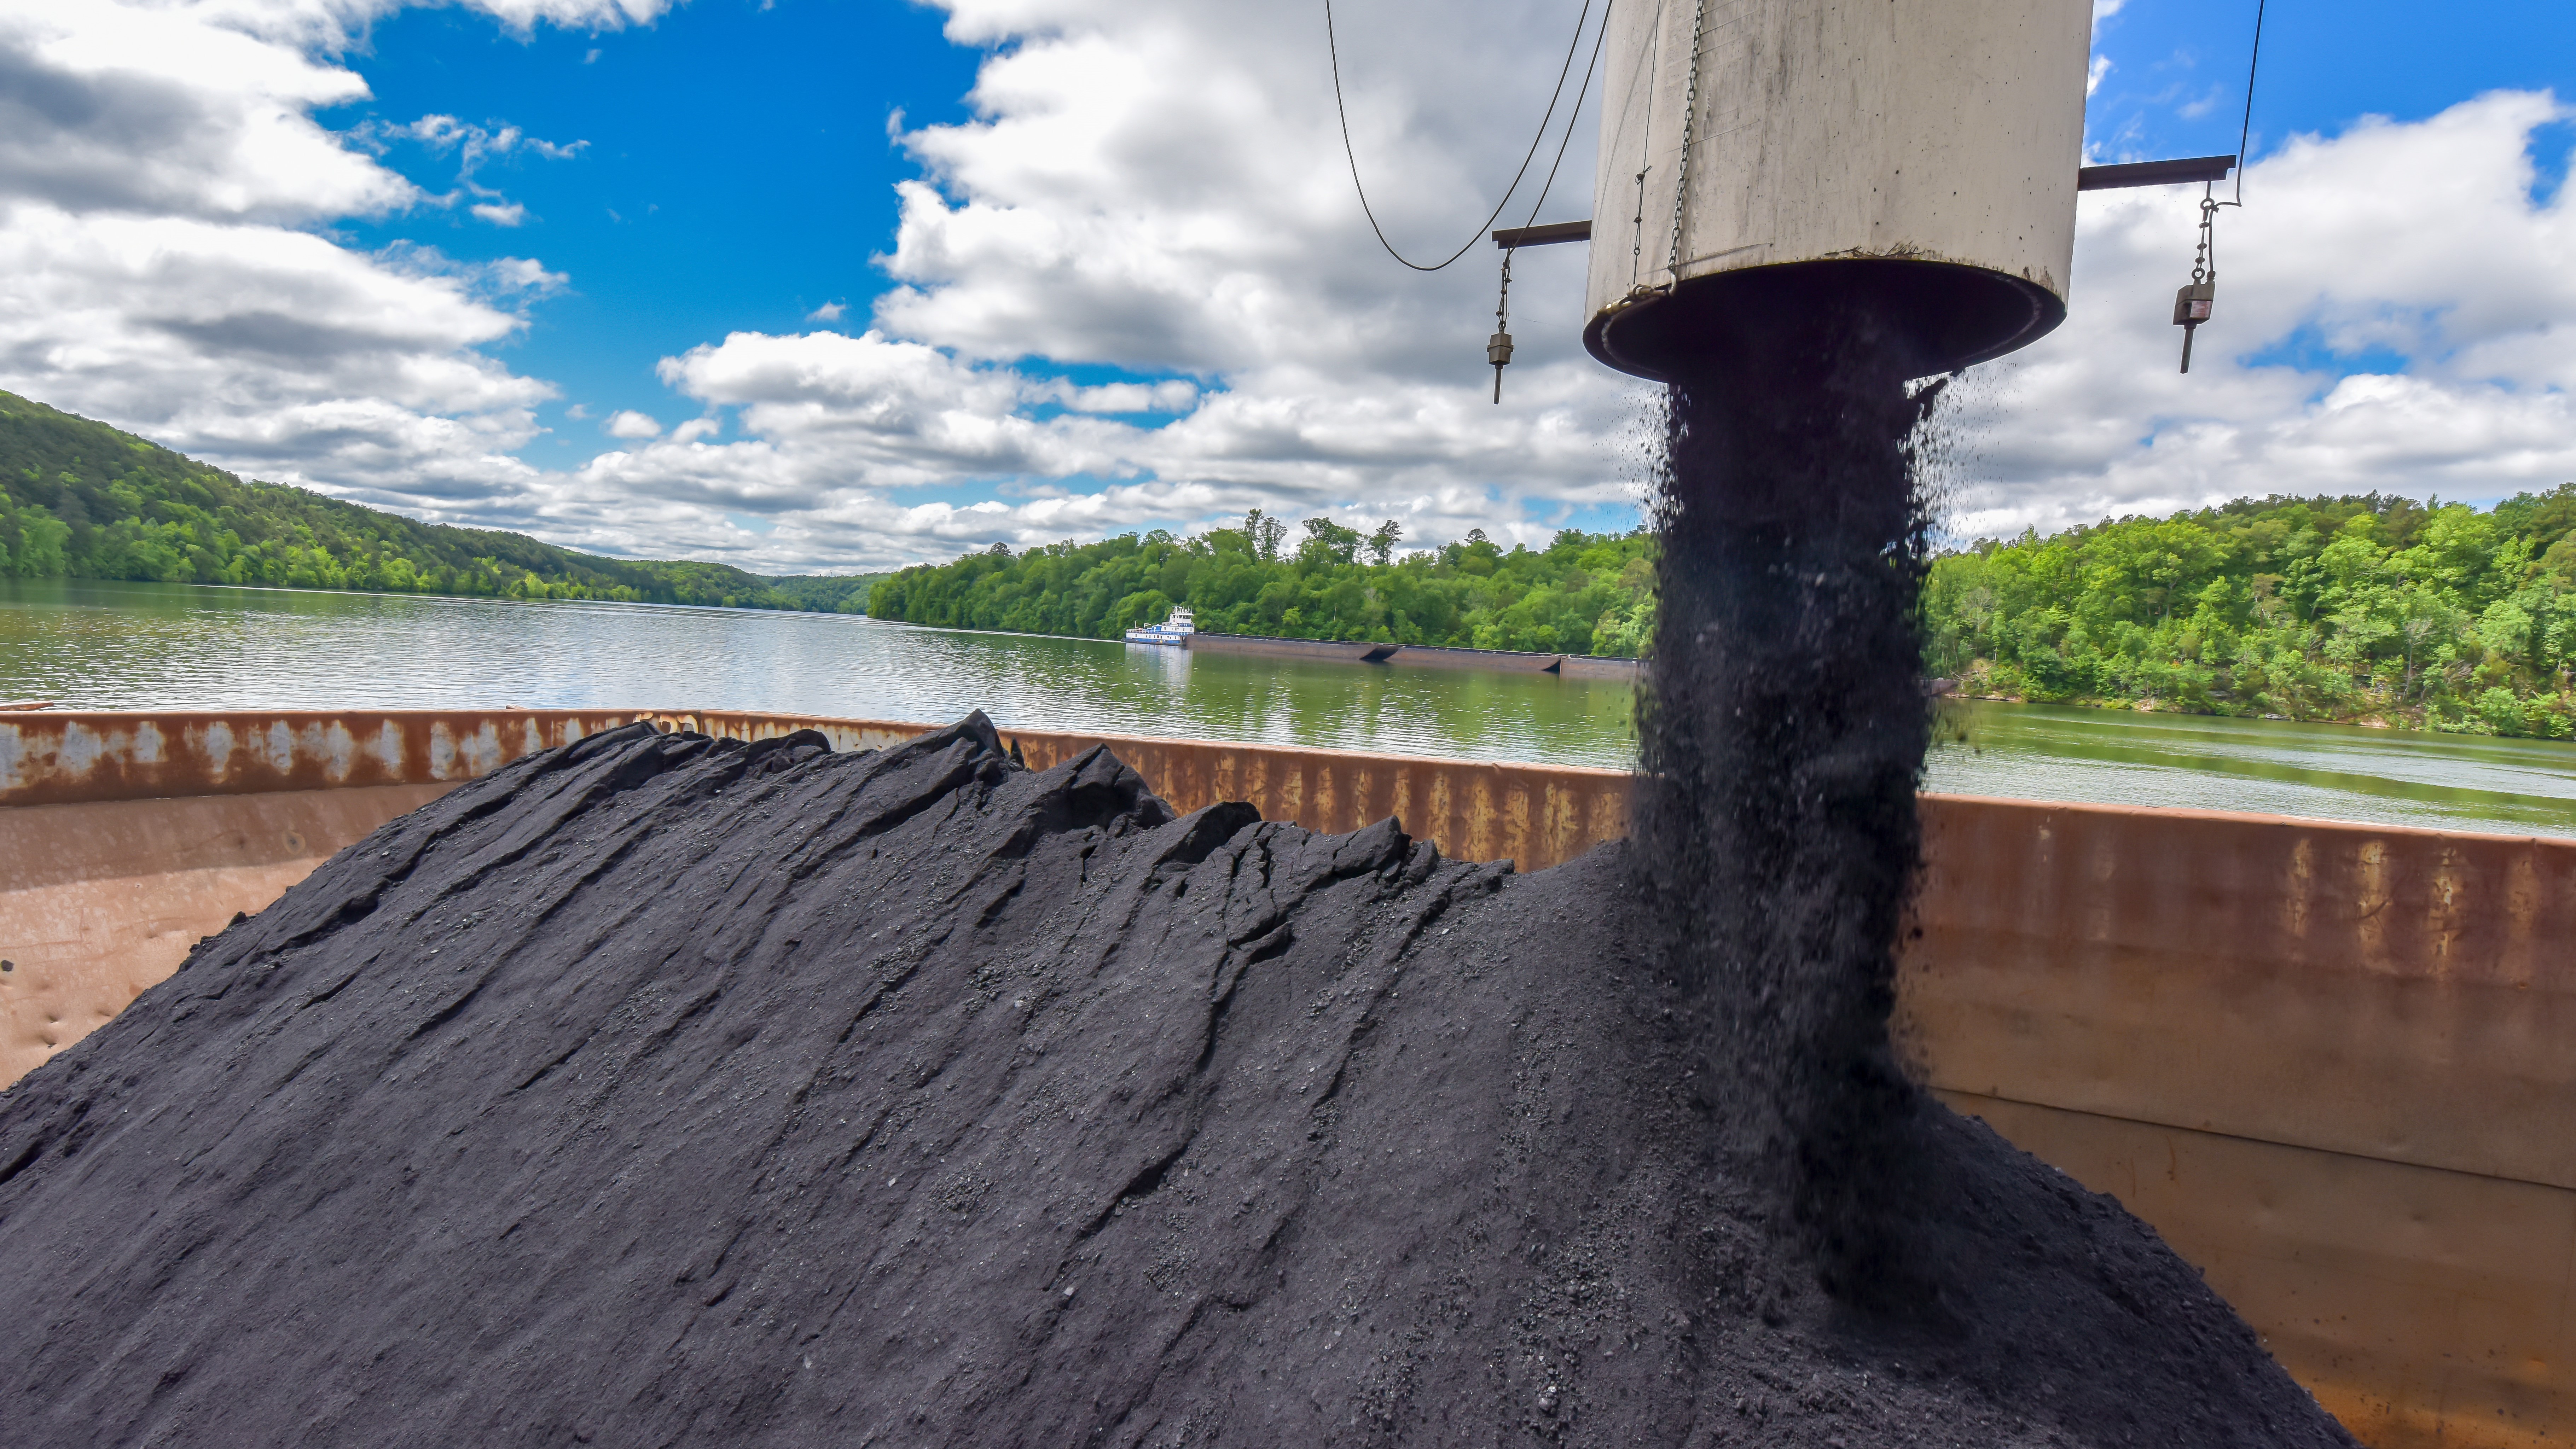
On August 5, Warrior Met Coal reported second-quarter 2026 results. Revenue rose 71.3% year over year to $509.7 million, adjusted EBITDA jumped 207.8% to $152.8 million, and net income increased 15.6x to $87.4 million. The EBITDA margin expanded to 30.8% from 17.1%, while free cash flow reached $103.4 million versus negative $56.7 million a year earlier. The stock trades above its own history on EV/EBITDA and the portal model sees no upside, so at the current price the shares look neutral.
Key takeaways
— Revenue rose 71.3% year over year, but almost all of the increase came from Blue Creek volumes, not price
— EBITDA margin expanded to 30.8% thanks to a 9% drop in unit costs and the 45X credit
— Net income of $87.4 million includes one-off items; without them the result would be more modest
— Free cash flow of $103.4 million became possible after the Blue Creek construction phase ended
— The $0.08 per share dividend remains symbolic against the profit growth
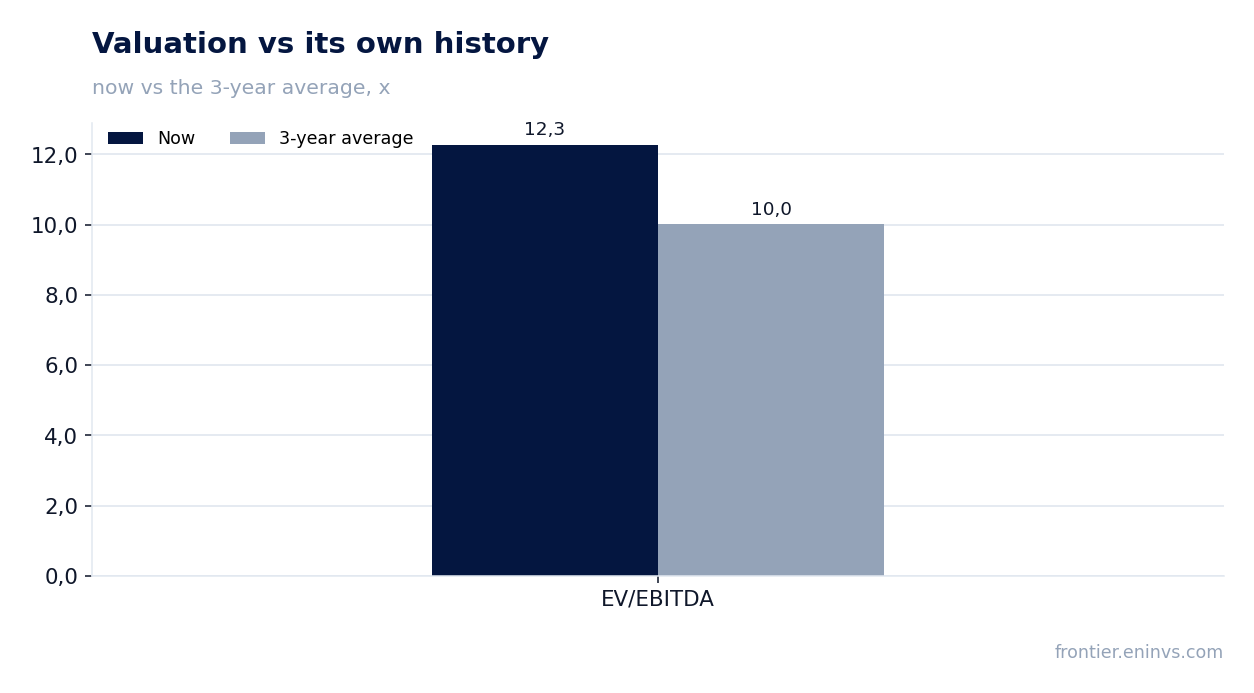
— EV/EBITDA of 12.3 is above the three-year average of 10.0, and the portal model offers no upside
Attractiveness
Key figures, USD bn
| Metric | Q2 2025 | Q2 2026 | Change |
|---|---|---|---|
| Revenue | 0.30 | 0.51 | +71.3% |
| EBITDA | 0.05 | 0.16 | +207.8% |
| Operating profit | 0.01 | 0.09 | +1123.9% |
| Net profit | 0.01 | 0.09 | +1459.6% |
| Operating cash flow | 0.04 | 0.13 | +252.4% |
| Capex | 0.09 | 0.03 | -69.3% |
| EBITDA margin | 17.1% | 30.8% | +13.7 pp |
| Net margin | 1.9% | 17.2% | +15.3 pp |
Revenue rose 71.3% year over year, but almost all of the increase came from Blue Creek volumes, not price
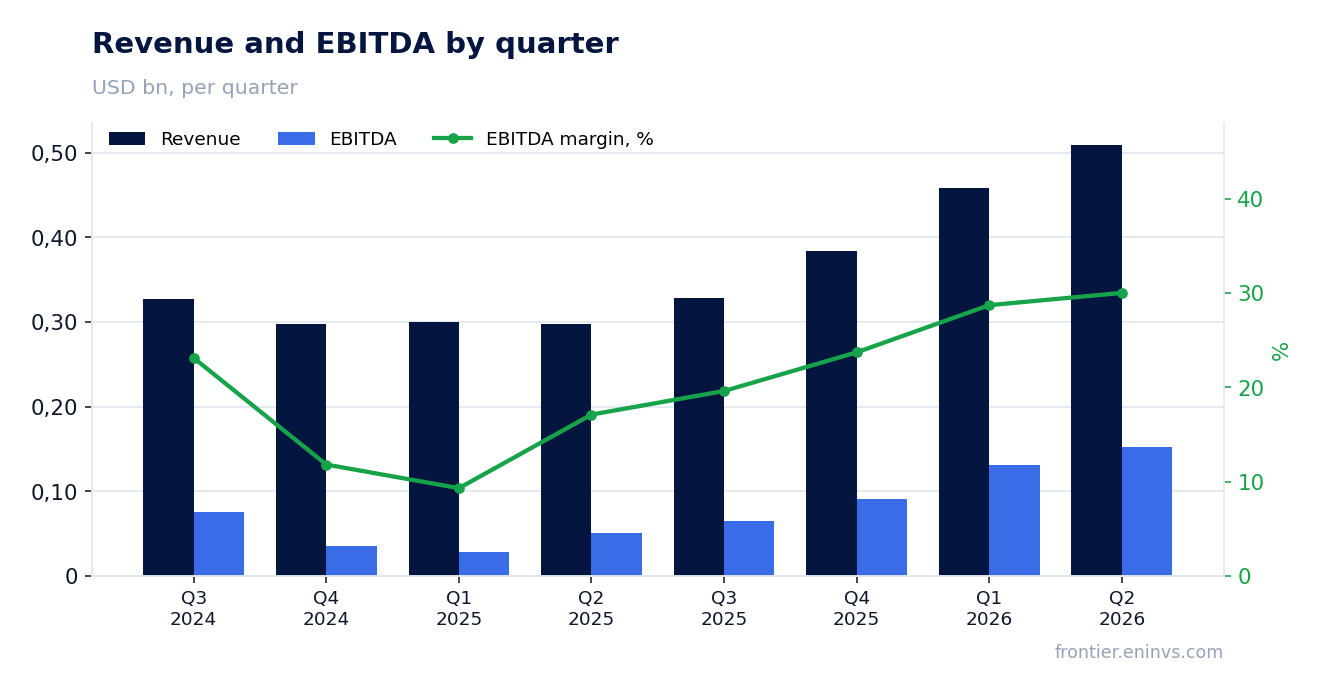
Revenue in the second quarter of 2026 reached $509.7 million, up 71.3% year over year. This growth was driven by record sales volumes of 3.7 million short tons, 65% more than in the second quarter of 2025. The average selling price rose only 6% to $137.82 per ton. So almost the entire revenue increase came from volumes, not pricing.
The main contribution to volumes came from the launch of Blue Creek. Sales of met coal from this asset began in late 2025, and they have now reached design capacity. The company notes that customers responded positively to the new product, which allowed it to raise full-year sales volume guidance by 0.5 million tons to 13.0–14.0 million tons.
The pricing picture is less rosy. The average selling price was only 66% of the Platts Premium Low Vol FOB Australia index, down from 80% a year earlier. This is due to a higher share of high-vol A coal in the sales mix, which is sold mainly to the Asia-Pacific region with high freight costs. So the company is selling more, but at a relatively lower price versus the benchmark.
Nevertheless, even with a lower relative price, the absolute price rose, and volumes grew significantly. This confirms that Blue Creek can generate revenue even in imperfect market conditions. The question is whether such volume growth will continue once the low-base effect fades.
EBITDA margin expanded to 30.8% thanks to a 9% drop in unit costs and the 45X credit
Adjusted EBITDA in the second quarter of 2026 was $152.8 million, up 207.8% year over year. The EBITDA margin rose to 30.8% from 17.1% a year earlier. This margin expansion was driven not only by higher revenue but also by lower unit costs.
Cash cost of sales (FOB port) per ton fell 9% to $92.53 from $101.17 a year earlier. This was due to the inherently lower cost structure of Blue Creek and the benefit from the Section 45X Advanced Manufacturing Production Tax Credit. A higher share of Blue Creek in the sales mix, where costs are lower, also helped.
However, total cost of sales rose to $340.0 million, or 68% of revenue, due to a 65% increase in sales volumes. So the company spends more in absolute terms but less per ton. This is a classic scale effect that drove the margin expansion.
Cash margin per ton rose to $45.29 from $28.84 a year earlier. This is a key efficiency metric for a coal company, and its growth shows that Blue Creek is genuinely improving the economics of the business. The question is how sustainable this level is amid coal price fluctuations.
Net income of $87.4 million includes one-off items; without them the result would be more modest
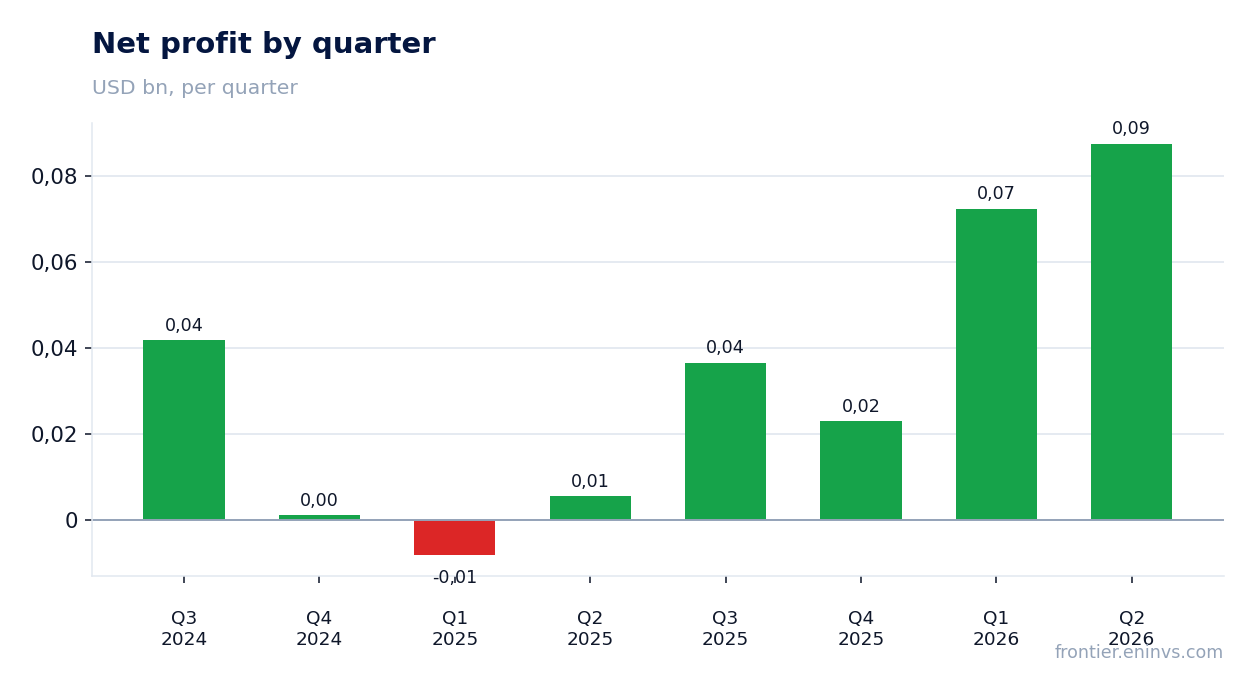
Net income in the second quarter of 2026 was $87.4 million, or $1.65 per share, versus $5.6 million a year earlier. The 15.6x growth looks impressive, but it is important to understand that the reporting period included one-off items that boosted the result.
In particular, SG&A expenses included a gain of $2.4 million related to recoveries from the Walter Energy bankruptcy proceedings. The company also benefited from the 45X tax credit, which reduced cash costs. These items are not recurring and may not repeat in the next quarter.
Operating income rose to $94.5 million from $7.7 million a year earlier. Income tax expense was only $3.7 million on pre-tax income of $91.1 million, an effective rate of about 4%. This is a very low level, which could also be due to one-off tax effects.
Thus, underlying profit, adjusted for one-off items, is likely lower than reported. Nevertheless, even after adjusting for these factors, the result is significantly better than last year, indicating a fundamental improvement in the business.
Free cash flow of $103.4 million became possible after the Blue Creek construction phase ended
Operating cash flow in the second quarter of 2026 was $132.3 million versus $37.5 million a year earlier. Free cash flow reached $103.4 million versus negative $56.7 million a year earlier. This is a turnaround from burning cash to generating it.
The key factor was a sharp reduction in capital expenditures. A year earlier, capex and mine development costs were $94.3 million; now they are only $18.3 million. The company has completed the construction phase of Blue Creek and moved to the operational phase, freeing up significant funds.
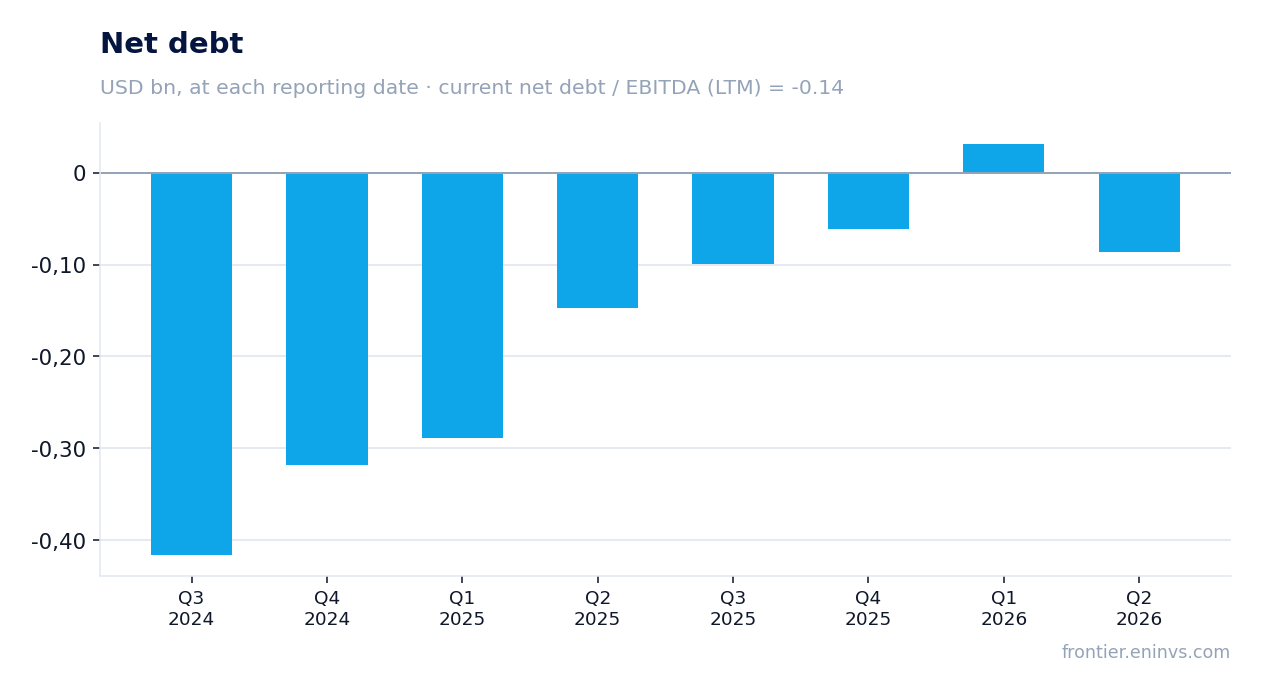
At the end of the quarter, cash and equivalents stood at $302.3 million, with short-term investments of $20.2 million. Total liquidity was $452.9 million, including available borrowing capacity of $140.5 million. This provides a cushion for dividend payments and potential investments.
Free cash flow of $103.4 million is an important metric that can support dividend payments and debt reduction. However, the sustainability of this flow depends on coal prices and sales volumes.
The $0.08 per share dividend remains symbolic against the profit growth
On July 28, 2026, the board declared a regular quarterly dividend of $0.08 per share, payable on August 17, 2026, to stockholders of record as of August 10. This is the same level as a year earlier, despite significant profit growth.
The trailing 12-month dividend yield is only 0.31%. This is a very low level, especially against the key rate, which remains high in Russia. For comparison, the Moscow Exchange index yield has been significantly higher in recent years. However, Warrior Met Coal is a U.S. company, and its dividend policy is geared to the U.S. market, where rates are lower.
Nevertheless, even with this in mind, the dividend looks modest. With net income of $87.4 million for the quarter and total dividend payments of just $4.2 million, the payout ratio is about 5%. This suggests the company prefers to direct funds to development or debt reduction rather than shareholder payouts.
In the future, the dividend could be increased if the company decides it has sufficient free cash flow. However, for now, the policy remains conservative. For income-oriented investors, this is not the most attractive option.
EV/EBITDA of 12.3 is above the three-year average of 10.0, and the portal model offers no upside
The current trailing 12-month EV/EBITDA multiple is 12.3, above the three-year average of 10.0. This means the stock trades at a premium to its own history. Investors are already pricing in significant financial improvement.
The trailing 12-month P/E is 25.0. This is also a fairly high level, although for a company with growing profits it may be justified. However, it is worth noting that profit includes one-off items that may have inflated the base.
The portal model estimates fair value based on current commodity prices and a target EV/EBITDA multiple. According to this model, the upside to the current price is -1%, meaning the stock trades roughly at fair value. This does not provide a buy signal.
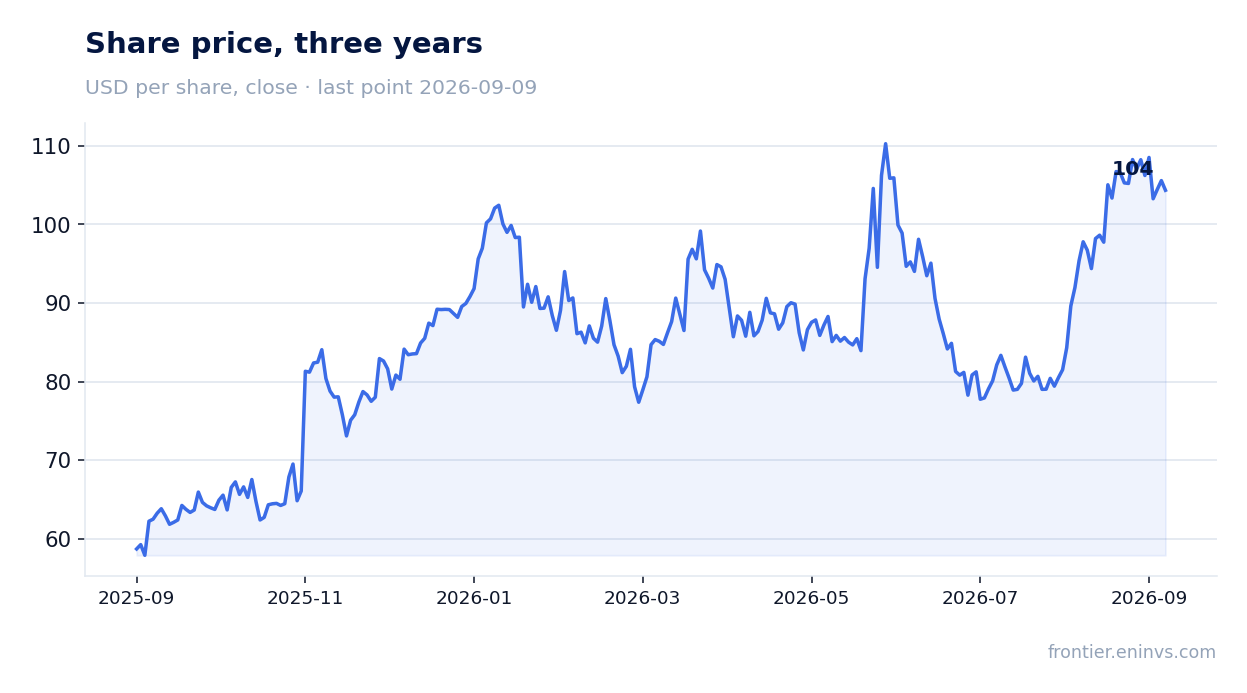
Since the report was published, the stock has risen 28.0%, and on the report day it gained 3.4%. The market reacted positively to the results, but the price is now close to the model's estimate. Further growth would require new drivers, such as higher coal prices or further cost reductions.
Valuation on the latest reported figures
| Metric | Value |
|---|---|
| Market cap | 5.48 bn USD |
| P/E (LTM) | 25.0 |
| EV/EBITDA (LTM) | 12.3 |
| P/B | 2.56 |
| Net debt / EBITDA (LTM) | -0.14 |
| Operating cash flow (LTM) | 0.23 bn |
| ROE | 15.6% |
| Dividend yield (12m) | 0.3% |
| EV/EBITDA, 3-year average | 10.0 |
Bottom line
Warrior Met Coal delivered a strong quarter: record volumes, margin expansion, and the first significant free cash flow after completing Blue Creek construction. However, part of the profit came from one-off items, and the selling price relative to the index declined. The stock trades above its historical EV/EBITDA valuation, and the portal model sees no upside. At the current level, the shares look neutral: growth potential is limited, and risks are tied to coal prices and volume sustainability.
Open the company's financial profile HCC →
See also: market overview · valuation map · stock screeners