Hecla Mining: Q2 profit doubled while revenue barely moved — margin did all the work
On August 4, Hecla Mining Company reported second-quarter 2026 results. Revenue rose 9.8% year over year to $333.9 million, adjusted EBITDA climbed 42.0% to $199.2 million, and net income more than doubled to $117.9 million. The EBITDA margin expanded to 59.7% from 46.1% a year earlier, and the company ended the quarter debt-free for the first time in its history. At the current price the stock looks rather attractive: leverage has been eliminated and cash flow is solid, but the EV/EBITDA multiple of 14.7x is already above its own three-year average, and the portal model points to 37% downside to fair value.
Key takeaways
— Revenue rose just 9.8% because silver sales lagged production due to shipment timing
— EBITDA grew 42.0% on revenue up 9.8% — the margin expanded to 59.7% on lower costs and high prices
— Net income doubled, but $32 million of tax savings, not just operations, drove the result
— The company became debt-free: the remaining $263 million of senior notes were redeemed, with $483 million of cash on hand
— Free cash flow of $136 million was the second-best in history, on capital investment of just $39 million
— The dividend of $0.00375 per share yields 0.08%, far below money-market rates
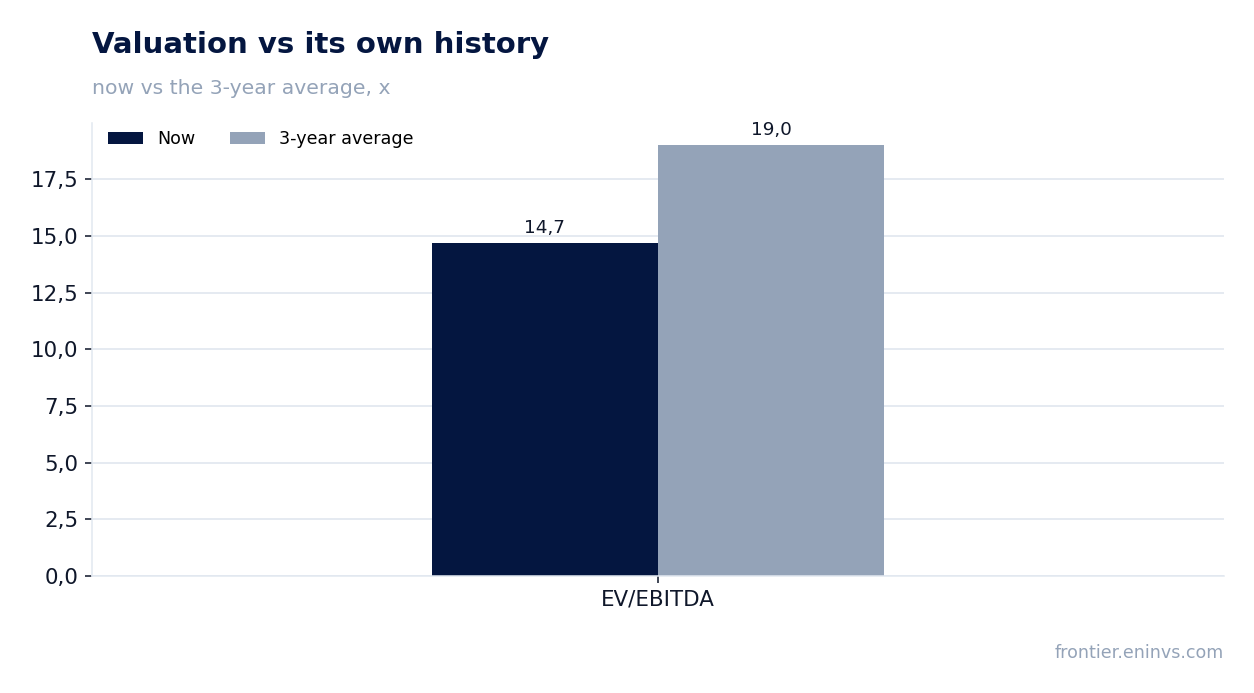
— EV/EBITDA of 14.7x versus a three-year average of 19.0 — the stock is already re-rated against its own history
Attractiveness
Key figures, USD bn
| Metric | Q2 2025 | Q2 2026 | Change |
|---|---|---|---|
| Revenue | 0.30 | 0.33 | +9.8% |
| EBITDA | 0.14 | 0.20 | +42.0% |
| Operating profit | 0.09 | 0.15 | +55.4% |
| Net profit | 0.06 | 0.12 | +104.3% |
| Operating cash flow | 0.16 | 0.17 | +8.1% |
| Capex | 0.07 | 0.04 | -47.4% |
| EBITDA margin | 46.1% | 59.7% | +13.6 pp |
| Net margin | 19.0% | 35.3% | +16.3 pp |
Revenue rose just 9.8% because silver sales lagged production due to shipment timing
Second-quarter 2026 revenue came in at $333.9 million, up 9.8% year over year but down 19% from the record first quarter. The company attributes this to lower realized silver and gold prices and lower precious-metals sales volumes. The average London silver fix fell to $73.44/oz from $84.39/oz in the prior quarter, while gold declined to $4,517/oz from $4,875/oz.
Payable silver ounces sold fell 5% quarter over quarter to 3.4 million ounces even as production rose 8% to 4.2 million ounces. The reason is shipment timing: at Greens Creek, silver concentrate shipments lagged production, building inventory that was shipped in early August. This is a timing shift, not lost sales.
Silver production at Lucky Friday hit a record 1.5 million ounces on a 31% increase in milled grade, but the company explicitly warns this level will not be sustained. Keno Hill lifted production 28% to 0.6 million ounces as milling rates rose 38% while milled grade fell 7%.
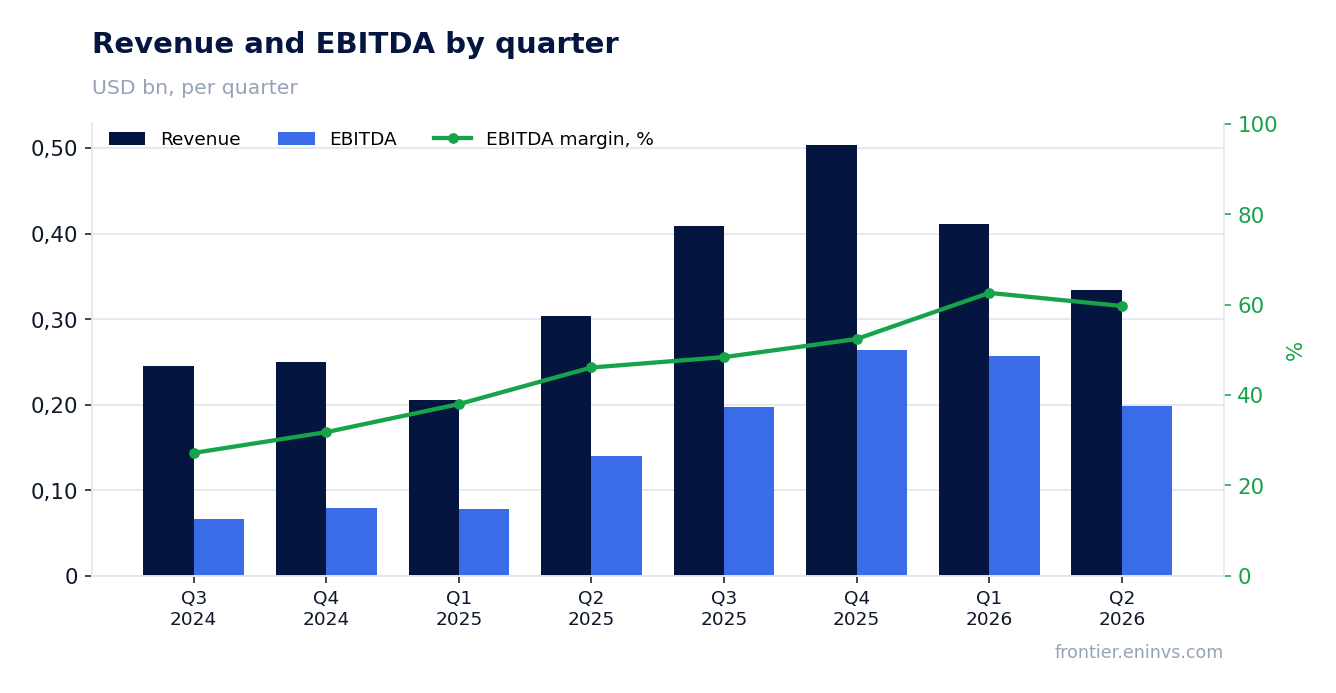
EBITDA grew 42.0% on revenue up 9.8% — the margin expanded to 59.7% on lower costs and high prices
Adjusted EBITDA from continuing operations reached $199.2 million, up 42.0% year over year but down 25% from the record first quarter. The EBITDA margin expanded to 59.7% from 46.1% in Q2 2025. Such margin expansion on nearly flat revenue means prices and costs, not volumes, drove the result.
Costs applicable to sales fell 6% quarter over quarter to $117.3 million on lower silver sales volumes. Silver cash costs after by-product credits were negative $8.10/oz, while all-in sustaining costs (AISC) were $6.07/oz. Negative cash costs mean by-product revenue from gold, lead and zinc fully covers the cost of silver mining.
The company lowered its 2026 cash cost and AISC guidance to negative $4.00–$3.75/oz and $12.50–$13.50/oz respectively. Silver production guidance was narrowed to 15.1–16.1 million ounces from 15.1–16.5 million: the Keno Hill outlook was cut to 2.2–2.6 million ounces, partly offset by a raised Greens Creek forecast of 8.0–8.3 million ounces.
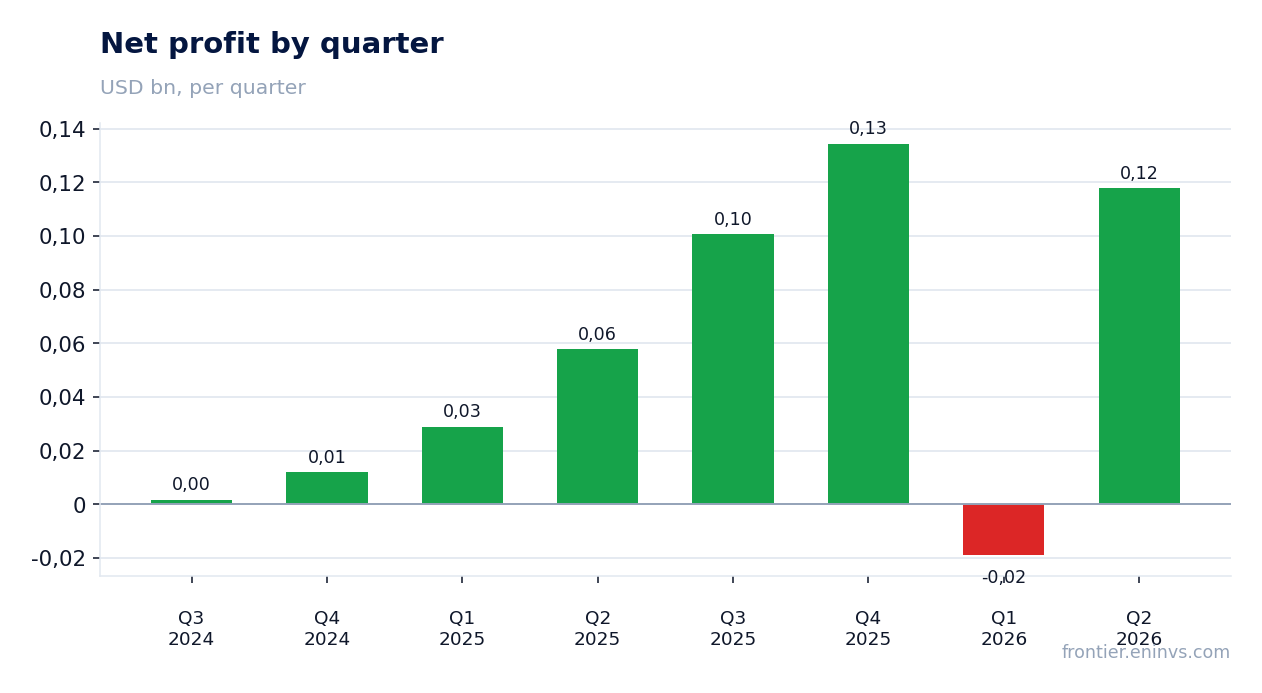
Net income doubled, but $32 million of tax savings, not just operations, drove the result
Net income from continuing operations was $117.9 million, or $0.18 per share, up 104.3% from $57.7 million a year earlier. However, sequentially it fell from $164.7 million in the prior quarter. The company attributes the sequential decline to a 19% drop in revenue and a $7 million increase in exploration expense.
Part of the year-over-year growth came from taxes, not operations: income and mining tax expense fell $32 million quarter over quarter due to lower profitability and tax planning that allowed consolidation of tax groups. This is a one-off effect that will not automatically repeat.
The net margin rose to 35.3% from 19.0% a year earlier. Yet in the first quarter of 2026 the company posted a $19.0 million loss, illustrating how volatile the bottom line is when metal prices swing.
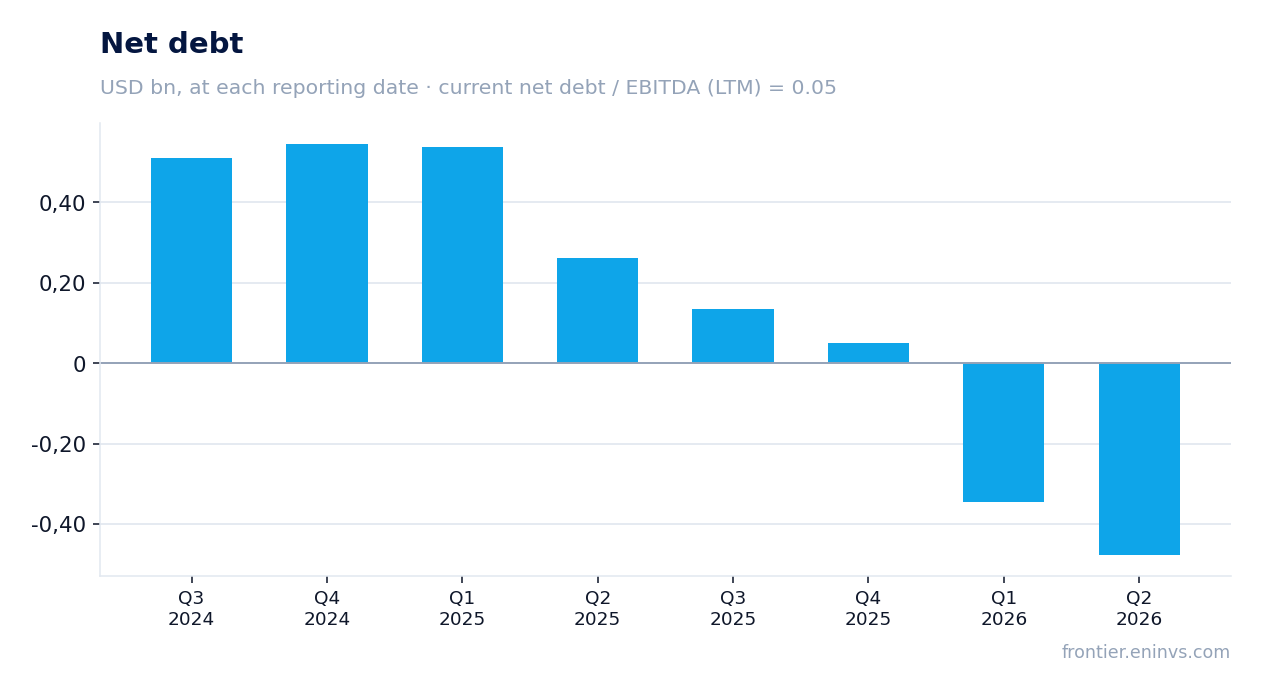
The company became debt-free: the remaining $263 million of senior notes were redeemed, with $483 million of cash on hand
Hecla redeemed the remaining $263 million of 7.25% senior notes and ended the quarter debt-free, excluding finance leases. Cash on hand was $483 million, the $225 million revolving credit facility was undrawn, and a further $75 million accordion remains available. This is the strongest balance-sheet position in the company's history.
Net debt at the end of the second quarter was negative $477.3 million, meaning cash exceeds debt obligations. The net debt to LTM EBITDA ratio stands at 0.05. The prior value of this ratio is not in the facts, so no direction of change is given.
Interest expense fell $3 million quarter over quarter due to the note redemption. Freedom from debt gives the company room to fund development projects without external borrowing, but it also means leverage is no longer a risk factor.
Free cash flow of $136 million was the second-best in history, on capital investment of just $39 million
Operating cash flow from continuing operations was $174.9 million, up 61% year over year. Free cash flow — the second-highest in history — was $135.8 million, on capital investment of just $39.1 million. The company attributes the cash flow increase to a $63 million reduction in accounts receivable from concentrate shipment timing and collections.
Greens Creek and Lucky Friday set quarterly site-level free cash flow records of $130 million and $88 million respectively. Keno Hill added $14.6 million. All producing assets generate positive cash flow.
Capital investment is expected to rise in the third and fourth quarters due to the construction season. The 2026 capital guidance was raised to $208–223 million from $204–223 million. Exploration spending remains at $55 million.
The dividend of $0.00375 per share yields 0.08%, far below money-market rates
The board declared a quarterly dividend of $0.00375 per share, payable September 10, 2026. At the pre-release price of $14.43, that yields 0.08% annually. For comparison, three-month US Treasury yields exceed 5%, so the dividend is not a reason to buy the stock.
The company also declared a dividend on its Series B preferred stock of $0.875 per share. Hecla's dividend policy has historically been conservative: payouts represent a symbolic share of profit, with most free cash flow directed to project development.
With LTM net income of $334.0 million and a market capitalization of $13.98 billion, the dividend yield remains minimal. If the company maintains current payout levels, the dividend will not play a role in the investment decision.
EV/EBITDA of 14.7x versus a three-year average of 19.0 — the stock is already re-rated against its own history
The LTM EV/EBITDA multiple is 14.7x versus a three-year average of 19.0. This means the stock trades below its historical valuation, which could indicate undervaluation. However, the LTM P/E of 41.8 reflects a low earnings base in prior periods.
The portal model, which reprices EBITDA at current commodity prices against a target EV/EBITDA, shows 37% downside to fair value. This is the portal's own estimate, not a market consensus. The gap with the historical multiple is explained by current EBITDA sitting at a peak in the silver price cycle.
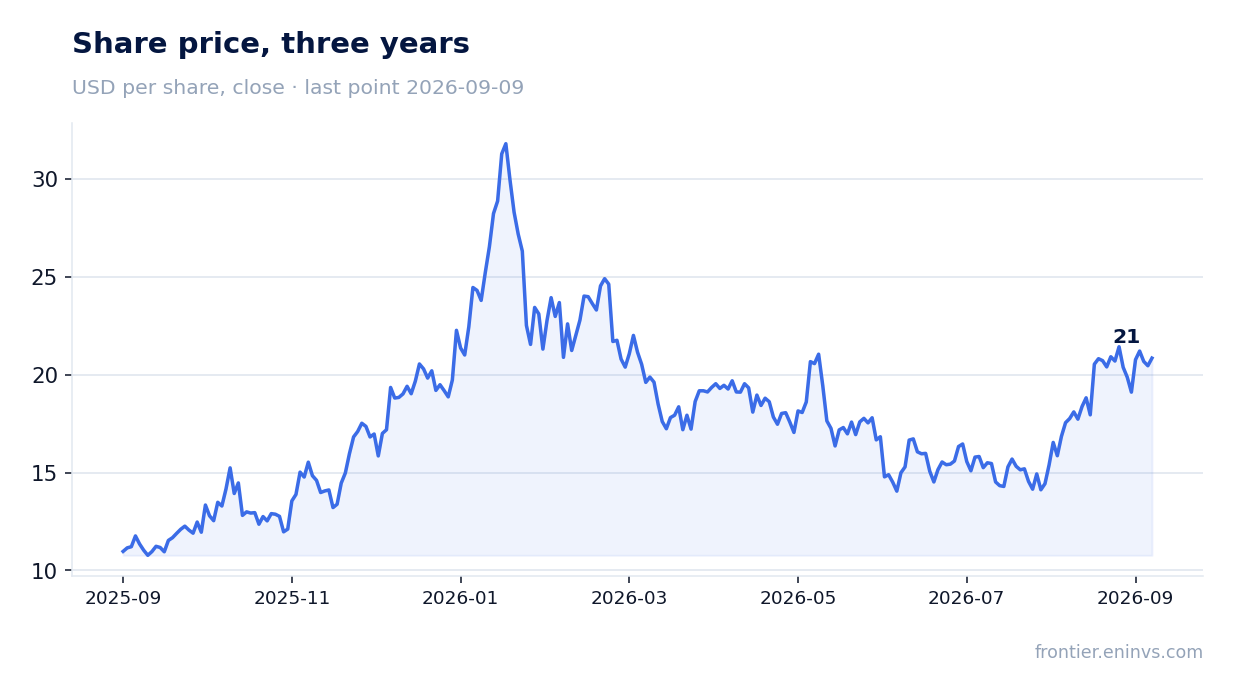
Since the report was published the stock has risen 44.5%, including 6.7% on the release day. Market capitalization reached $13.98 billion. Such a move already prices in an optimistic scenario for metal prices, limiting further upside.
Valuation on the latest reported figures
| Metric | Value |
|---|---|
| Market cap | 14.0 bn USD |
| P/E (LTM) | 41.8 |
| EV/EBITDA (LTM) | 14.7 |
| P/B | 5.39 |
| Net debt / EBITDA (LTM) | 0.05 |
| Operating cash flow (LTM) | 0.56 bn |
| ROE | 18.0% |
| Dividend yield (12m) | 0.1% |
| EV/EBITDA, 3-year average | 19.0 |
Bottom line
The report's strength is record margin and zero debt: EBITDA rose 42.0% on revenue up 9.8%, with $483 million of cash on hand. The weak spots are the sequential decline in revenue and profit, a one-off $32 million tax benefit, and a symbolic dividend yielding 0.08%. The key question for a holder now is whether the current price justifies the peak in the silver price cycle: EV/EBITDA of 14.7x is below the historical average, but the portal model shows 37% downside to fair value. The verdict is rather attractive, with a caveat for the cyclical nature of earnings.
Open the company's financial profile HL →
See also: market overview · valuation map · stock screeners