Intrepid Potash: profit up 4.8x, but $13.2m of it came from the Intrepid South sale, not fertiliser

On 4 August Intrepid Potash reported second-quarter 2026 results. Revenue fell 6.7% year on year to $66.7m, but EBITDA jumped 58.4% to $17.5m and net profit rose 4.8x to $15.6m. The main contributor to profit was not operations but the sale of the Intrepid South asset, which brought in $13.2m. At the current price the stock trades at 20.7 times trailing twelve-month earnings and 6.0 times EBITDA, while the portal model implies only 4% upside to fair value – not enough to be attractive, hence a neutral verdict.
Key takeaways
— Revenue fell 6.7% on lower potash sales, while Trio grew 8%
— EBITDA rose 58.4% on record-low Trio cost of goods sold
— Net profit rose 4.8x, but $13.2m came from the Intrepid South sale
— The company cut capex guidance to $40m and expanded buyback to $50m
— Leverage is negative: net cash position of $181.8m
— Valuation at 20.7 P/E and 6.0 EV/EBITDA leaves no cushion, portal model sees only +4%
Attractiveness
Key figures, USD bn
| Metric | Q2 2025 | Q2 2026 | Change |
|---|---|---|---|
| Revenue | 0.07 | 0.07 | -6.7% |
| EBITDA | 0.01 | 0.02 | +58.4% |
| Operating profit | 0.00 | 0.00 | -24.1% |
| Net profit | 0.00 | 0.02 | +377.4% |
| Operating cash flow | 0.04 | 0.03 | -14.9% |
| Capex | 0.00 | 0.01 | +105.5% |
| EBITDA margin | 15.5% | 26.2% | +10.7 pp |
| Net margin | 4.6% | 23.4% | +18.8 pp |
Revenue fell 6.7% on lower potash sales, while Trio grew 8%
Revenue in the second quarter of 2026 was $66.7m, down 6.7% from a year earlier. The decline came from the potash segment: sales volumes fell 14% to 59 thousand tons, and segment revenue dropped to $30.6m. The average realised potash price rose 8% to $391 per ton, but that was not enough to offset lower volumes.
The Trio segment, by contrast, grew revenue by 8% to $35.7m. Sales volumes were flat at 70 thousand tons, while the average realised price rose 6% to $389 per ton. Demand for chloride-free sulfate fertilisers provided support.
Overall revenue declined, but the mix shifted towards the higher-margin Trio. This matters because Trio generates the bulk of gross margin.
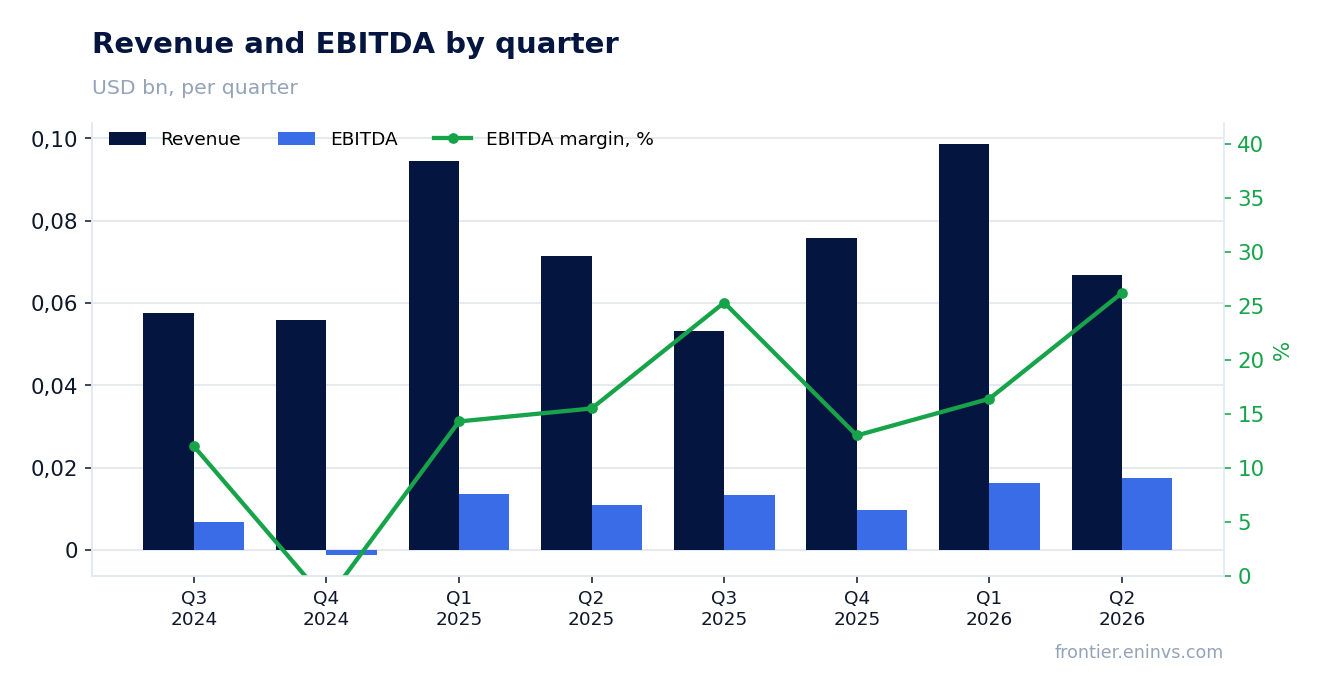
EBITDA rose 58.4% on record-low Trio cost of goods sold
EBITDA in the second quarter of 2026 reached $17.5m, up 58.4% from a year earlier. The growth came despite lower revenue, indicating an improvement in the cost structure. The EBITDA margin rose to 26.2% from 15.5% a year earlier.
The key factor was the cost of goods sold for Trio. Trio COGS per ton was $205, down 13% from $235 a year earlier, the lowest level since the fourth quarter of 2019. The reduction was made possible by the commissioning of a new continuous miner at the East Mine and production optimisation.
Gross margin rose to $16.6m from $12.4m a year earlier. Trio gross margin reached $11.4m, up 42% year on year. This is the main driver of EBITDA growth.
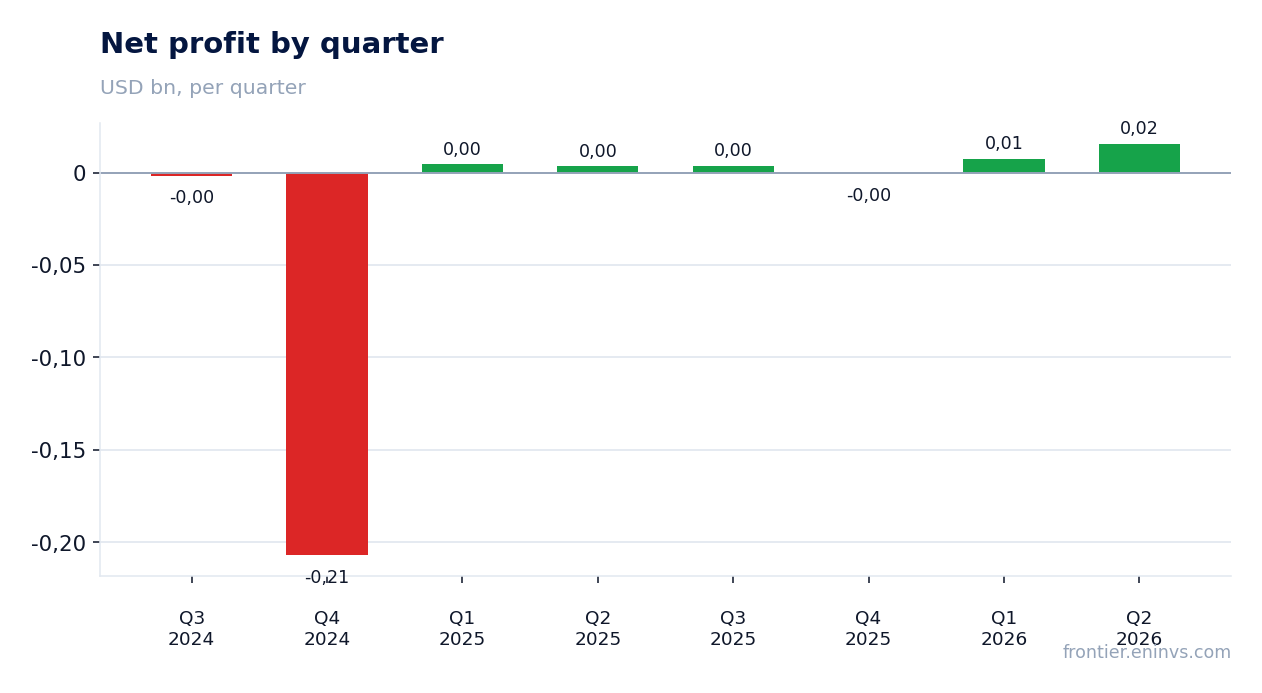
Net profit rose 4.8x, but $13.2m came from the Intrepid South sale
Net profit in the second quarter of 2026 was $15.6m, 4.8 times higher than $3.3m a year earlier. However, the bulk of this growth came from a one-off: the sale of the Intrepid South asset brought $13.2m of after-tax profit. Without it, profit from continuing operations would have been $2.4m.
Profit from continuing operations rose to $2.4m from $1.4m a year earlier. Diluted earnings per share from continuing operations were 18 cents versus 10 cents a year earlier. Including the asset sale, diluted earnings per share reached $1.17.
The sale of Intrepid South closed on 1 April 2026. The company received $62m in cash during the quarter, and the total transaction value after customary adjustments was $68.9m. These funds strengthened the balance sheet but are not a recurring source of profit.
The company cut capex guidance to $40m and expanded buyback to $50m
Capital expenditures in the second quarter of 2026 were $8.5m, and $13.6m for the first half. The company cut its 2026 capex guidance to approximately $40m from the previous range of $40–50m. The reduction reflects the removal of AMAX spend and lower costs for Primary Pond 8 at Wendover.
In June 2026 the board expanded the share repurchase programme to $50m. The company intends to repurchase opportunistically while maintaining flexibility to fund operating projects and preserve balance sheet strength.
Operating cash flow from continuing operations in the second quarter was $34.0m, slightly below $36.1m a year earlier due to less favourable working capital movements. For the half-year, OCF rose to $55.3m from $42.9m. Free cash flow remains positive even after capex.
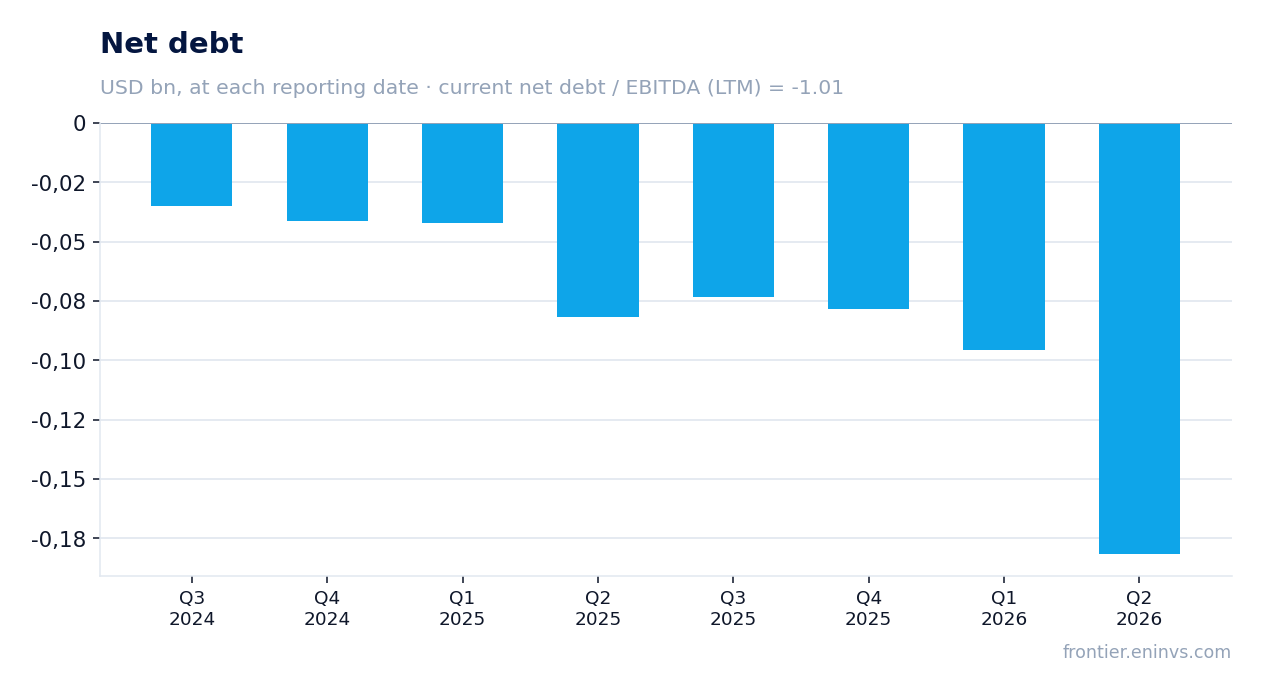
Leverage is negative: net cash position of $181.8m
Net debt at the end of the second quarter of 2026 was minus $181.8m, meaning the company has a net cash position. This reflects the $62m inflow from the Intrepid South sale and the absence of debt. The net debt to EBITDA ratio for the trailing twelve months is minus 1.01 – a level that does not signal leverage.
As of 30 June 2026, cash and equivalents totalled $185.0m. The company has no borrowings under its revolving credit facility, with $149.8m available out of $150m. The facility matures in March 2031.
There is no interest expense, while interest income in the second quarter was $1.3m. The net cash position provides resilience but is not a profit driver.
Valuation at 20.7 P/E and 6.0 EV/EBITDA leaves no cushion, portal model sees only +4%
Intrepid Potash shares trade at a P/E of 20.7 and EV/EBITDA of 6.0 based on trailing twelve-month earnings and EBITDA. Market capitalisation is $543.6m. For comparison, the company's historical multiples are not provided in the facts, so it cannot be stated whether the current level is above or below its own history.
The portal model values the shares based on current commodity prices and a target EV/EBITDA. According to this model, the upside to fair value is +4%. This is not a market consensus but our own estimate.
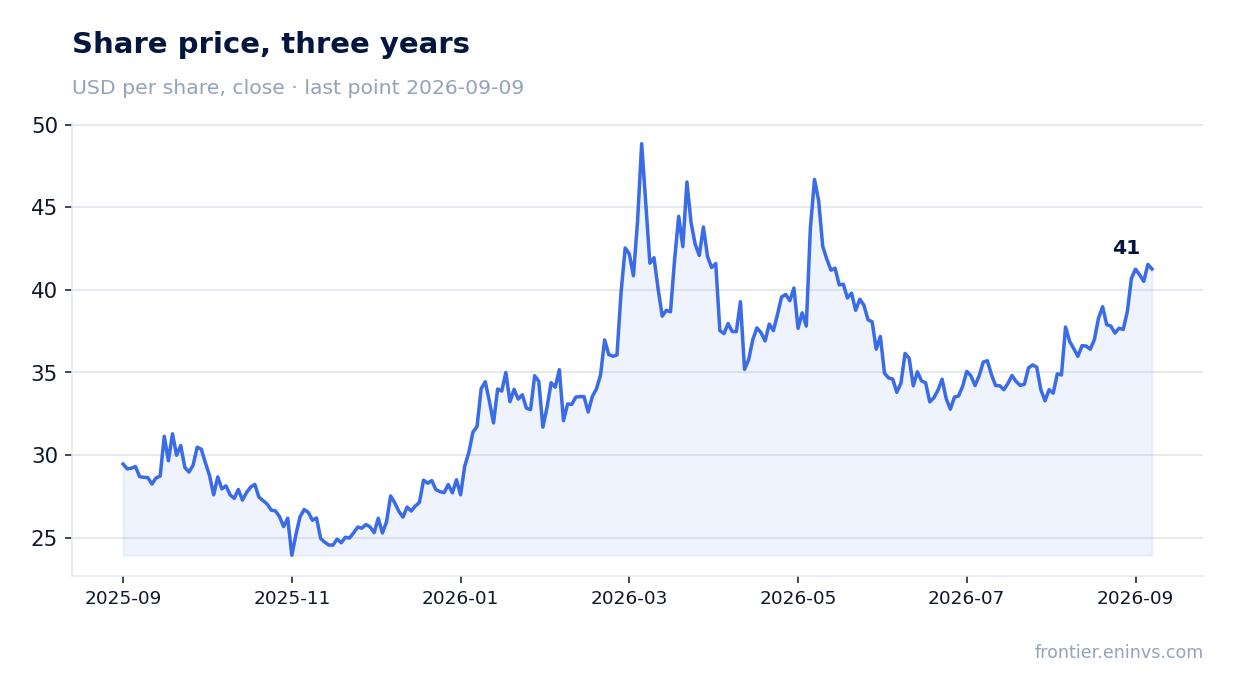
Since the report was published, the stock has risen 23.9%, and on the release day it gained 2.0%. The post-report rally reflects a positive reaction to margin improvement and the asset sale, but the current valuation already reflects these factors.
Valuation on the latest reported figures
| Metric | Value |
|---|---|
| Market cap | 0.54 bn USD |
| P/E (LTM) | 20.7 |
| EV/EBITDA (LTM) | 6.0 |
| P/B | 1.11 |
| Net debt / EBITDA (LTM) | -1.01 |
| Operating cash flow (LTM) | 0.06 bn |
| ROE | 12.3% |
Bottom line
The report showed strong improvement in operating efficiency: EBITDA rose 58.4% on record-low Trio costs and higher prices. However, net profit was largely shaped by the asset sale rather than recurring operations. The balance sheet is strong – net cash of $181.8m, reduced capex, and a buyback programme. But the valuation at 20.7 P/E and 6.0 EV/EBITDA leaves little cushion, and the portal model sees only 4% upside. At the current price the stock looks fairly valued, and the verdict is neutral.
Open the company's financial profile IPI →
See also: market overview · valuation map · stock screeners