Kinross Gold: quarterly profit up 59%, but the portal's model sees 26% downside

On August 5, Kinross Gold reported Q2 2026 results: revenue grew 29.5% YoY to $2,238.1 million, net profit rose 59.1% to $844.2 million. At the current price, the shares look rather unattractive: multiples are near the upper end of their own history, and the portal's model implies 26% downside.
Key takeaways
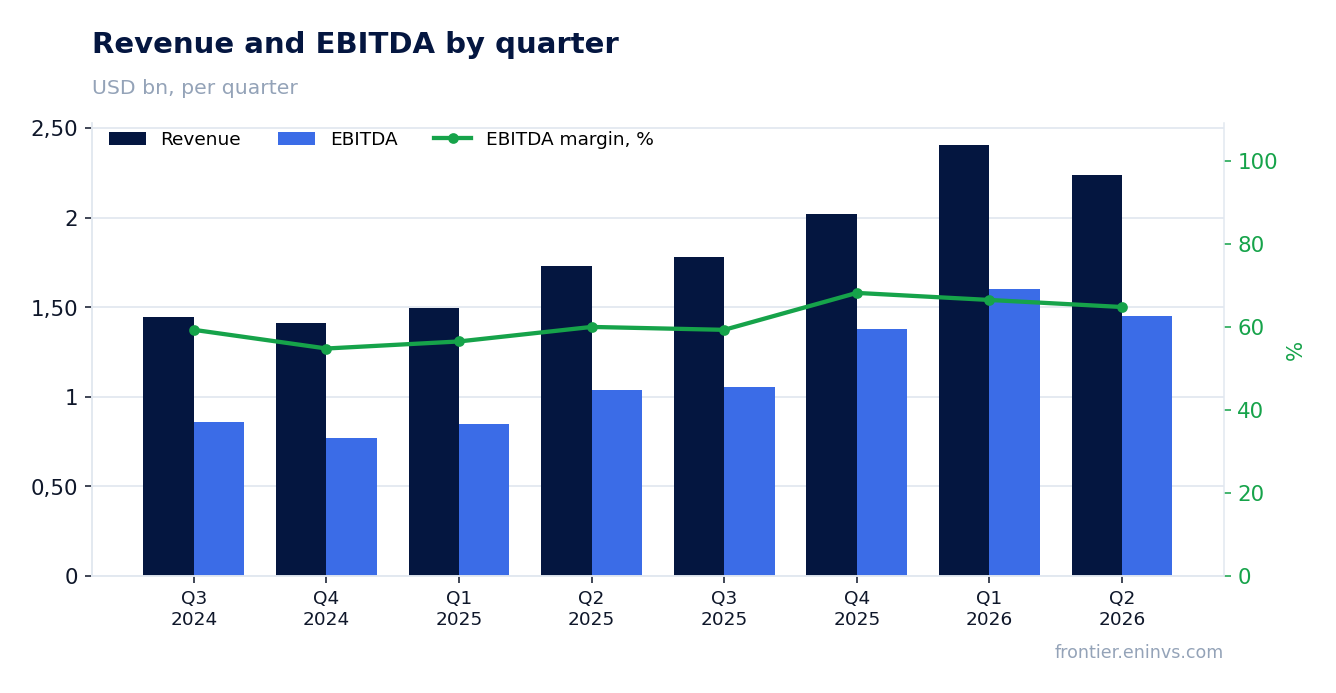
— Q2 revenue grew 29.5% thanks to high gold prices
— EBITDA margin reached 65.5% versus 60.0% a year earlier, operating profit up 51.6%
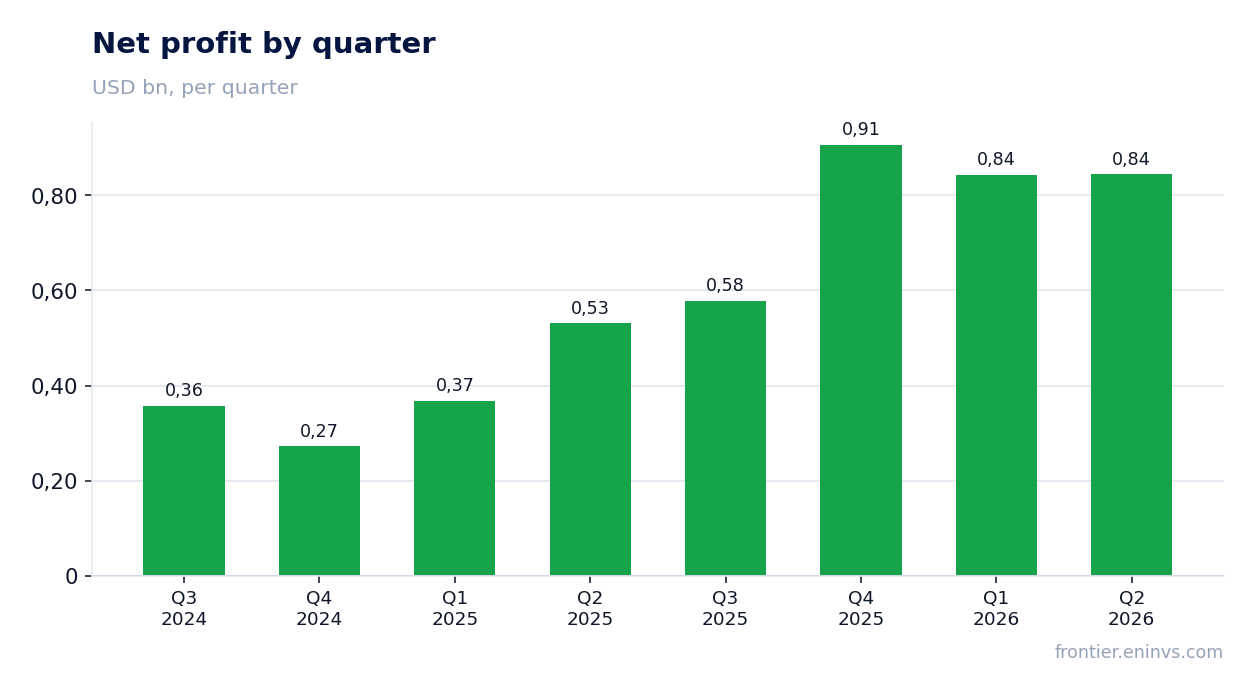
— Net profit grew 59.1% to $844.2 million, helped by operating leverage
— Free cash flow remains positive, but capex rose by a third
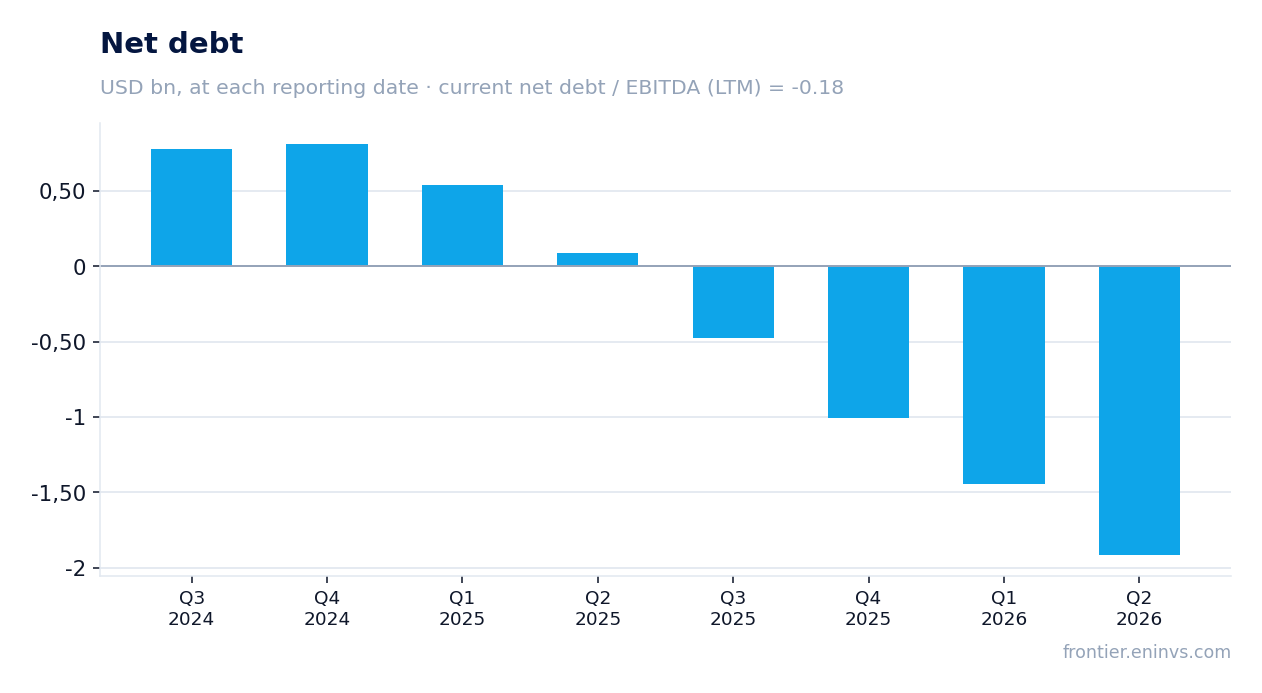
— Net debt turned negative at minus $1,917.6 million, or minus 0.18x EBITDA for the last twelve months
— Trailing twelve-month dividend yield is only 0.40%, below the key rate
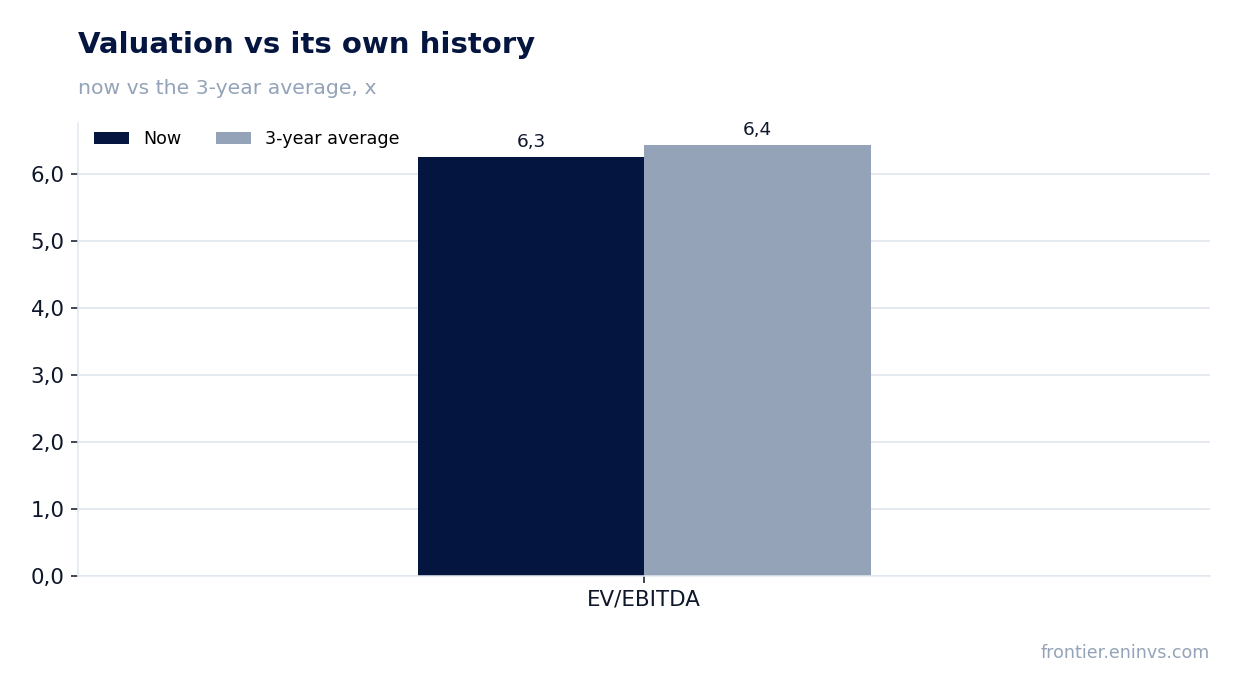
— Valuation: EV/EBITDA at 6.26 – near the three-year average, but the portal's model gives minus 26%
Attractiveness
Key figures, USD bn
| Metric | Q2 2025 | Q2 2026 | Change |
|---|---|---|---|
| Revenue | 1.73 | 2.24 | +29.5% |
| EBITDA | 1.04 | 1.47 | +41.3% |
| Operating profit | 0.77 | 1.17 | +51.6% |
| Net profit | 0.53 | 0.84 | +59.1% |
| Operating cash flow | 0.99 | 1.15 | +15.5% |
| Capex | 0.31 | 0.41 | +34.3% |
| EBITDA margin | 60.0% | 65.5% | +5.5 pp |
| Net margin | 30.7% | 37.7% | +7.0 pp |
Q2 revenue grew 29.5% thanks to high gold prices
In Q2 2026, Kinross Gold's revenue reached $2,238.1 million, up 29.5% from the same quarter a year earlier. Growth slowed from Q1 2026's 60.8% but remained double-digit. The main driver is high gold prices, which continue to support the company's revenue.
Over the last twelve months (LTM), revenue reached $8,500.0 million. The company maintains an upward trend: quarterly growth accelerated from 23.5% in Q3 2025 to 43.5% in Q4, then 60.8% in Q1 2026. Growth slowed in Q2 but remained substantial.
EBITDA margin reached 65.5% versus 60.0% a year earlier, operating profit up 51.6%
EBITDA in Q2 2026 grew 41.3% YoY to $1,450.0 million, and the EBITDA margin expanded from 60.0% to 65.5%. Operating profit rose 51.6% to $1,174.5 million. The margin expansion reflects operating leverage: with revenue up 29.5%, EBITDA grows faster due to relatively stable costs.
Over the last twelve months, EBITDA reached $5,634.3 million. The margin improvement is a key factor supporting profit and appears sustainable as gold prices remain high.
Net profit grew 59.1% to $844.2 million, helped by operating leverage
Net profit in Q2 2026 was $844.2 million, up 59.1% from a year earlier. Net margin rose from 30.7% to 37.7%. Profit growth outpaced revenue growth thanks to operating leverage and likely low interest expenses given negative net debt.
Over the last twelve months, net profit reached $3,172.1 million, implying a net margin of about 37%. This is a high level for a gold miner, reflecting favorable price conditions.
Free cash flow remains positive, but capex rose by a third
Operating cash flow in Q2 2026 was $1,145.9 million, up 15.5% from $992.4 million a year earlier. Capital expenditures rose to $411.0 million from $306.1 million, an increase of 34.3%. Nevertheless, free cash flow remains positive at roughly $735 million for the quarter.
Over the last twelve months, operating cash flow reached $3,800.0 million. The rise in capex is related to project development, but the company generates enough cash to fund investments and dividends.
Net debt turned negative at minus $1,917.6 million, or minus 0.18x EBITDA for the last twelve months
At the end of Q2 2026, Kinross Gold's net debt was minus $1,917.6 million, meaning the company holds a net cash position. Over the last twelve months, net debt/EBITDA stood at minus 0.18. A year earlier, net debt was positive at $87.4 million, so the company has shifted from a small debt to a significant cash cushion.
Net debt changed by minus $0.5 billion over the quarter and by minus $2.0 billion over the last twelve months. This indicates the company is actively accumulating cash, enhancing its financial stability.
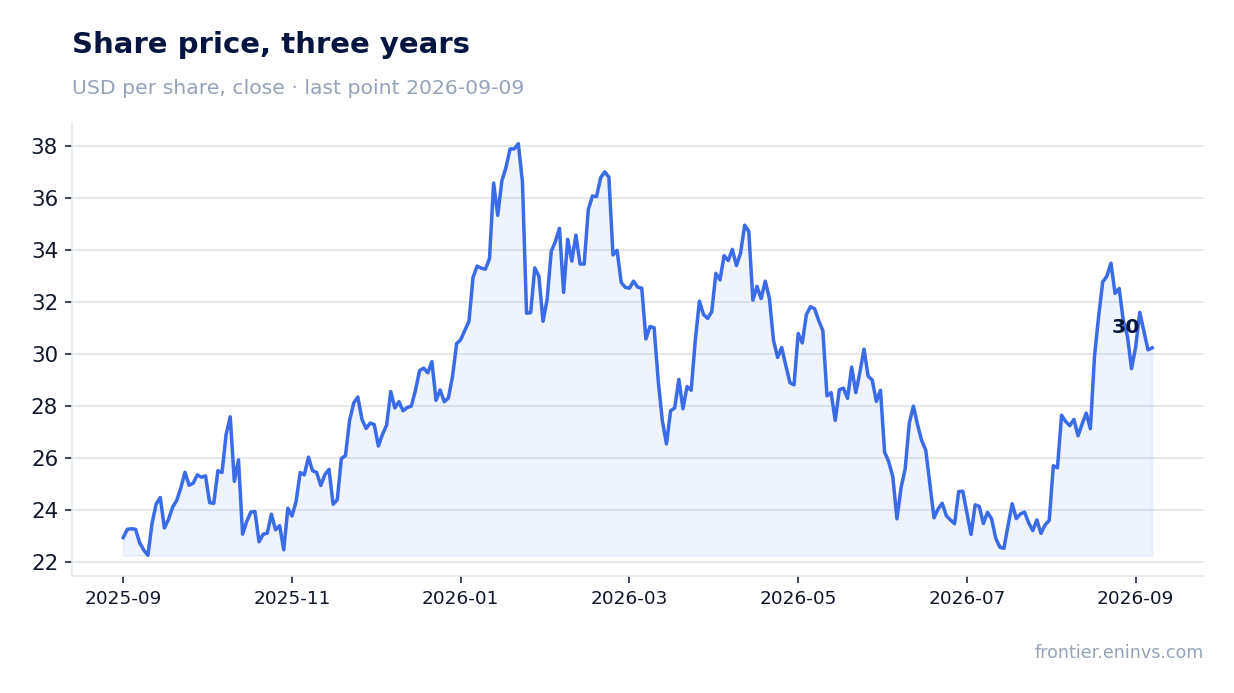
Trailing twelve-month dividend yield is only 0.40%, below the key rate
Over the last twelve months, Kinross Gold paid dividends corresponding to a yield of 0.40% at the current price. This is significantly below the key rate, making the stock unattractive for income-focused investors. The company pays dividends, but the amount is small relative to earnings.
With trailing net profit of $3,172.1 million and a market cap of $36,271.3 million, the payout ratio appears low. The company may increase dividends in the future, but for now the yield remains modest.
Valuation: EV/EBITDA at 6.26 – near the three-year average, but the portal's model gives minus 26%
The current EV/EBITDA multiple is 6.26 versus the three-year average of 6.44. Thus, the stock trades roughly in line with its historical valuation. P/E LTM is 11.43, which also looks moderate for a gold miner.
However, on the portal's model, which re-prices EBITDA at current gold prices and applies a target EV/EBITDA, the share's downside potential is minus 26% from the current market cap. This suggests the market has already priced in high gold prices, and further upside is unlikely without additional increases in the metal's price.
Valuation on the latest reported figures
| Metric | Value |
|---|---|
| Market cap | 36.3 bn USD |
| P/E (LTM) | 11.4 |
| EV/EBITDA (LTM) | 6.3 |
| P/B | 4.23 |
| Net debt / EBITDA (LTM) | -0.18 |
| Operating cash flow (LTM) | 3.80 bn |
| ROE | 36.0% |
| Dividend yield (12m) | 0.4% |
| EV/EBITDA, 3-year average | 6.4 |
Bottom line
Kinross Gold delivered a strong quarter: revenue and profit grew at double-digit rates, margins expanded, and net debt turned negative. However, these results are already priced in: the stock trades near its three-year average EV/EBITDA, and the portal's model points to 26% downside. The dividend yield is minimal, so the stock's main value lies in capital appreciation, which depends on further gold price increases. The verdict is rather unattractive: at the current price, risks outweigh potential.
Open the company's financial profile KGC →
See also: market overview · valuation map · stock screeners