Kosmos Energy: $185m Q2 2026 profit, but $117m of it went to hedge settlements
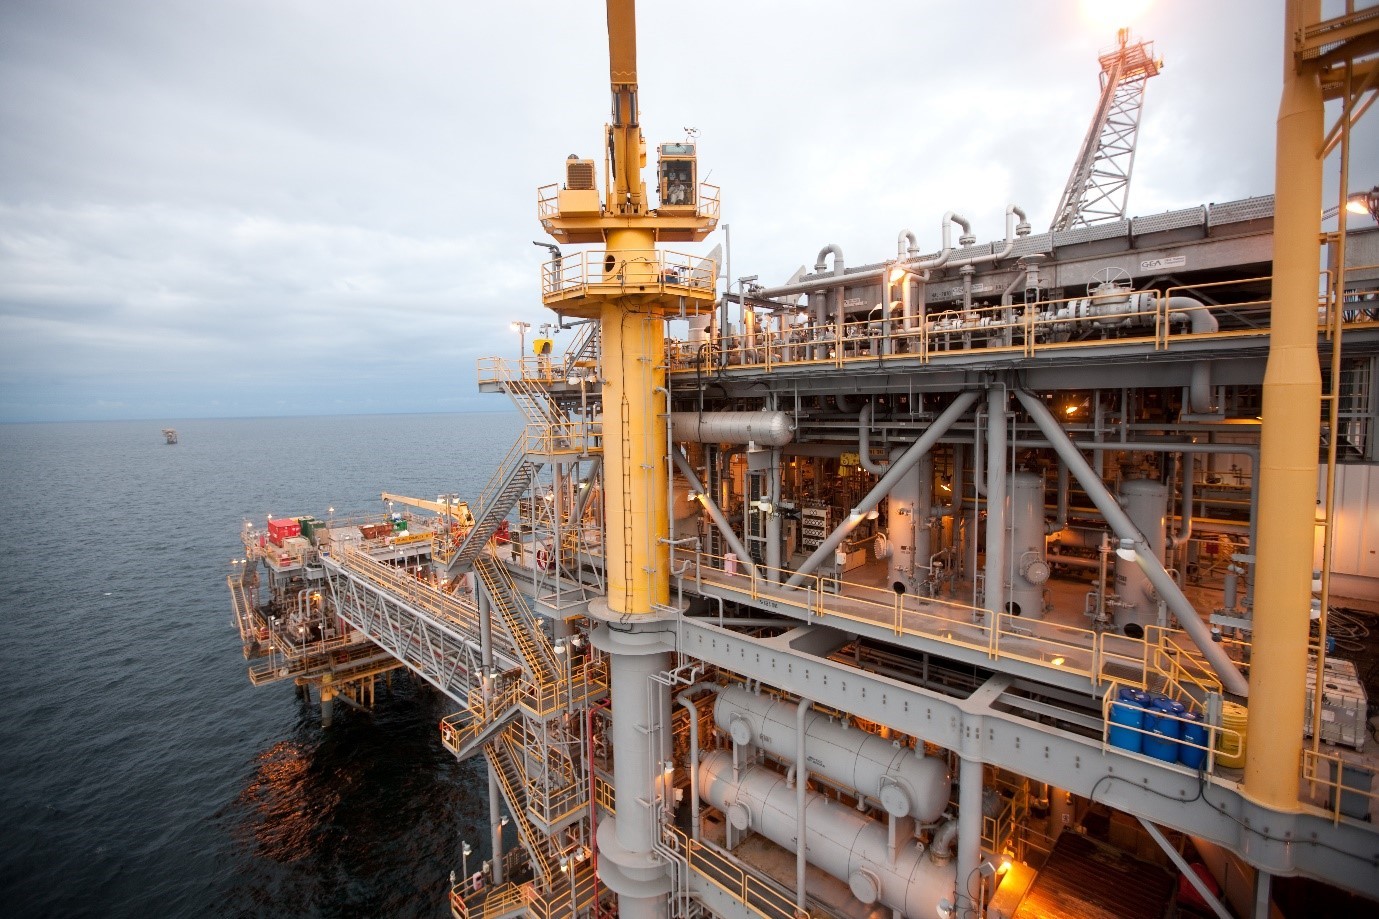
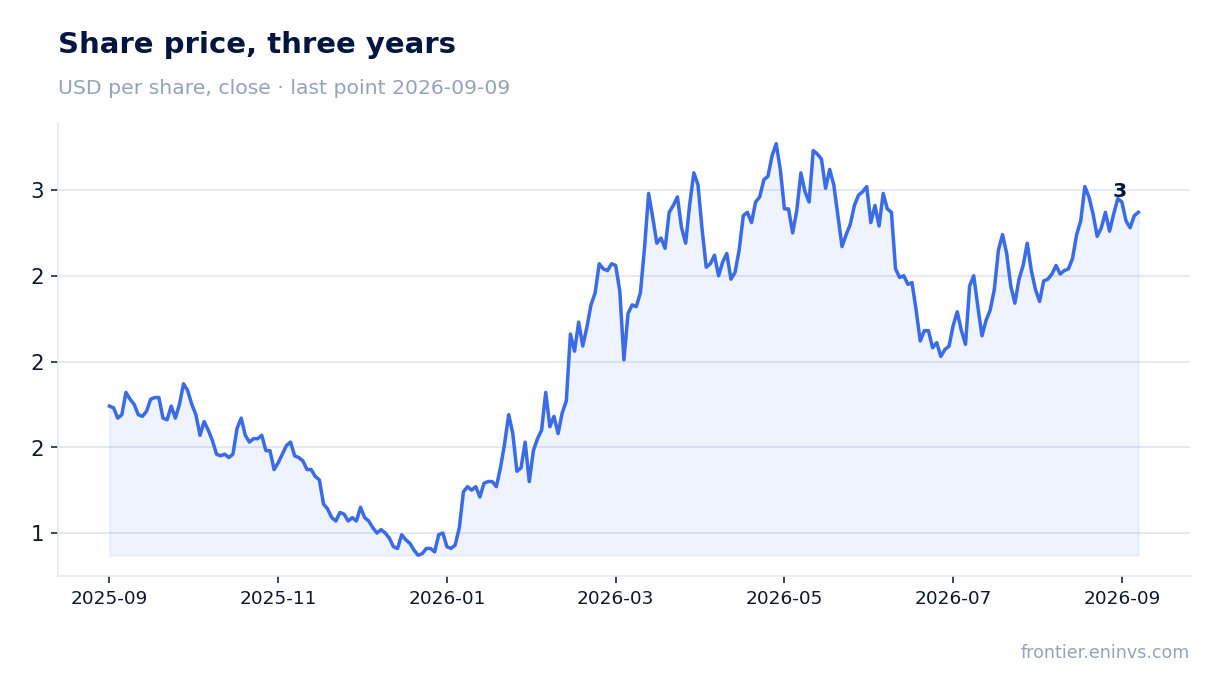
On 3 August Kosmos Energy reported Q2 2026 results. Revenue rose 54.7% year on year to $607.3m, EBITDA jumped 356.5% to $408.1m, and net income was $185m versus a $87.7m loss a year earlier. However, $117.4m went to cash settlements on derivatives, and adjusted net income was only $68m. At the current price the stock trades at 38.9 times trailing twelve-month EBITDA – expensive for a company with negative free cash flow in the first half, so the share looks rather unattractive.
Key takeaways
— Revenue rose 54.7% year on year to $607.3m, but $105.4m was taken by hedge settlements
— EBITDA margin of 67.2% versus 22.8% a year earlier – growth came not only from volume but also from a 25% drop in unit costs
— Net income of $185m includes one-off items; adjusted net income was only $68m
— Operating cash flow was $175m, but free cash flow for the half-year was negative at $103m
— Net debt / EBITDA of 26.6 times trailing twelve months – a level that leaves no room for error
— The sale of Equatorial Guinea assets brought in $127m and reduced debt, but production fell by 1,000 boepd
— A valuation of 38.9 times trailing twelve-month EBITDA is not justified with negative free cash flow and high debt
Attractiveness
Key figures, USD bn
| Metric | Q2 2025 | Q2 2026 | Change |
|---|---|---|---|
| Revenue | 0.39 | 0.61 | +54.7% |
| EBITDA | 0.09 | 0.41 | +356.5% |
| Operating profit | -0.06 | 0.28 | to profit |
| Net profit | -0.09 | 0.18 | to profit |
| Operating cash flow | 0.13 | 0.18 | +37.6% |
| Capex | 0.08 | 0.08 | -7.4% |
| EBITDA margin | 22.8% | 67.2% | +44.4 pp |
| Net margin | -22.3% | 30.4% | +52.7 pp |
Revenue rose 54.7% year on year to $607.3m, but $105.4m was taken by hedge settlements
Kosmos Energy's revenue in Q2 2026 was $607.3m, up 54.7% year on year. Growth was driven by two factors: a 12% increase in production to approximately 71,400 barrels of oil equivalent per day and higher oil prices – the average realised price rose to $108.57 per barrel from $66.10 a year earlier.
However, a significant portion of revenue was consumed by derivative settlements. Cash settlements on commodity hedges were negative $105.4m, compared with a positive $11.4m a year earlier. As a result, realised revenue including hedges was only $501.9m, up 24% from $404.0m a year earlier.
The sale of Equatorial Guinea assets, completed on 16 June, brought in $127m, but these funds went to repay debt rather than into revenue. The deal itself reduced production by about 1,000 boepd, partially offsetting growth from other assets.
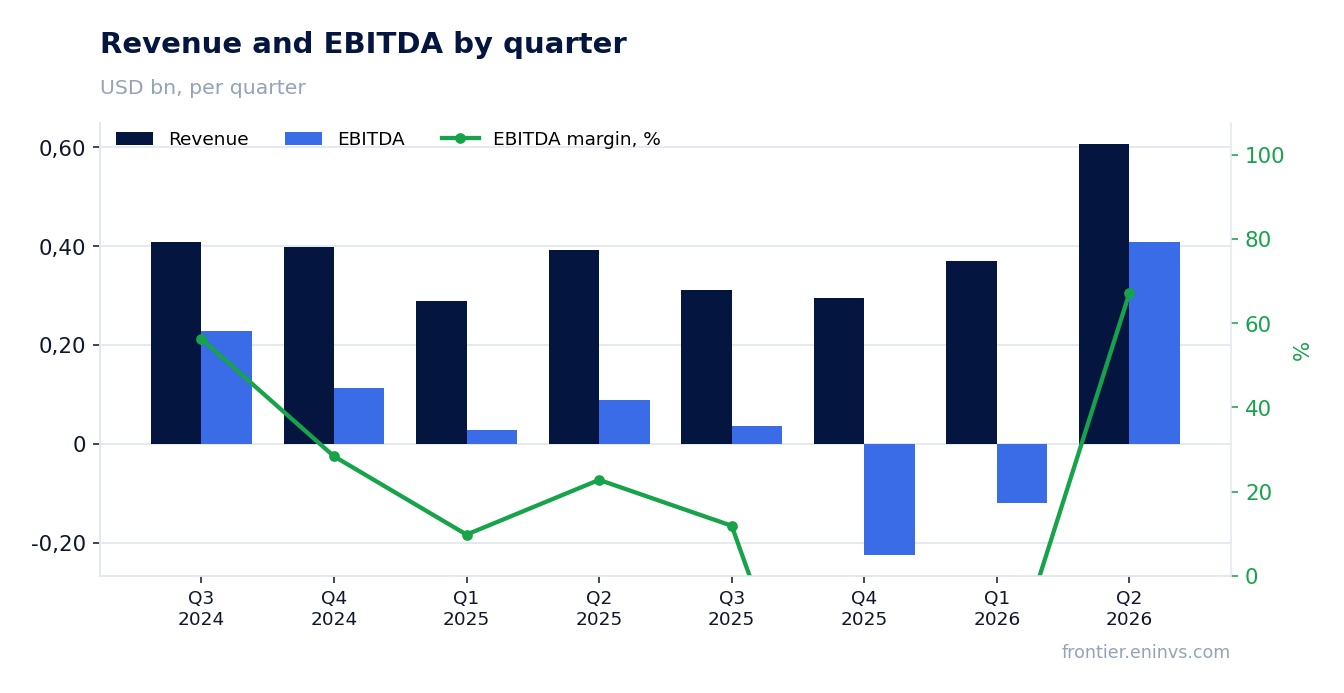
EBITDA margin of 67.2% versus 22.8% a year earlier – growth came not only from volume but also from a 25% drop in unit costs
EBITDA in Q2 2026 was $408.1m, up 356.5% from $89.4m a year earlier. The EBITDA margin jumped to 67.2% from 22.8%. This growth is explained not only by higher revenue but also by a sharp reduction in production costs.
Production expenses fell 25% to $179.4m, and unit costs per barrel dropped to $25.61 from $36.49 a year earlier. The company notes that reducing costs at GTA Phase 1 remains a priority, and unit operating costs are on track to fall by more than 50% year on year.
The cost reduction occurred alongside production growth at GTA and in Ghana. Production in Ghana was 36,300 boepd, including 7,000 boepd of gas. GTA production rose to 15,700 boepd, equivalent to about 2.65 mtpa of LNG.
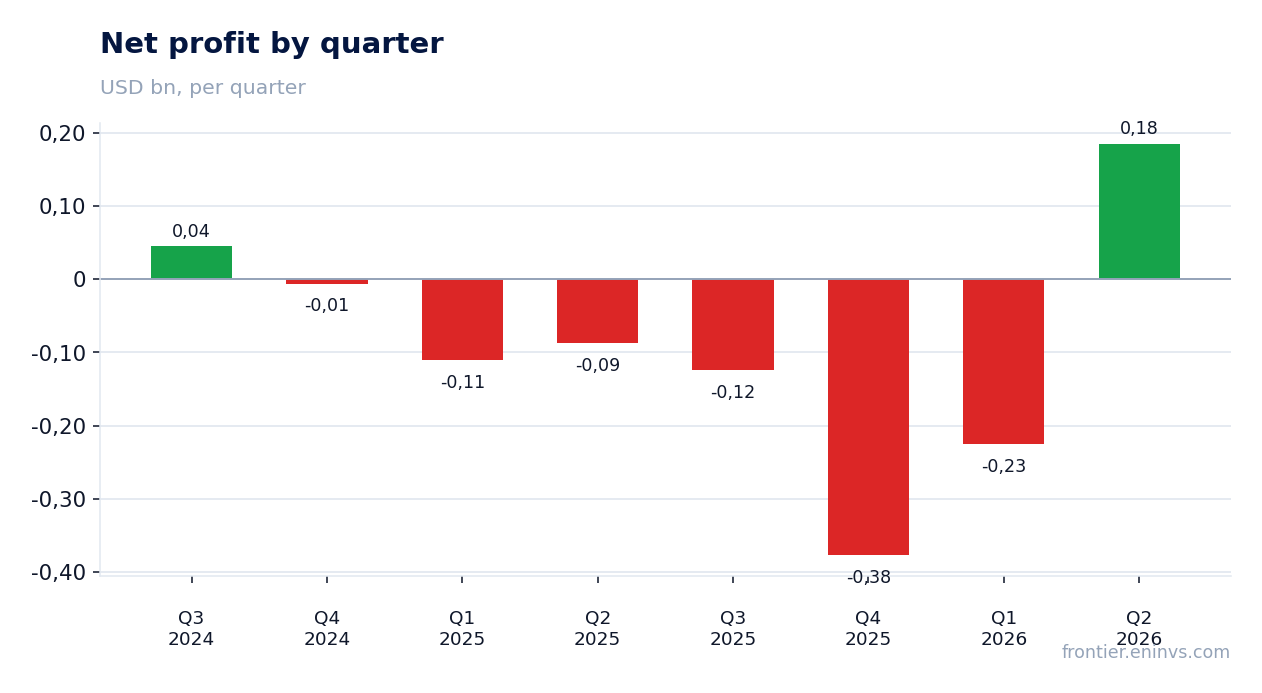
Net income of $185m includes one-off items; adjusted net income was only $68m
Net income in Q2 2026 was $184.8m versus a loss of $87.7m a year earlier. However, this profit includes several one-off items that the company excludes when calculating the adjusted figure.
The main one-off items: a loss on derivatives of $51.8m (non-cash), cash settlements on hedges of $105.4m, a gain on asset sales of $9.4m, and other expenses of $10.2m. After adjustments and the tax effect, adjusted net income was only $68.2m, or $0.11 per share.
Thus, the company's true profitability is significantly lower than reported net income suggests. The difference between reported and adjusted profit – $116.6m – is mainly non-cash and one-off items that will not repeat next quarter, but also do not reflect sustainable earnings power.
Operating cash flow was $175m, but free cash flow for the half-year was negative at $103m
Operating cash flow in Q2 2026 was $175.0m, up 37.6% from $127.2m a year earlier. However, capital expenditures on oil and gas assets were $76.4m, and finance lease payments were $9.7m, resulting in free cash flow of $88.9m for the quarter.
For the first half of 2026, the picture is different: operating cash flow was $281.6m, but capital expenditures reached $163.5m, and lease payments were $15.0m. As a result, free cash flow for the half-year was negative at $103.1m.
The company confirmed its full-year capital expenditure guidance of $350m. This means that to maintain positive free cash flow in the second half, operating cash flow must significantly exceed capital expenditures. For now, the company generates enough cash to cover current expenses but not for growth or debt reduction.
Net debt / EBITDA of 26.6 times trailing twelve months – a level that leaves no room for error
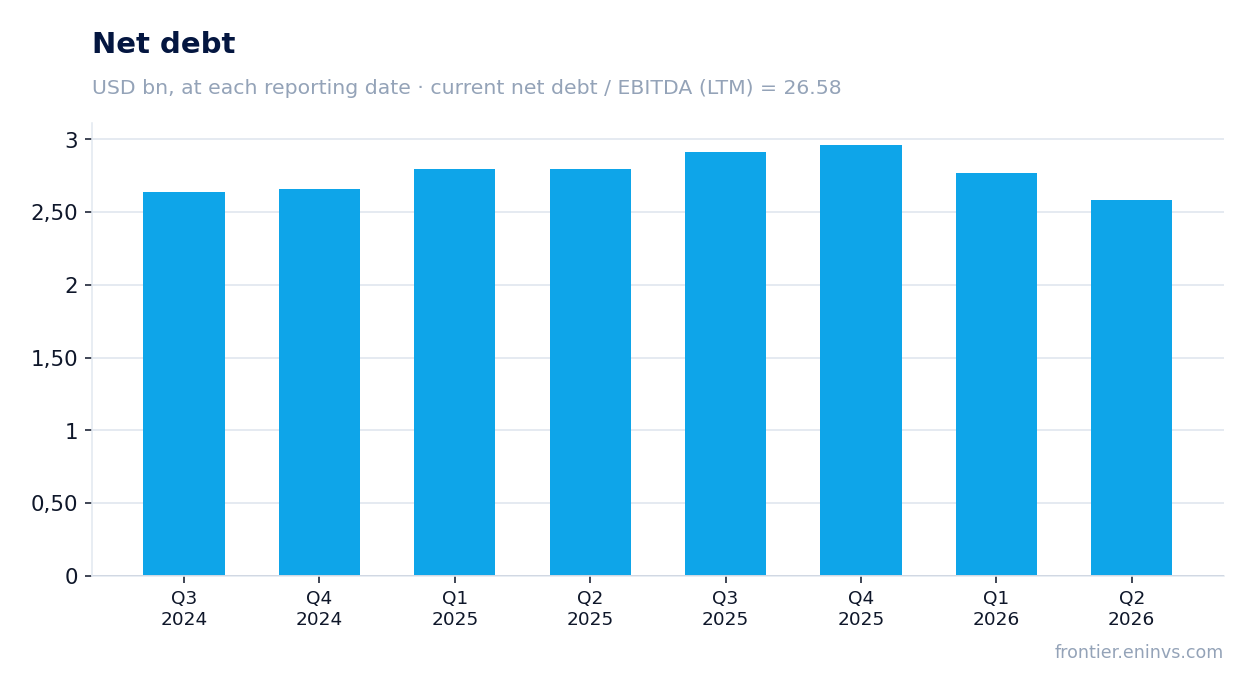
Kosmos Energy's net debt at the end of Q2 2026 was $2.58bn, down from $2.96bn at the end of 2025. The reduction came from the sale of Equatorial Guinea assets and debt repayment from the proceeds.
However, the ratio of net debt to trailing twelve-month EBITDA is 26.6 – a very high level. For comparison, trailing twelve-month EBITDA was only $111.5m, reflecting weak results in previous quarters, including losses in Q4 2025 and Q1 2026.
The company states a goal to reduce debt by 20% this year. In the first half, net debt has already fallen by more than $400m. However, even with this reduction, the burden remains critical. Interest expenses for the quarter were $53.7m, comparable to operating profit.
The sale of Equatorial Guinea assets brought in $127m and reduced debt, but production fell by 1,000 boepd
On 16 June Kosmos Energy completed the sale of its 40.375% interest in the Ceiba and Okume fields in Equatorial Guinea to Panoro Energy. The final cash consideration was approximately $127m after adjustments, and these funds were used to repay borrowings under the RBL.
The deal reduced the company's production by about 1,000 boepd in Q2, as the assets were only included until 16 June. Overall production in Equatorial Guinea was 5,100 boepd net for the period.
The asset sale is part of the company's strategy to concentrate capital on lower-cost, higher-return projects. However, it also means the loss of stable cash flow that helped service debt. The company now depends more on projects in Ghana and GTA.
A valuation of 38.9 times trailing twelve-month EBITDA is not justified with negative free cash flow and high debt
With a market capitalisation of $1.37bn and net debt of $2.58bn, EV/EBITDA for the trailing twelve months is 38.9. This is a very high multiple, reflecting the low EBITDA base over the last twelve months – only $111.5m.
For comparison, EBITDA was significantly higher in previous years. For example, in Q3 2024 EBITDA was $229.4m, and in Q4 2024 it was $113.1m. Q4 2025 was weak (a loss of $224.8m) and Q1 2026 was also weak (a loss of $118.6m).
The current multiple does not reflect the recovery in profitability that began in Q2 2026. If EBITDA remains at $408m per quarter, annual EBITDA would be about $1.6bn, and the multiple would fall to about 2.5. However, the sustainability of this level is questionable given oil price volatility and high hedging costs.
Valuation on the latest reported figures
| Metric | Value |
|---|---|
| Market cap | 1.37 bn USD |
| EV/EBITDA (LTM) | 38.9 |
| P/B | 2.59 |
| Net debt / EBITDA (LTM) | 26.58 |
| Operating cash flow (LTM) | 0.13 bn |
| ROE | 121.2% |
Bottom line
In Q2 2026 Kosmos Energy showed a strong recovery in revenue and EBITDA, but a significant portion of this growth was consumed by hedge settlements and one-off items. Reported net income of $185m looks impressive, but adjusted profit was only $68m, and free cash flow for the half-year remained negative. Debt burden at 26.6 times trailing twelve-month EBITDA remains critical, despite debt reduction from asset sales. At the current price the stock trades at 38.9 times trailing twelve-month EBITDA, which is not justified by current profitability or cash flow. Verdict – unattractive: a change in assessment would require sustainable positive free cash flow and further debt reduction.
Open the company's financial profile KOS →
See also: market overview · valuation map · stock screeners