Ramaco Resources: loss narrowed, but the value came from rare earths, not coal
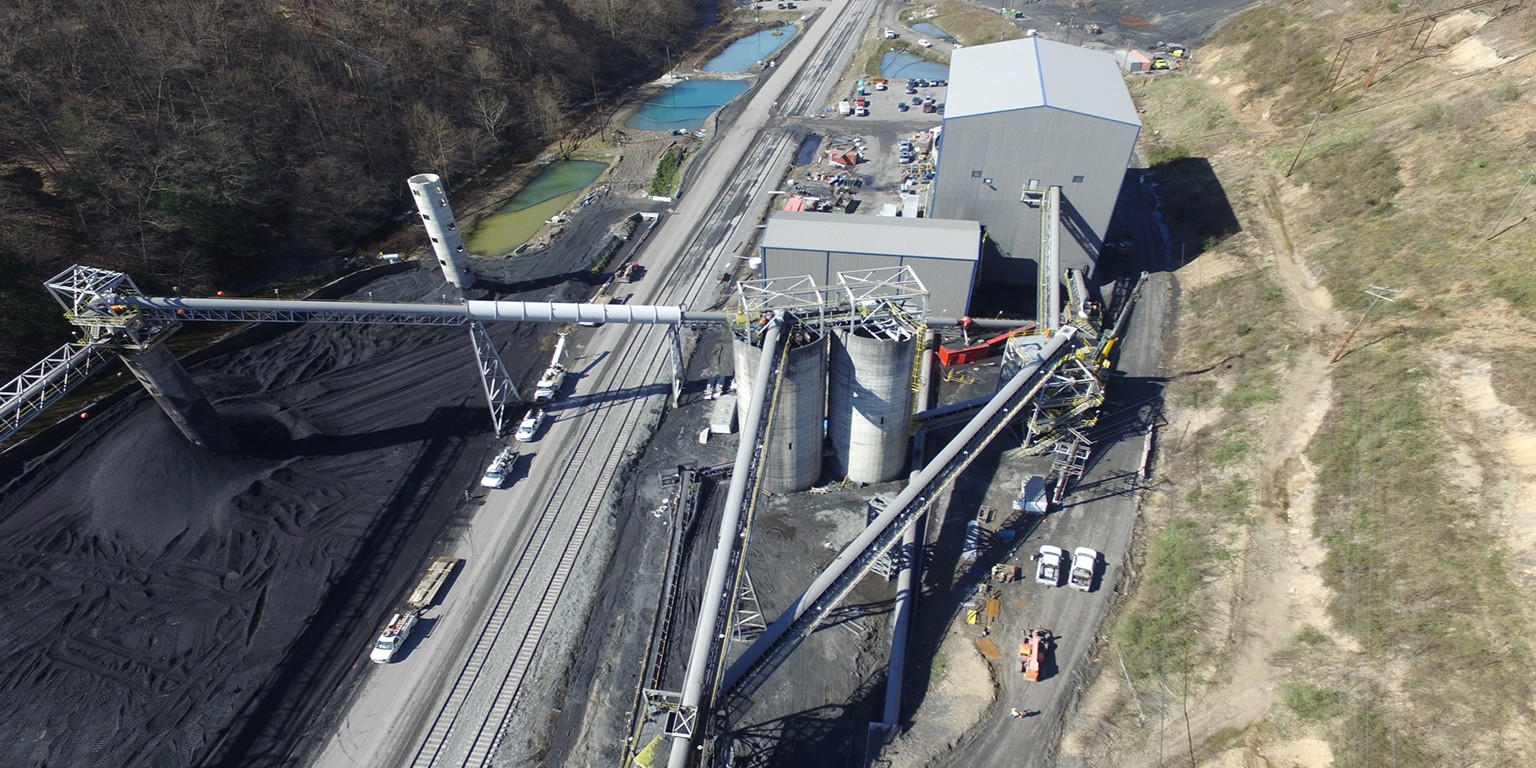
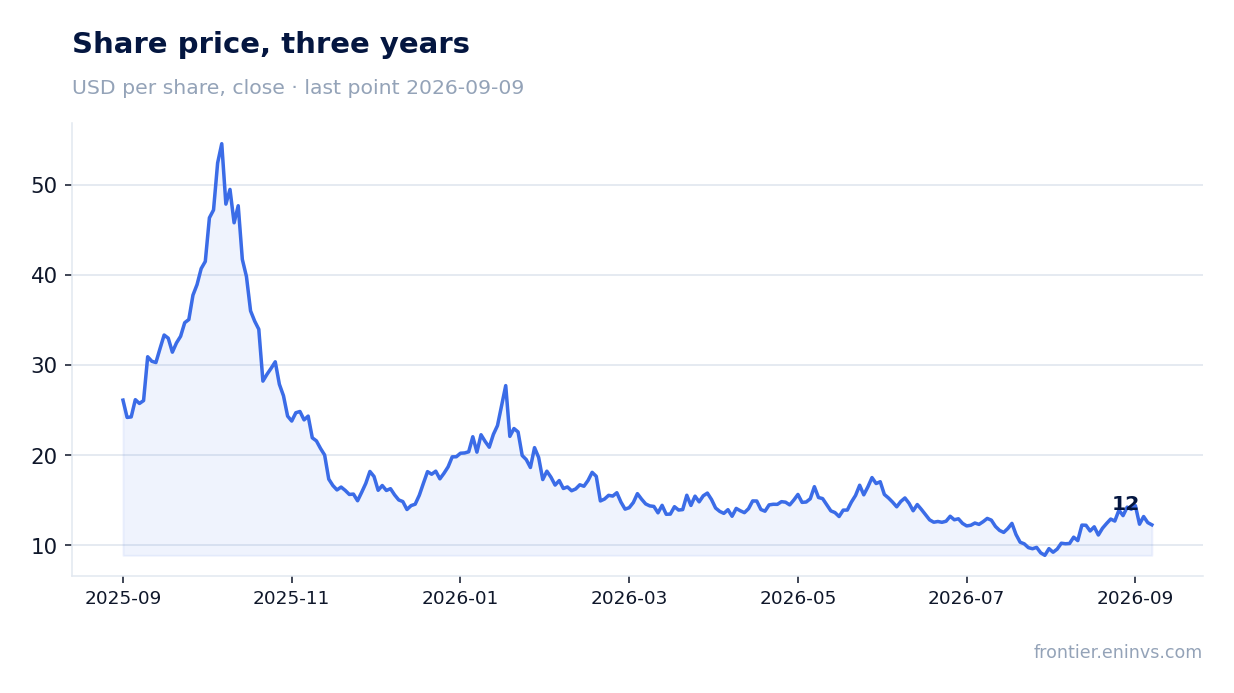
On 4 August Ramaco Resources reported second-quarter 2026 results. Revenue fell 5.3% year on year to $144.8 million, the net loss was $15.4 million, and reported EBITDA stayed negative at minus $1.4 million. Adjusted EBITDA, which the company calculates excluding one-off items, turned positive at $5.7 million, and on that basis the stock gained 8.3% on the release day and 38.0% from the release to 9 September. The share looks rather attractive: the market is paying for the Brook Mine rare earth project, not for the coal business, which remains loss-making.
Key takeaways
— Revenue has fallen for five straight quarters, but the decline slowed to 5.3%
— Adjusted EBITDA of $5.7 million is not profit but a return to positive territory
— Debt rose to $185.9 million, but liquidity of $400.1 million covers it
— The company bought back more than 8% of Class A shares for $66 million
— The Brook Mine rare earth project is valued at $8 billion NPV, and that is what holds the share price
— Production guidance was cut, but cash cost remains below $100 per ton for the fourth consecutive quarter
Attractiveness
Key figures, USD bn
| Metric | Q2 2025 | Q2 2026 | Change |
|---|---|---|---|
| Revenue | 0.15 | 0.14 | -5.3% |
| EBITDA | 0.00 | 0.01 | +78.5% |
| Operating profit | -0.01 | -0.02 | — |
| Net profit | -0.01 | -0.02 | — |
| Operating cash flow | -0.00 | 0.01 | to profit |
| Capex | 0.02 | 0.03 | +69.3% |
| EBITDA margin | 2.1% | 3.9% | +1.8 pp |
| Net margin | -9.1% | -10.6% | -1.5 pp |
Revenue has fallen for five straight quarters, but the decline slowed to 5.3%
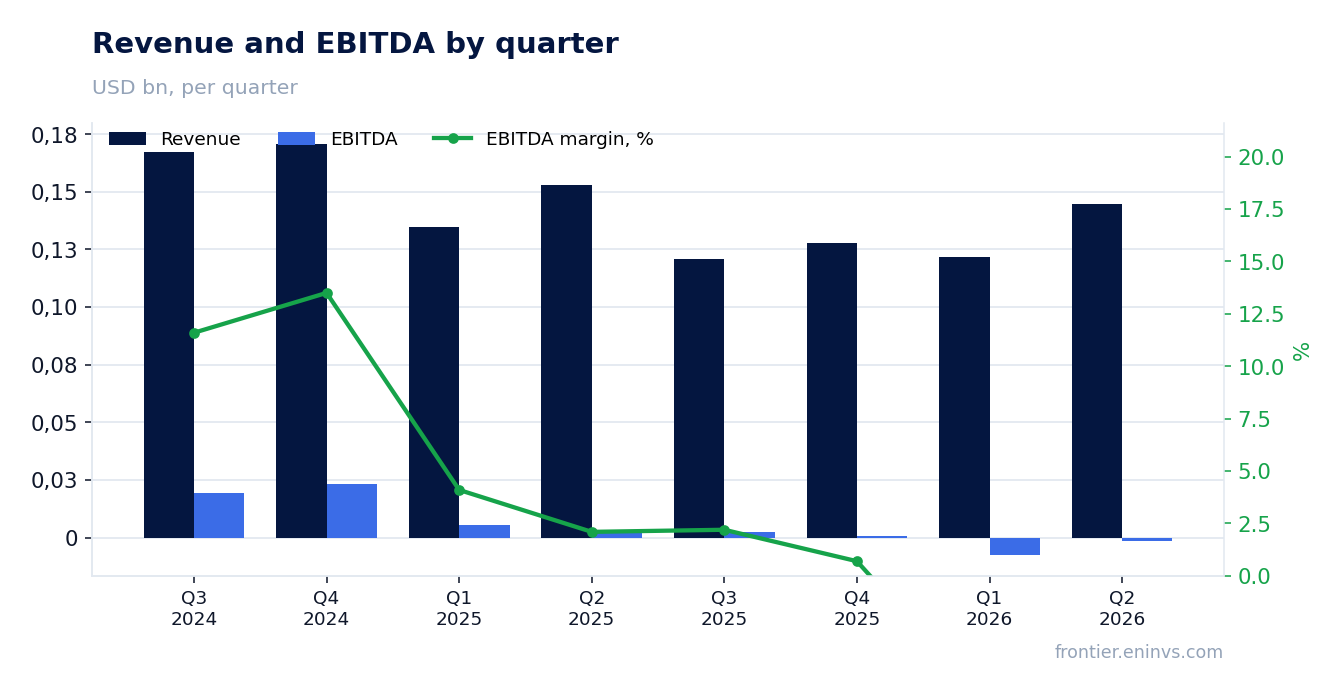
In the second quarter of 2026 revenue was $144.8 million, 5.3% below the year-earlier level. This is the fifth consecutive quarterly decline: in the first quarter of 2025 the drop was 22.0%, in the second 1.5%, in the third 27.7%, in the fourth 25.1%, and in the first quarter of 2026 9.7%. The slowdown is due to the base effect, not to rising prices: revenue was already low a year ago.
Sales volume rose 18% from the first quarter of 2026 to 1,056 thousand tons, but the average realised price fell to $116 per ton from $123 a year earlier. The company attributes the 6% price decline to weaker high-vol indices: the U.S. high-vol index lost 6% year on year, while the Australian premium low-vol rose 29% and the U.S. low-vol almost 10%.
Coal production fell 7% year on year to 931 thousand tons due to the idling of high-cost mines. The company is deliberately cutting high-vol output to avoid selling at a loss and is shifting towards more profitable low-vol coal.
Adjusted EBITDA of $5.7 million is not profit but a return to positive territory
Adjusted EBITDA in the second quarter of 2026 was $5.7 million against negative $1.8 million in the first quarter. A year earlier it was $9.0 million, so it fell 37% year on year. The company defines it as earnings before interest, taxes, depreciation, equity-based compensation and one-off items.
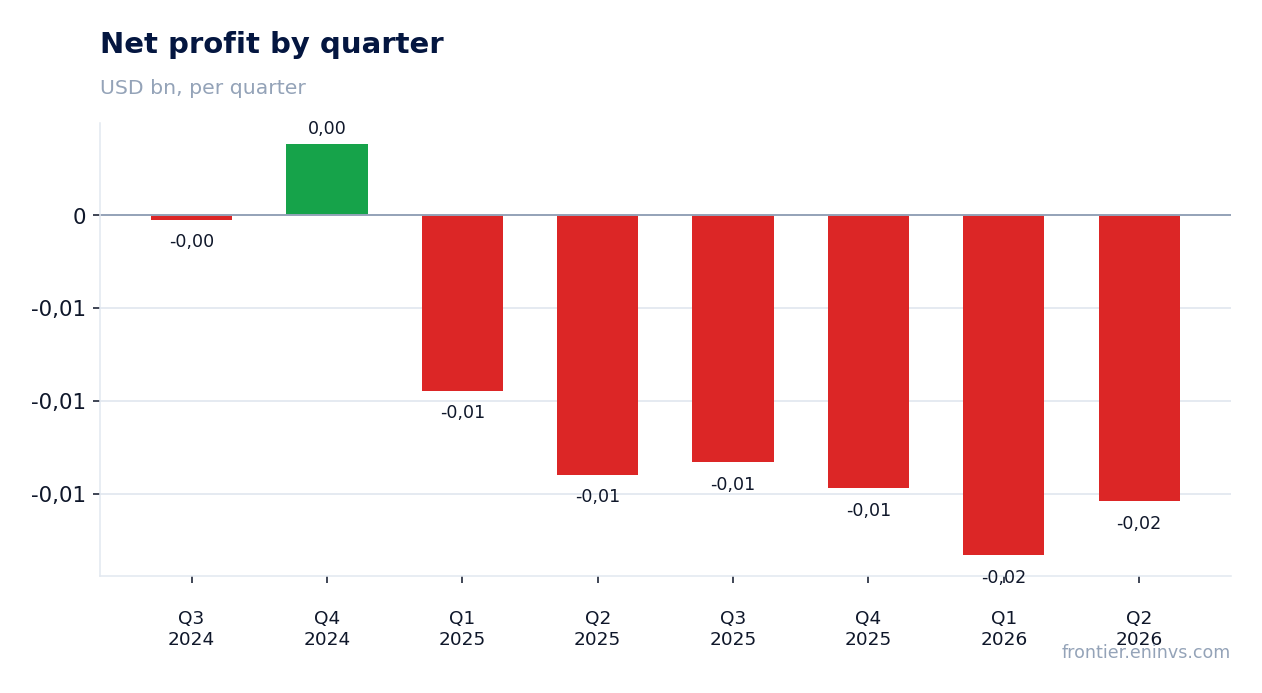
Reported EBITDA remained negative at minus $1.4 million, and the operating loss was $18.2 million. The gap between reported and adjusted EBITDA is mainly due to non-cash equity-based compensation and write-offs that the company treats as one-off. The net loss was $15.4 million, or minus $0.26 per Class A share.
The adjusted EBITDA margin is positive but thin: 3.9% against 2.1% a year earlier. The margin improvement on falling revenue is explained by cash cost falling to $99 per ton – the fourth consecutive quarter below $100. The company notes diesel prices rose about 33% from the first quarter, but productivity gains offset the cost increase.
Debt rose to $185.9 million, but liquidity of $400.1 million covers it
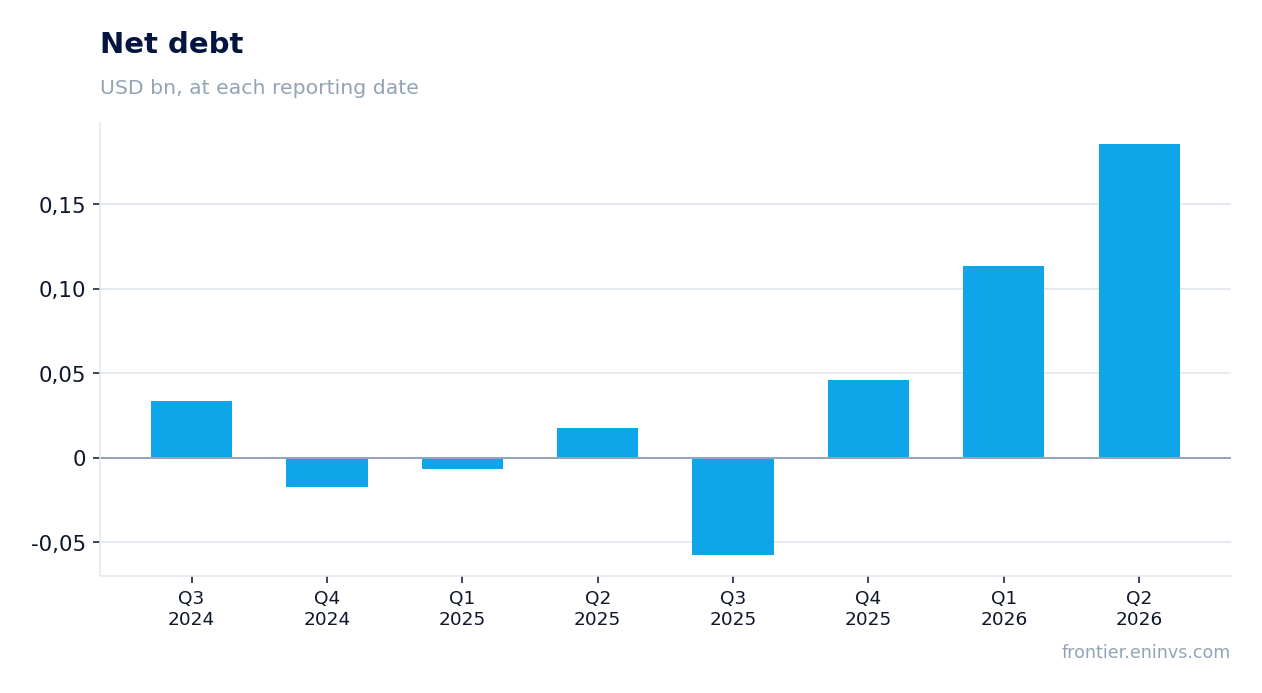
Net debt at the end of the second quarter of 2026 was $185.9 million, up from $113.6 million at the end of the first quarter. The increase is due to $51 million of share buybacks and $27.4 million of capital expenditure. At the same time liquidity stands at $400.1 million, including $282.5 million of cash and $117.6 million of available credit lines.
Operating cash flow in the second quarter was positive at $12.2 million, while in the first quarter it was negative at minus $34.6 million. For the first half of 2026 operating cash flow remains negative at minus $22.4 million, driven by inventory build and lower accounts payable.
The company retains access to its credit facility with zero borrowings at quarter-end. Interest expense fell to $1.5 million from $2.8 million a year earlier, reflecting lower cost of debt servicing.
The company bought back more than 8% of Class A shares for $66 million
In the second quarter Ramaco repurchased 3.5 million Class A shares on the open market at an average price of $14.41 per share, spending about $51 million. Year to date it has bought back nearly 4.6 million shares at an average price of $14.44 for a total of about $66 million. That is more than 8% of Class A shares outstanding.
The buyback was funded from liquidity, which stood at $400.1 million at quarter-end. The company considers the share price undervalued and calls the buyback a prudent use of capital. As a result treasury stock reached $66.3 million and shareholders' equity fell to $376.1 million.
The reduction in share count supports earnings per share, but with losses the effect is limited. The company intends to continue buybacks depending on market conditions.
The Brook Mine rare earth project is valued at $8 billion NPV, and that is what holds the share price
On 29 July 2026 Ramaco published a conceptual study for the Brook Mine project prepared by Hatch Associates. Internal modelling based on Hatch data shows a potential net present value of $8 billion and average annual adjusted EBITDA of $1.3 billion. That is materially higher than the previous Fluor report estimates.
Preliminary capital cost for construction is $3.2 billion plus about $0.8 billion contingency. Initial production is expected in 2031. The company plans further optimisation to reduce timing and costs.
The project remains at the exploration stage, and the company warns there is no guarantee of commercial development. Nevertheless the market values the stock on Brook Mine potential: from the release to 9 September the share gained 38.0%. Market capitalisation is $638.1 million, 12.5 times less than the stated project NPV.
Production guidance was cut, but cash cost remains below $100 per ton for the fourth consecutive quarter
The company cut its 2026 production guidance to 3.6–3.9 million tons from 3.7–4.1 million tons due to weakness in the high-vol market. Sales guidance was reduced to 4.0–4.3 million tons from 4.1–4.5 million tons. At the same time cash cost guidance was maintained at $96–99 per ton despite lower expected production.
Cash cost in the second quarter was $99 per ton, 4% lower than a year earlier. This is the fourth consecutive quarter below $100. The company attributes this to productivity gains and places itself in the first quartile of the U.S. cost curve.
Capital expenditure in the quarter rose 81% year on year to $27.4 million due to the development of low-vol projects at Maben and Berwind. Full-year capex guidance was raised to $92–97 million from $85–90 million. The company expects the new projects to add more than 1 million tons of low-vol coal annually by 2027.
Valuation on the latest reported figures
| Metric | Value |
|---|---|
| Market cap | 0.64 bn USD |
| P/B | 1.32 |
| Operating cash flow (LTM) | 0.00 bn |
| ROE | -15.2% |
Bottom line
The main story of the second quarter is not coal but the rare earth project. The coal business narrowed its adjusted EBITDA loss to $5.7 million, but reported EBITDA remained negative and revenue has fallen for five straight quarters. The company bought back more than 8% of shares, which supported the stock, but debt rose to $185.9 million. The market is paying for Brook Mine potential, valued at $8 billion NPV, 12.5 times the current market capitalisation. The question for a holder is whether the company can bridge to 2031 without dilution and preserve liquidity while the coal business is loss-making.
Open the company's financial profile METC →
See also: market overview · valuation map · stock screeners