Martin Midstream Partners: profit returned, but almost all of it came from asset sales
On July 22, Martin Midstream Partners reported second-quarter 2026 results. Revenue rose 18.2% year on year to $213.6 million, adjusted EBITDA added 1.4% to $27.9 million, and net income came in at $2.6 million versus a $2.4 million loss a year earlier. However, profit rests on a one-off $4.7 million gain on asset sales, and free cash flow remains negative. With an EV/EBITDA of 6.47 and a dividend yield of 0.91%, the unit looks neutral: leverage at 5.53x LTM EBITDA and weak cash flow outweigh the improved reported figures.
Key takeaways
— Revenue rose 18.2%, but almost all of the gain came from one segment – Specialty Products
— Adjusted EBITDA added only 1.4% as growth in three segments was offset by weakness in fertilizer
— Net income of $2.6 million rests on a one-off $4.7 million gain on asset sales
— Operating cash flow halved, and free cash flow is negative again
— Leverage at 5.53x LTM EBITDA with interest expense consuming nearly all operating profit
— The $0.005 per unit distribution yields 0.91% – below the key rate and barely covered by cash flow
— The 6.47x EV/EBITDA LTM valuation leaves no margin of safety with negative free cash flow
Attractiveness
Key figures, USD bn
| Metric | Q2 2025 | Q2 2026 | Change |
|---|---|---|---|
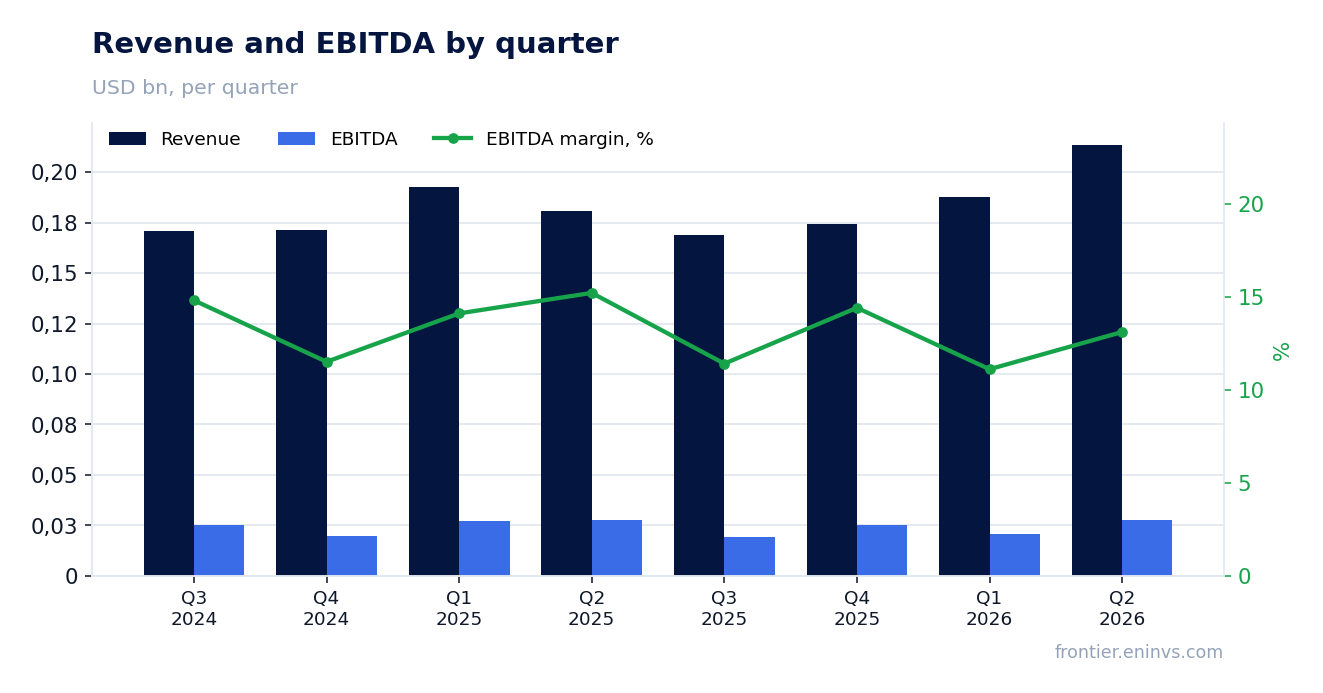
| Revenue | 0.18 | 0.21 | +18.2% |
| EBITDA | 0.03 | 0.03 | +1.4% |
| Operating profit | 0.01 | 0.02 | +29.4% |
| Net profit | -0.00 | 0.00 | to profit |
| Operating cash flow | 0.03 | 0.01 | -60.5% |
| Capex | 0.01 | 0.01 | +79.2% |
| EBITDA margin | 15.2% | 13.1% | -2.1 pp |
| Net margin | -1.3% | 1.2% | +2.5 pp |
Revenue rose 18.2%, but almost all of the gain came from one segment – Specialty Products
Second-quarter 2026 revenue came in at $213.6 million, up 18.2% year on year. That looks sharp against the near-flat trend of previous quarters: revenue fell 2.5% in Q1 2026, rose 1.7% in Q4 2025, and fell 1.3% in Q3 2025. The main driver was Specialty Products, where sales jumped 38% to $83.1 million. Other segments grew far more modestly: Transportation added 6%, Terminalling and Storage 6%, and Sulfur Services 13%.
Specialty Products growth was driven primarily by volumes: NGL sales rose 6% to 605 thousand barrels, and other specialty products volumes rose 20% to 107 thousand barrels. Prices also played a role, but the company does not break out their dynamics separately. Importantly, this is the largest segment by revenue, so even moderate volume growth makes a noticeable contribution to the total.
In Sulfur Services, revenue rose 13% to $50.1 million, but here growth was entirely price-driven: sales volumes fell 26% to 161 thousand long tons. That is a warning sign – fertilizer demand is weak, and the company is offsetting volume declines with higher prices, which further pressures farmer affordability.
Adjusted EBITDA added only 1.4% as growth in three segments was offset by weakness in fertilizer
Second-quarter 2026 adjusted EBITDA came in at $27.9 million, up 1.4% from $27.1 million a year earlier. The 18.2% revenue growth barely converted into EBITDA because cost of products sold surged: up 41% in Specialty Products and 27% in Sulfur Services. As a result, the EBITDA margin fell to 13.1% from 15.2% a year earlier.
Three of the four segments posted EBITDA growth. Terminalling and Storage added $1.1 million on higher throughput volumes at the underground NGL storage facility. Specialty Products increased EBITDA by $1.0 million – lubricants rose $1.4 million, but grease fell $0.7 million. Transportation declined $0.5 million: the offshore division lost $1.0 million due to downtime for regulatory inspections, partly offset by a $0.4 million gain in the inland division.
The main negative came from Sulfur Services, where EBITDA fell $1.0 million. In fertilizer, EBITDA collapsed by $4.6 million on margin compression: higher sulfur and ammonia costs pushed fertilizer prices up, reducing farmer affordability. Pure sulfur partly offset the decline, adding $3.1 million on higher prices. The company expects fertilizer weakness to persist through the rest of the year.
Net income of $2.6 million rests on a one-off $4.7 million gain on asset sales
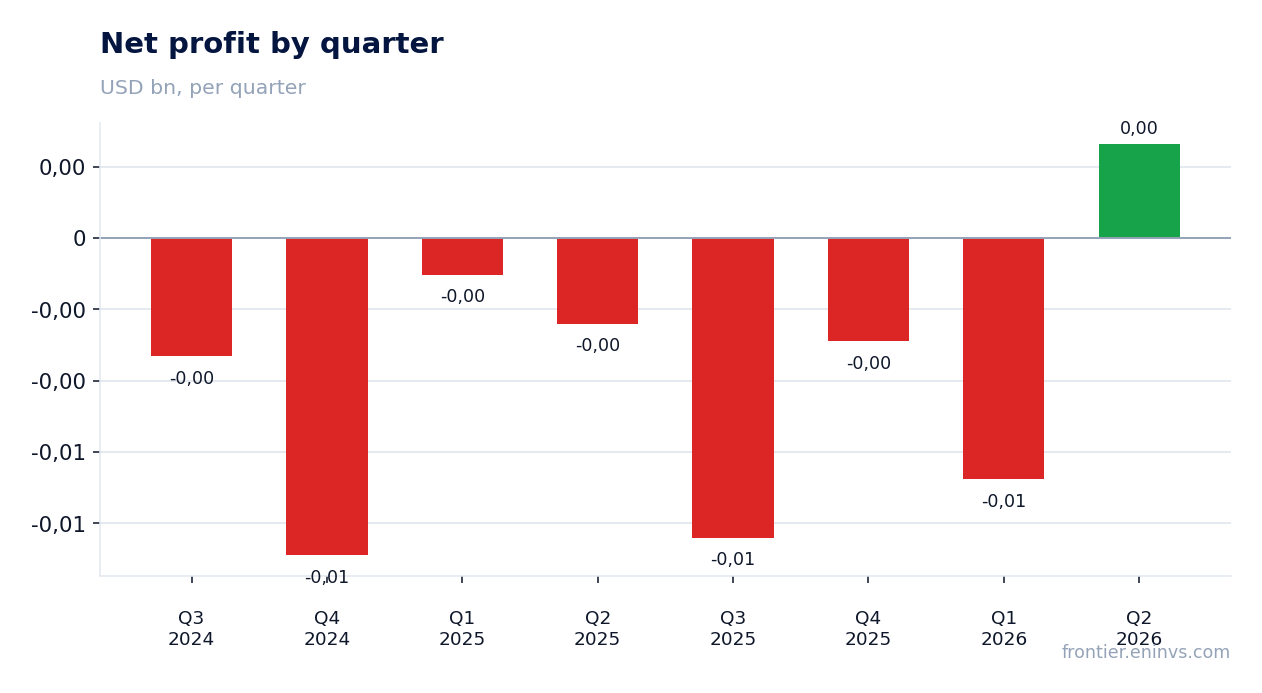
Second-quarter 2026 net income was $2.6 million versus a $2.4 million loss a year earlier. However, operating income of $19.3 million includes a $4.7 million gain on asset sales – without this one-off, profit would have been near zero. A year earlier, such gains were only $0.6 million.
Operating income rose to $19.3 million from $14.9 million, but that increase is almost entirely due to the one-off gain. Interest expense remains huge at $14.5 million for the quarter, consuming nearly all operating profit. As a result, pre-tax income was only $4.5 million, and after tax, $2.6 million. The net margin was 1.2% versus negative 1.3% a year earlier.
EBITDA adjusted for one-off items rose only 1.4%, confirming that the underlying business barely improved. The one-off gain on asset sales is not a sustainable source of profit, and its absence next quarter could push the company back into loss.
Operating cash flow halved, and free cash flow is negative again
Second-quarter 2026 operating cash flow was $12.2 million, down 60% from $30.9 million a year earlier. For the first half of 2026, operating cash flow is negative – minus $1.6 million versus plus $24.9 million a year earlier. The reason is a $13.9 million increase in accounts receivable and a $10.1 million increase in inventories, linked to higher sales volumes in Specialty Products.
Distributable cash flow in the second quarter was only $2.1 million versus $6.7 million a year earlier. After deducting expansion capital expenditures and finance lease payments, adjusted free cash flow was negative – minus $0.9 million. For the half-year, negative free cash flow reached $6.9 million.
Capital expenditures in the first half of 2026 rose to $17.0 million for property, plant and equipment and $9.4 million for the planned turnaround at the Smackover refinery. The company notes that the bulk of the year's capital expenditures has already been incurred. This means pressure on cash flow may ease in the second half, but free cash flow remains negative for now.
Leverage at 5.53x LTM EBITDA with interest expense consuming nearly all operating profit
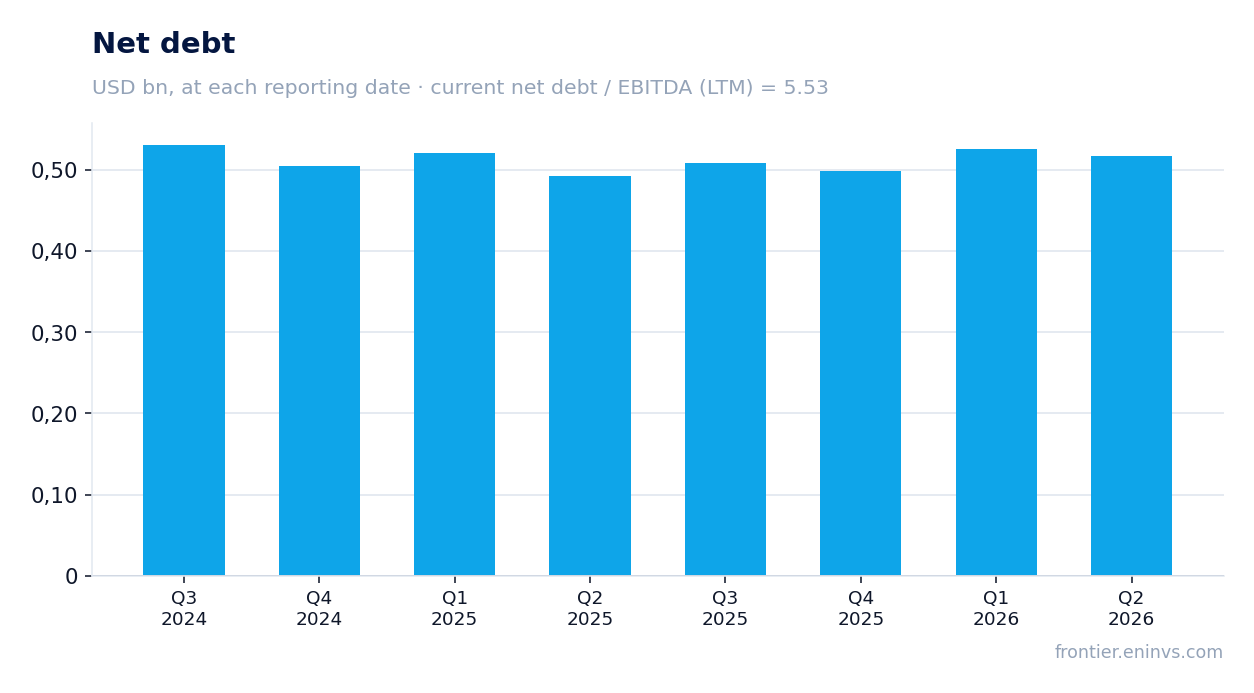
Net debt at the end of Q2 2026 was $517.5 million, equivalent to 5.53x LTM EBITDA. That is a high level for a company with negative free cash flow. Total debt on the balance sheet is $462.0 million, including $400.0 million of 11.50% senior secured notes and $62.0 million under the revolving credit facility. The company does not disclose the ratio's direction, so we state it as a level, not a trend.
Interest expense for the quarter was $14.5 million, nearly equal to operating income of $19.3 million. This means almost all operating income goes to debt service. The interest coverage ratio under the credit agreement is 1.79x, close to the minimum threshold. The company is in compliance with all covenants, but the margin of safety is thin.
Liquidity under the revolving credit facility is $48.3 million against total capacity of $115.0 million. That is sufficient for current needs, but if market conditions deteriorate, the company could face constraints. High leverage remains the main risk for unitholders.
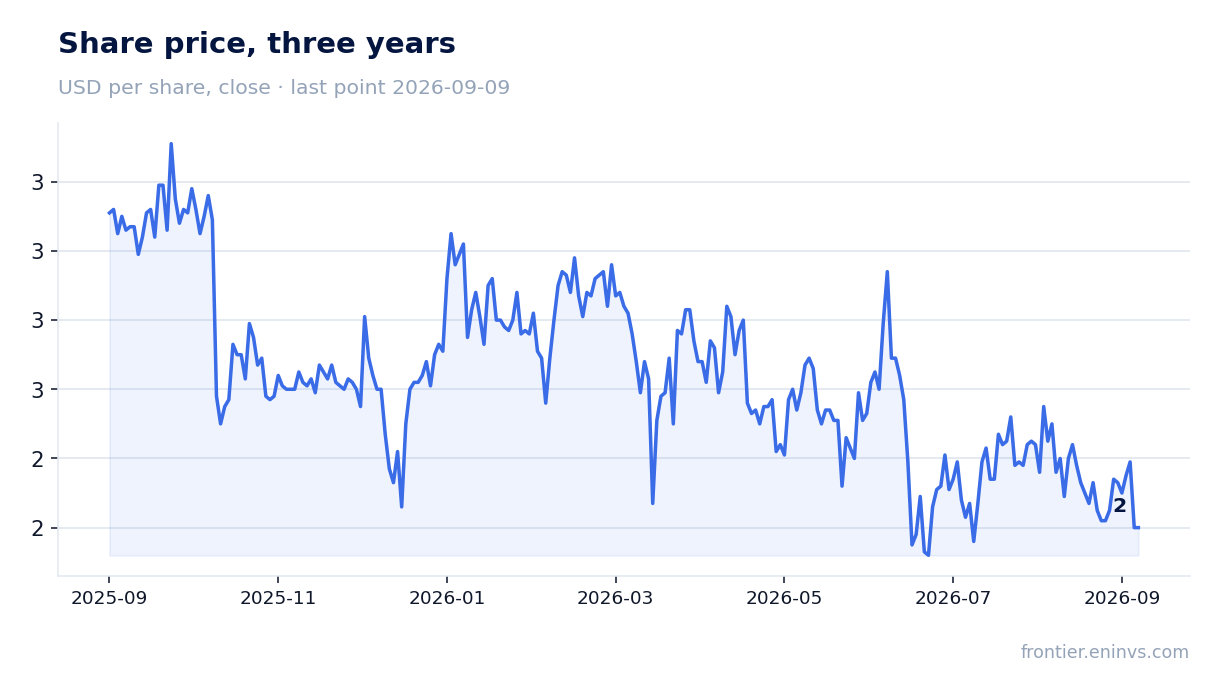
The $0.005 per unit distribution yields 0.91% – below the key rate and barely covered by cash flow
Martin Midstream Partners declared a quarterly distribution of $0.005 per unit for Q2 2026. The payment is due on August 14, 2026. At the current unit price, the trailing 12-month dividend yield is 0.91%. That is well below the key rate and does not compensate for the risks associated with high leverage.
Dividend coverage is weak: distributable cash flow for the quarter was $2.1 million, while the distribution requires about $0.2 million. Formally, coverage exists, but after deducting expansion capital expenditures, free cash flow is negative. The company is keeping the payout minimal to preserve liquidity.
Our estimate for the current year is that the quarterly distribution will remain at $0.005, giving an annual payout of about $0.02 per unit. That corresponds to the current 0.91% yield. To increase the payout, the company would need to improve free cash flow and reduce leverage. There are no prerequisites for that yet.
The 6.47x EV/EBITDA LTM valuation leaves no margin of safety with negative free cash flow
The trailing 12-month EV/EBITDA multiple is 6.47. For comparison, the company's three-year historical range is not available in the provided data, so we cannot compare the current level with its average. However, with negative free cash flow and high leverage, even this multiple does not look cheap.
Market capitalisation is $85.6 million, which with net debt of $517.5 million gives an enterprise value of about $603 million. The ratio of net debt to LTM EBITDA is 5.53x, above the comfort level for most investors. Return on equity is negative at minus 11.6%, reflecting losses over the past 12 months.
To improve its valuation, the company needs to grow EBITDA and reduce debt. For now, the multiple reflects hope for recovery rather than current profitability. Without sustainable cash flow growth, the unit is unlikely to be re-rated by the market.
Valuation on the latest reported figures
| Metric | Value |
|---|---|
| Market cap | 0.09 bn USD |
| EV/EBITDA (LTM) | 6.5 |
| Net debt / EBITDA (LTM) | 5.53 |
| Operating cash flow (LTM) | 0.05 bn |
| ROE | -11.6% |
| Dividend yield (12m) | 0.9% |
Bottom line
In Q2 2026, Martin Midstream Partners showed 18.2% revenue growth and returned to net income of $2.6 million. However, profit was almost entirely due to a one-off $4.7 million gain on asset sales, while adjusted EBITDA rose only 1.4%. Operating cash flow halved, free cash flow is negative, and leverage stands at 5.53x LTM EBITDA. The $0.005 per unit distribution yields 0.91%, below the key rate. With an EV/EBITDA of 6.47 and no sustainable cash flow growth, the unit looks neutral: the current valuation offers no margin of safety, and leverage risks remain high.
Open the company's financial profile MMLP →
See also: market overview · valuation map · stock screeners