The Mosaic Company: Q2 2026 loss of $272.8 million, but adjusted EBITDA stayed positive

On August 4, The Mosaic Company reported Q2 2026 results. Revenue declined 6.0% year-on-year to $2,824.1 million, net loss was $272.8 million versus a profit of $410.7 million a year earlier, and adjusted EBITDA fell 19.6% to $407.5 million. The loss was largely driven by one-off write-offs and negative revaluation; excluding them, the company remains profitable at the operating level. The stock trades at EV/EBITDA LTM of 12.4 versus its own three-year average of 6.8, making the valuation stretched relative to history, so at the current price the share looks rather unattractive.
Key takeaways
— Revenue fell 6.0% year-on-year, but phosphate sales grew on price
— The Q2 2026 loss of $272.8 million is almost entirely explained by one-off items
— Adjusted EBITDA remained positive, but its margin declined to 14.4%
— Debt rose to $5,718.4 million, with net debt/EBITDA LTM at 4.62
— Operating cash flow remains positive, but capital expenditures almost fully absorb it
— Dividend yield of 2.52% with a payout ratio that may rise due to losses
— Valuation at EV/EBITDA LTM of 12.4 is well above its own three-year average of 6.8
Attractiveness
Key figures, USD bn
| Metric | Q2 2025 | Q2 2026 | Change |
|---|---|---|---|
| Revenue | 3.01 | 2.82 | -6.0% |
| EBITDA | 0.51 | 0.41 | -19.6% |
| Operating profit | 0.24 | -0.04 | -114.5% |
| Net profit | 0.41 | -0.27 | -166.4% |
| Operating cash flow | 0.61 | 0.17 | -72.6% |
| Capex | 0.30 | 0.32 | +5.2% |
| EBITDA margin | 16.8% | 14.4% | -2.4 pp |
| Net margin | 13.7% | -9.7% | -23.4 pp |
Revenue fell 6.0% year-on-year, but phosphate sales grew on price
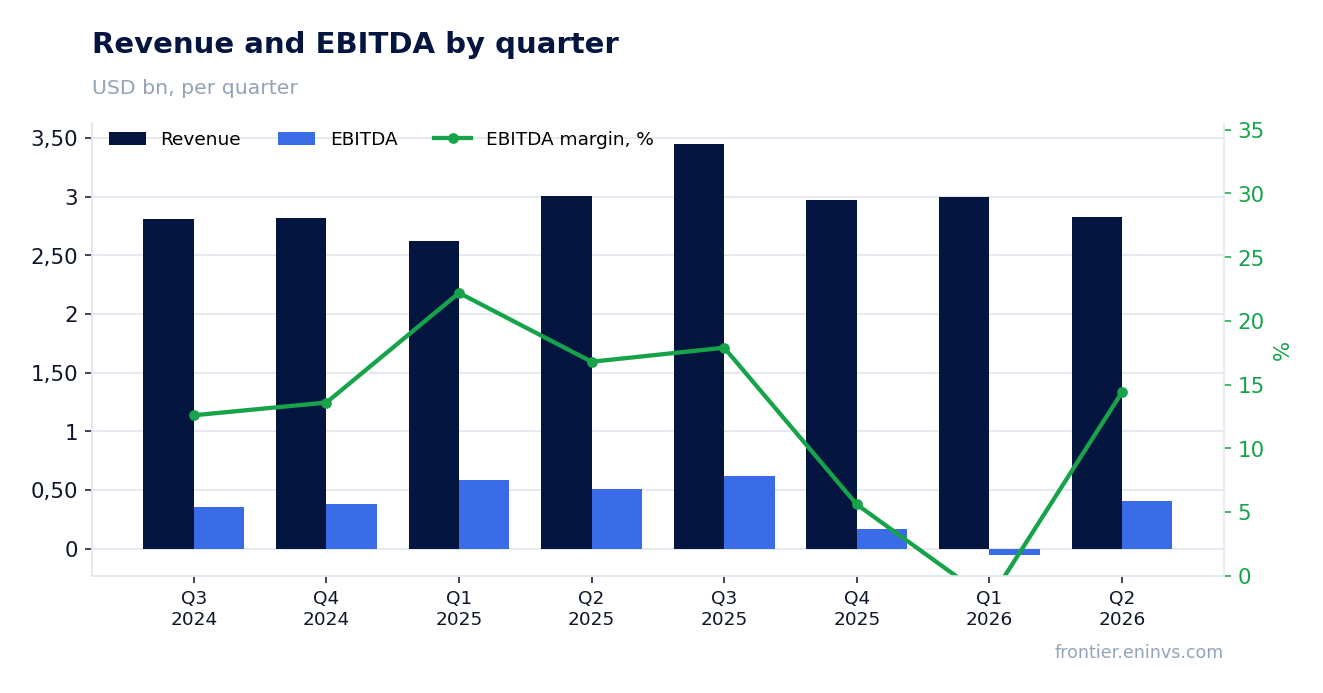
Q2 2026 revenue was $2,824.1 million, down 6.0% year-on-year. The decline was mainly driven by the Mosaic Fertilizantes segment, where sales fell to $1,034 million from $1,175 million a year earlier, and the corporate segment, which showed negative revenue of minus $106 million. Phosphate sales rose to $1,246 million from $1,173 million, while potash sales declined to $650 million from $710 million.
In the phosphate segment, the average selling price rose to $754 per tonne from $665 a year earlier, offsetting a decline in sales volumes to 1,406 thousand tonnes from 1,546 thousand tonnes. In the potash segment, the price also rose to $280 per tonne from $274, but sales volumes fell to 2,019 thousand tonnes from 2,343 thousand tonnes. In Brazil, the average price rose to $585 per tonne from $474, but total sales volumes declined to 1,520 thousand tonnes from 2,232 thousand tonnes.
Thus, revenue declined due to lower physical volumes, especially in Brazil, where sales fell by nearly a third. The price factor was positive across all segments but could not fully offset the reduction in shipments.
The Q2 2026 loss of $272.8 million is almost entirely explained by one-off items
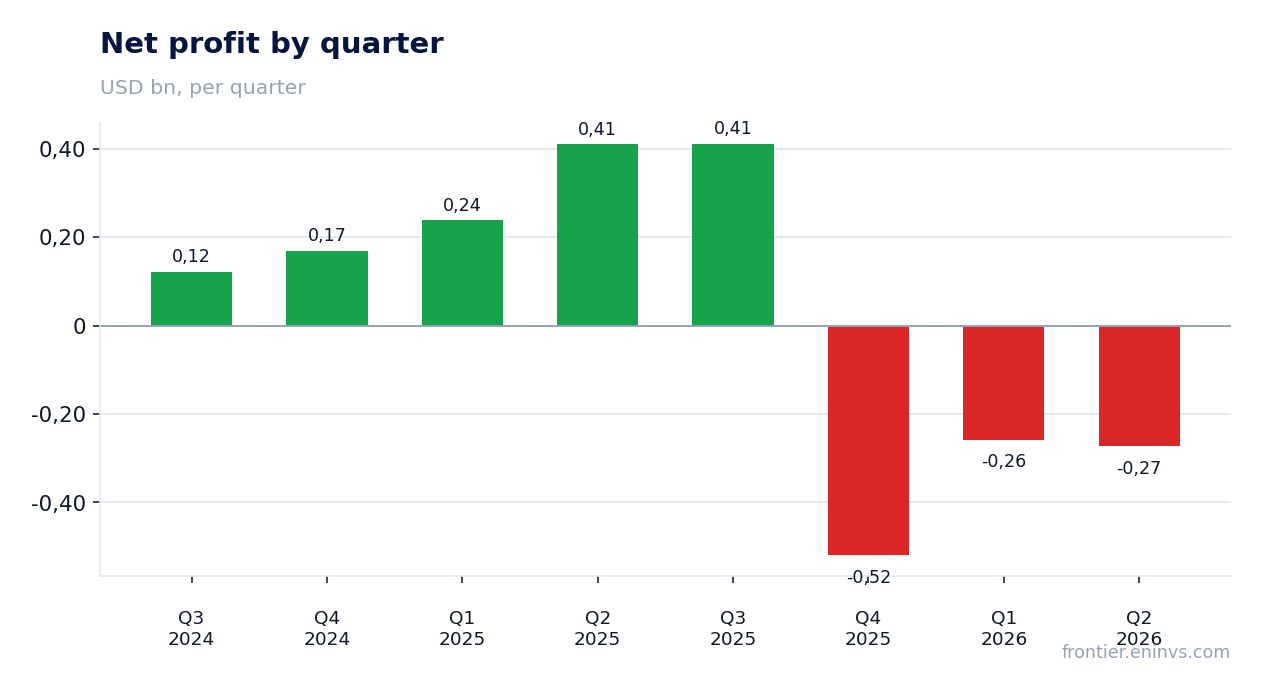
Q2 2026 net loss was $272.8 million versus a profit of $410.7 million a year earlier. However, adjusted diluted EPS was $0.13, while notable items reduced earnings by $0.99 per share. Notable factors included a negative mark-to-market on Ma'aden shares of $162 million, asset write-offs of $69 million, loss on assets held for sale of $9 million, accelerated depreciation of $26 million, and other items.
Operating loss was $35.5 million, but adjusted EBITDA remained positive at $407.5 million. This means the company generates operating profit before one-off write-offs and depreciation. The loss was mainly driven by write-offs and revaluations, not by ongoing operations.
The notable items are mostly non-cash, except for some write-offs. This is important for assessing the sustainability of the business: excluding them, the company remains profitable on an adjusted basis.
Adjusted EBITDA remained positive, but its margin declined to 14.4%
Q2 2026 adjusted EBITDA was $407.5 million, down 19.6% year-on-year. The EBITDA margin declined to 14.4% from 16.8% a year earlier. The margin decline was due to higher costs: in the phosphate segment, cost of goods sold rose to $1,251 million from $1,070 million, and in Mosaic Fertilizantes to $1,028 million from $1,013 million.
In the phosphate segment, gross margin turned negative: minus $5 million versus $103 million a year earlier. This was driven by higher raw material costs: ammonia cost rose to $621 per tonne from $445, and sulfur to $522 from $209. In the potash segment, gross margin remained stable at $207 million versus $209 million, with the margin rate rising to 32% from 29%.
In the Mosaic Fertilizantes segment, gross margin fell to $6 million from $162 million, due to higher costs and lower volumes. Operating margin in Brazil turned negative: minus $41 million versus a profit of $109 million a year earlier. The main pressure on margin came from higher raw material prices and the strengthening of the Brazilian real.
Debt rose to $5,718.4 million, with net debt/EBITDA LTM at 4.62
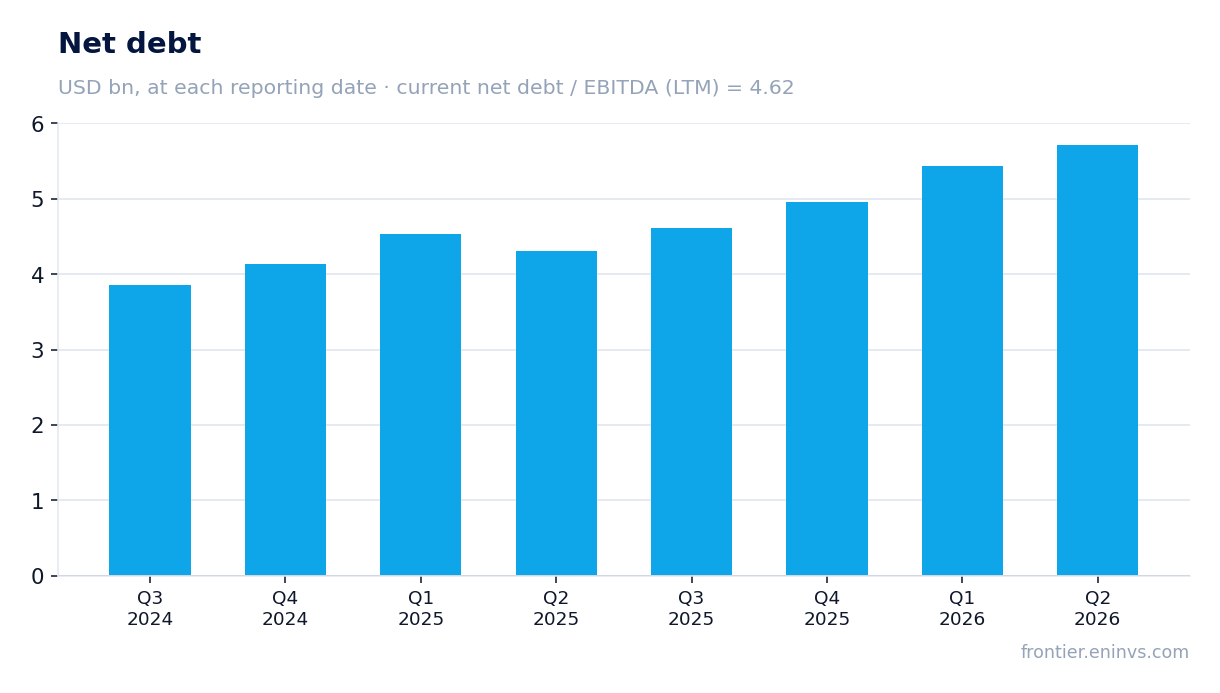
Net debt at the end of Q2 2026 was $5,718.4 million, up from $4,959.8 million at the end of the previous reporting period. The net debt/EBITDA LTM ratio is 4.62. The increase in debt was driven by negative free cash flow and dividend payments.
Total debt includes short-term debt of $1,021 million and long-term debt of $4,834 million. Cash and cash equivalents are $294 million. Interest expense rose to $63 million from $53 million a year earlier, reflecting the increased debt burden.
The debt level of 4.62 EBITDA LTM is high and limits financial flexibility. If EBITDA remains at current levels, further debt growth could lead to covenant breaches, although specific terms are not disclosed.
Operating cash flow remains positive, but capital expenditures almost fully absorb it
Q2 2026 operating cash flow was $167.0 million, significantly lower than $609.5 million a year earlier. Capital expenditures were $320.3 million, resulting in negative free cash flow of minus $153.3 million. Over the trailing twelve months, operating cash flow was $824.8 million, while capital expenditures were about $1,391 million, also indicating negative free cash flow.
The company continues to invest in maintenance and modernization of capacity. In the phosphate segment, capital expenditures were $201 million, in potash – $68 million, and in Mosaic Fertilizantes – $47 million. Despite the loss, the company maintains its investment program.
Negative free cash flow means the company is funding capital expenditures and dividends through debt. This increases pressure on the balance sheet and may require cuts to investments or dividends in the future.
Dividend yield of 2.52% with a payout ratio that may rise due to losses
Over the trailing twelve months, the company paid dividends of $281 million, corresponding to a dividend yield of 2.52% at the current price. Per share, this is approximately $0.88. The company pays dividends quarterly, and the latest quarterly dividend was $0.22 per share.
Given the Q2 2026 loss of $272.8 million, the payout ratio becomes negative if calculated from net income. However, the company can sustain dividends through cash flow and its balance sheet. Our estimate for the 2026 dividend is $0.88 per share, corresponding to the current yield of 2.52%. This assumes the company maintains the current payout level despite the loss.
The yield of 2.52% is below the key rate, making the stock less attractive for income investors. If losses continue, the company may be forced to cut dividends, putting additional pressure on the share price.
Valuation at EV/EBITDA LTM of 12.4 is well above its own three-year average of 6.8
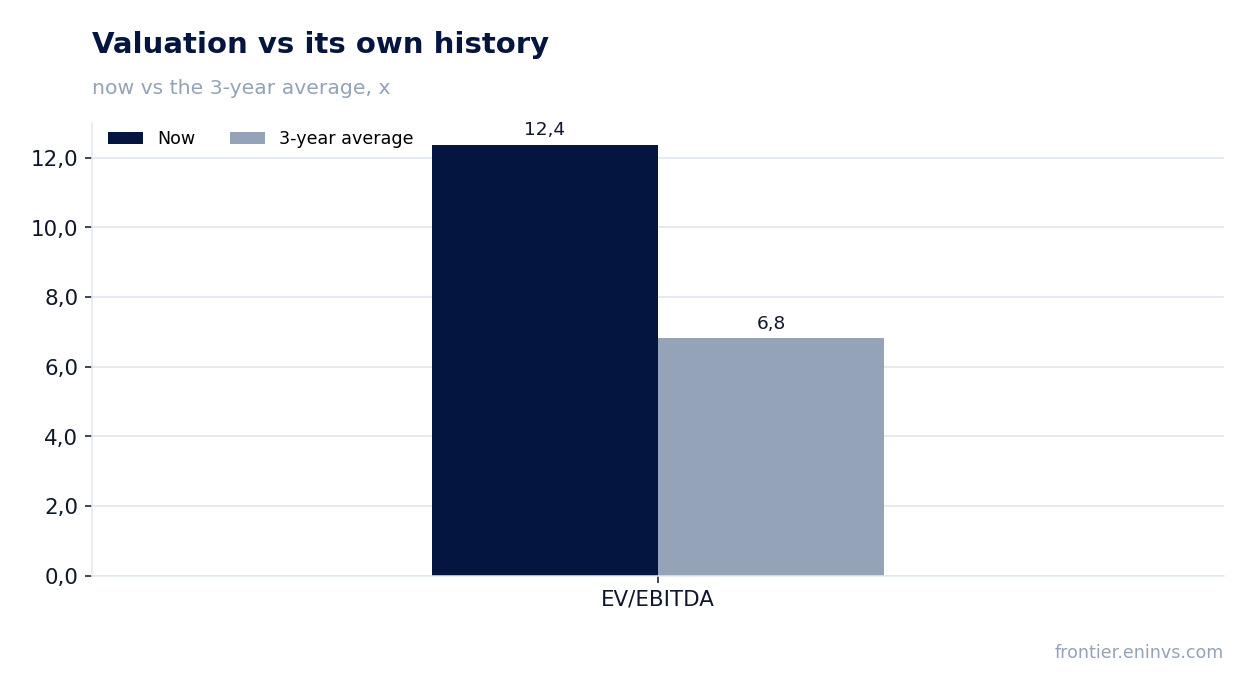
EV/EBITDA LTM is 12.4, significantly above its own three-year average of 6.8. This means the market values the company substantially higher than its average over the past three years. P/E LTM is 15.4, which may also be above historical levels, although the exact average is not disclosed.
Market capitalization is $8,319.3 million, and net debt is $5,718.4 million, giving an EV of about $14,037.7 million. With EBITDA LTM of $1,073.7 million, EV/EBITDA is 12.4. The decline in EBITDA in recent quarters has pushed the multiple higher, even with a relatively stable share price.
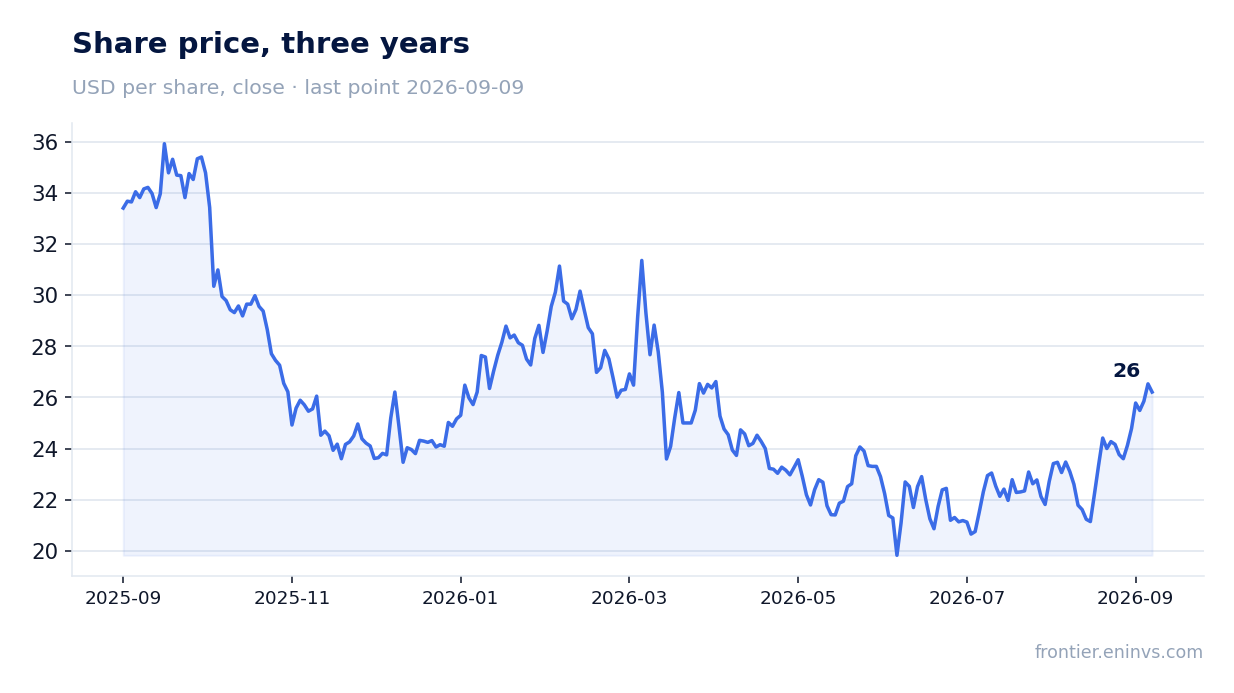
The stock rose 4.1% on the day the report was published and 20.2% from publication to September 9, 2026. This may reflect expectations of profit recovery, but the current valuation leaves no room for error. To return the multiple to the average of 6.8, EBITDA would need to grow to about $2,064 million, nearly double the current LTM level.
Valuation on the latest reported figures
| Metric | Value |
|---|---|
| Market cap | 8.32 bn USD |
| P/E (LTM) | 15.4 |
| EV/EBITDA (LTM) | 12.4 |
| P/B | 0.69 |
| Net debt / EBITDA (LTM) | 4.62 |
| Operating cash flow (LTM) | 0.82 bn |
| ROE | -9.4% |
| Dividend yield (12m) | 2.5% |
| EV/EBITDA, 3-year average | 6.8 |
Bottom line
In Q2 2026, The Mosaic Company reported a loss of $272.8 million, largely due to one-off write-offs and revaluations rather than operating activities. Adjusted EBITDA remained positive at $407.5 million, but its margin declined to 14.4% due to higher raw material costs. Revenue fell 6.0% year-on-year, with prices rising but sales volumes declining. Debt rose to $5,718.4 million, and free cash flow is negative, creating risks for dividends. Valuation at EV/EBITDA LTM of 12.4 is well above its own three-year average of 6.8, making the stock vulnerable to a decline. At the current price, the share looks rather unattractive.
Open the company's financial profile MOS →
See also: market overview · valuation map · stock screeners