NACCO Industries: a $12m solar write-off ate the Q2 profit, and net debt rose to $74.6m
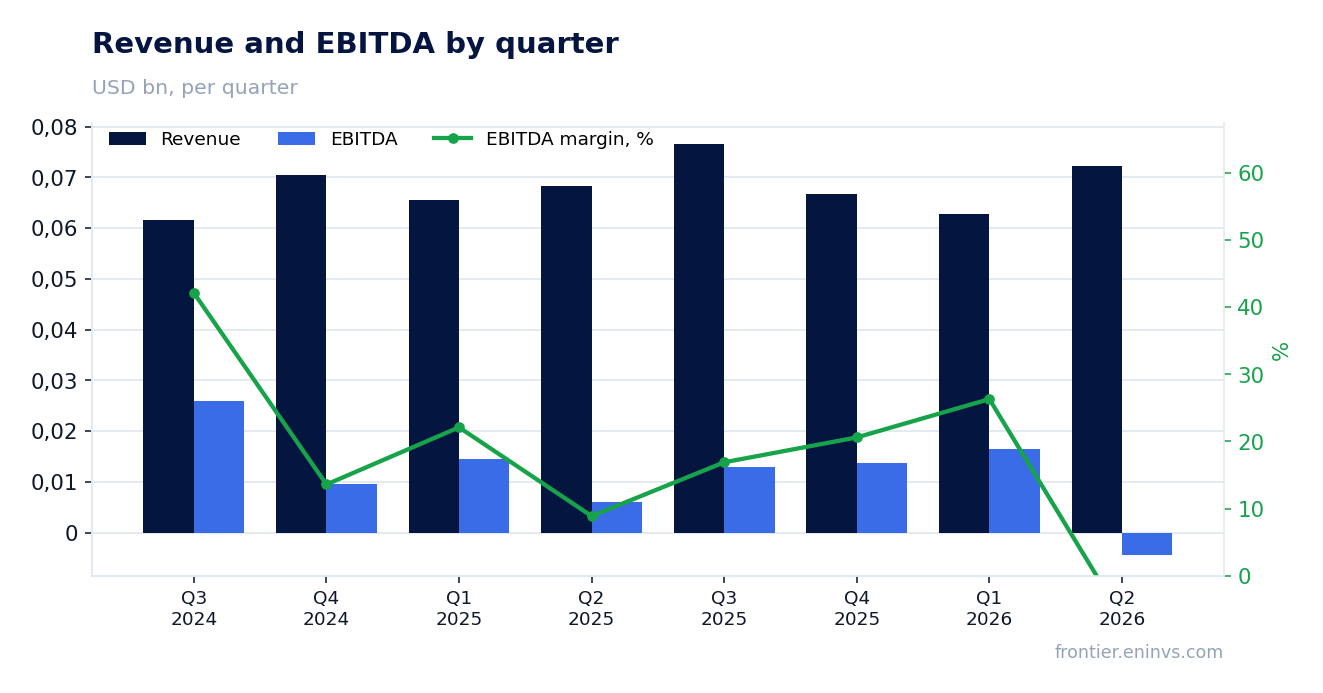
On 5 August NACCO Industries reported second-quarter 2026 results. Revenue rose 6.0% year on year to $72.31m, but EBITDA turned negative at -$4.49m against +$6.04m a year earlier, and the net result was a loss of $0.96m versus a profit of $3.26m. The cause was a one-off $12.0m solar asset impairment, without which adjusted EBITDA would have risen 72% to $15.9m. The share looks neutral: the one-off nature of the write-off and net debt of $74.6m at a net debt/EBITDA LTM of 1.03 balance the strong operating momentum in the segments.
Key takeaways
— Revenue rose 6.0% year on year to $72.31m, but all the growth came from the contract mining segment
— The Q2 loss was caused by a one-off $12.0m solar impairment; without it adjusted EBITDA rose 72%
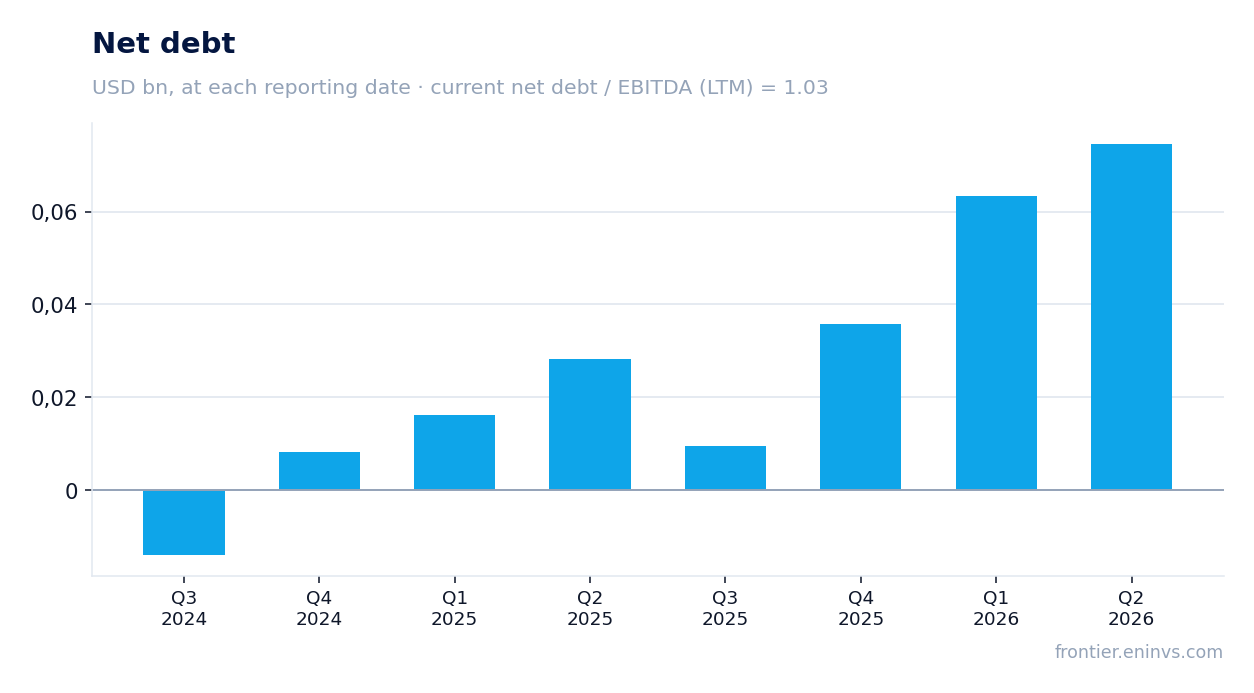
— Leverage increased: net debt reached $74.6m, with net debt/EBITDA LTM at 1.03
— Free cash flow remains under pressure: first-half capex exceeded operating cash flow
— Dividend yield of 2.56% on a payout that may be at risk given the loss
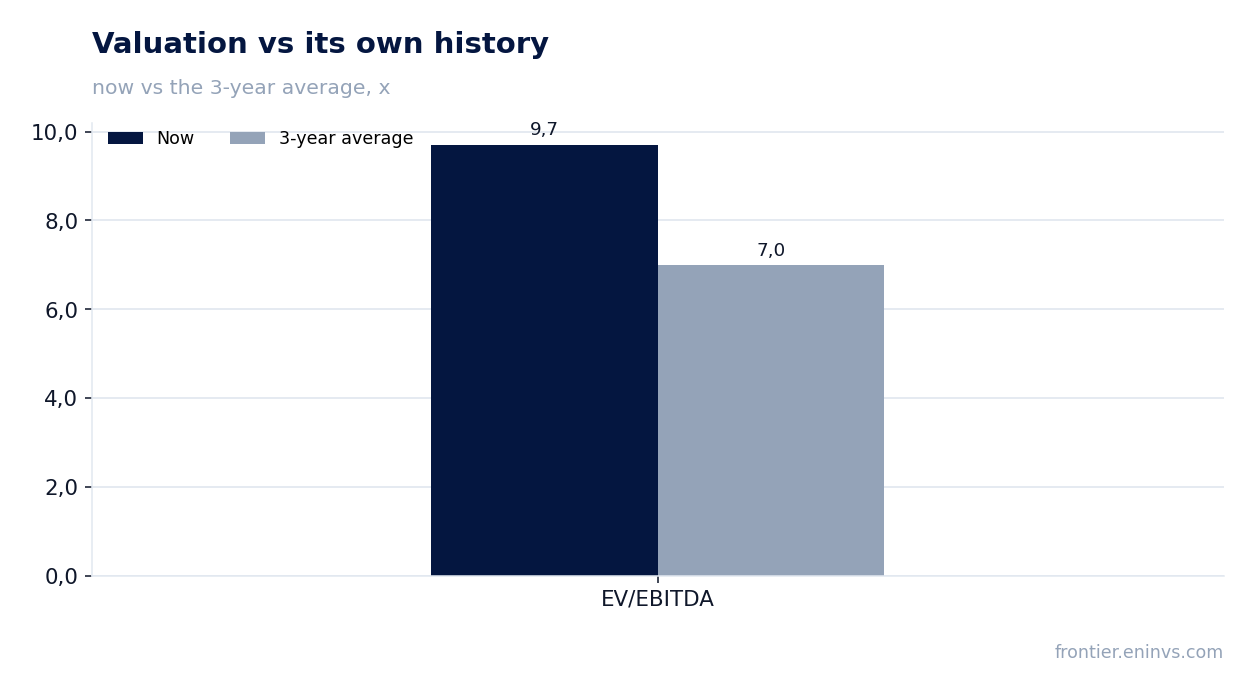
— EV/EBITDA LTM of 9.70 is above the three-year average of 6.99, limiting upside
Attractiveness
Key figures, USD bn
| Metric | Q2 2025 | Q2 2026 | Change |
|---|---|---|---|
| Revenue | 0.07 | 0.07 | +6.0% |
| EBITDA | 0.01 | -0.00 | -122.5% |
| Operating profit | -0.00 | -0.00 | — |
| Net profit | 0.00 | -0.00 | -129.5% |
| Operating cash flow | -0.01 | 0.01 | to profit |
| Capex | 0.00 | 0.01 | +170.2% |
| EBITDA margin | 8.9% | -1.9% | -10.8 pp |
| Net margin | 4.8% | -1.3% | -6.1 pp |
Revenue rose 6.0% year on year to $72.31m, but all the growth came from the contract mining segment
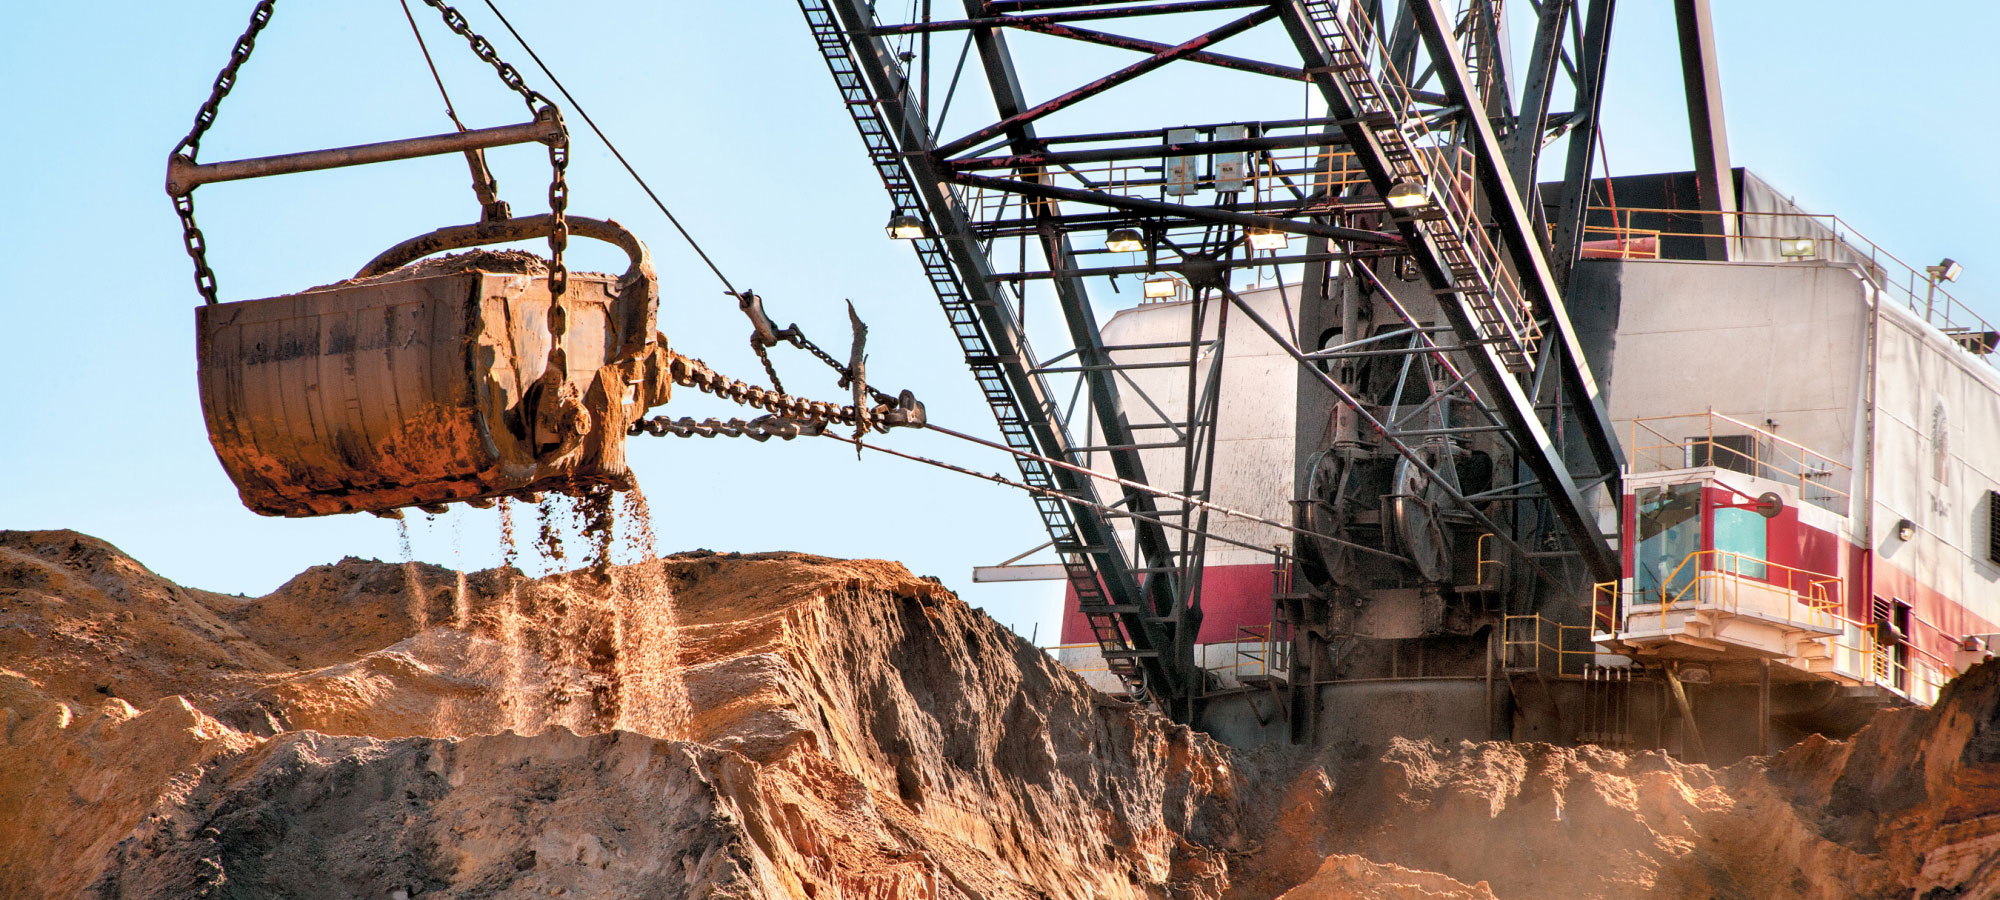
Second-quarter 2026 revenue was $72.31m, up 6.0% from $68.235m a year earlier. Growth was driven by the contract mining segment: its revenue rose 34% to $36.919m, helped by the start of a new dragline services contract for a U.S. Army Corps of Engineers project in Palm Beach County, Florida. Limestone mining also contributed.
The Minerals and Royalties segment increased revenue by 46% to $10.617m on higher oil prices and a favourable adjustment to prior-period pricing estimates. However, Utility Coal Mining saw revenue fall 25% to $21.477m due to operational issues at Mississippi Lignite Mining Company's customer's power plant, which reduced coal deliveries.
Overall, revenue growth was uneven: strength in contract mining and minerals offset weakness in coal. First-half 2026 revenue was $135.085m versus $133.806m a year earlier, up 1.0%.
The Q2 loss was caused by a one-off $12.0m solar impairment; without it adjusted EBITDA rose 72%
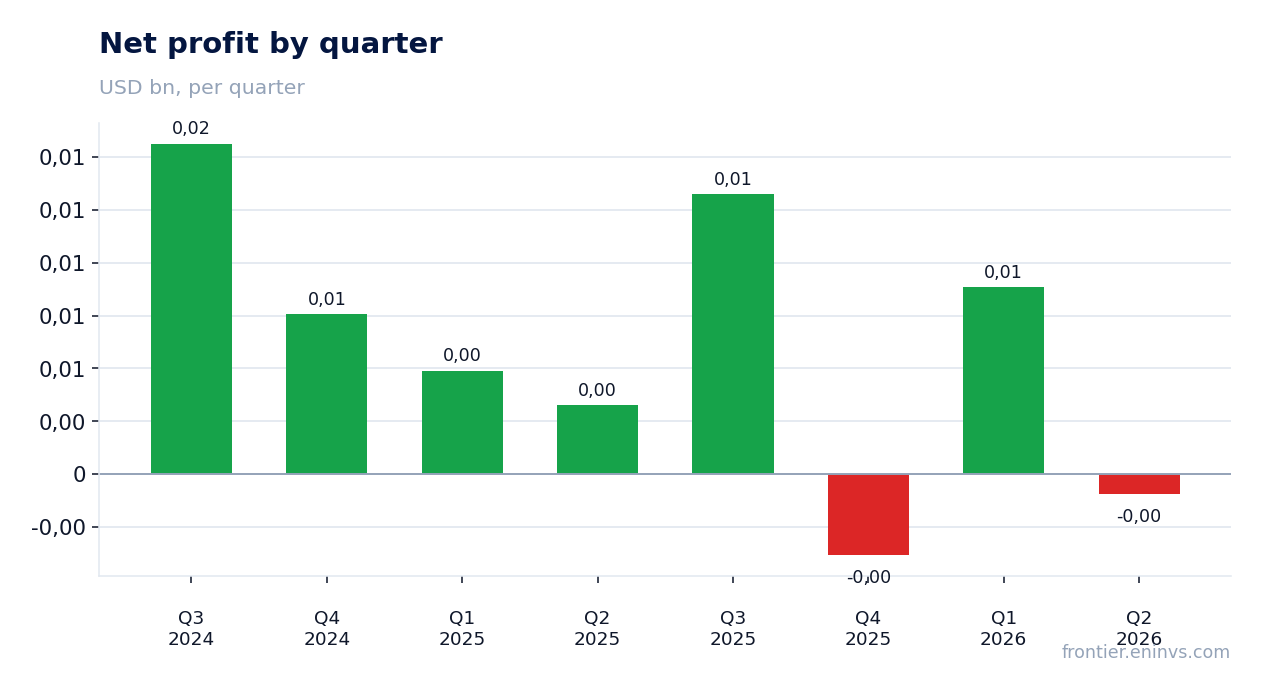
The second-quarter 2026 net loss was $0.963m versus a profit of $3.26m a year earlier. The main cause was an $11.984m impairment of solar assets in the ReGen Resources segment. Excluding this one-off, adjusted EBITDA would have been $15.908m, up 72% from $9.259m a year earlier.
Operating profit also turned negative: a loss of $2.267m versus a loss of $0.051m a year earlier. However, gross profit rose 123% to $15.202m on improved results across all segments. In particular, Utility Coal Mining posted operating profit of $6.280m versus $1.222m a year earlier, Contract Mining $3.765m versus $1.010m, and Minerals and Royalties $6.748m versus $5.205m.
The one-off write-off distorts the picture: without it operating profit would have been positive. The company notes that in early July it began pursuing alternatives to monetise the solar investments, including asset sales, and additional curtailment costs could be incurred.
Leverage increased: net debt reached $74.6m, with net debt/EBITDA LTM at 1.03
Net debt at the end of Q2 2026 was $74.595m, up from $63.29m at the end of Q1. The increase reflects capital expenditures and investments in business development. The net debt/EBITDA LTM ratio is 1.03 – a moderate level, but it has risen from previous periods.
Total debt at 30 June 2026 was $120.1m, while total liquidity was $114.6m, including $45.5m of cash and $69.1m of availability under credit facilities. The company states that its priority is to use free cash flow to enhance liquidity and reduce debt.
Interest expense in Q2 was $1.620m versus $1.944m a year earlier. The decline in interest expense despite higher debt is due to a change in the debt structure.
Free cash flow remains under pressure: first-half capex exceeded operating cash flow
Operating cash flow in Q2 2026 was $8.299m, better than the negative $7.776m a year earlier. However, capital expenditures for the quarter were $8.491m, resulting in negative free cash flow. For the first half of 2026, operating cash flow was $20.673m and capex was $41.921m, also implying negative free cash flow.
The company plans to invest up to $35m for the remainder of the year, primarily for business development. These expenditures will be made only if projects meet return criteria. Cash flow before financing is expected to remain a use of cash in 2026, but improve versus 2025.
The increase in capex is tied to new contracts and projects that should drive future growth. However, current free cash flow does not cover investments, forcing the company to increase debt.
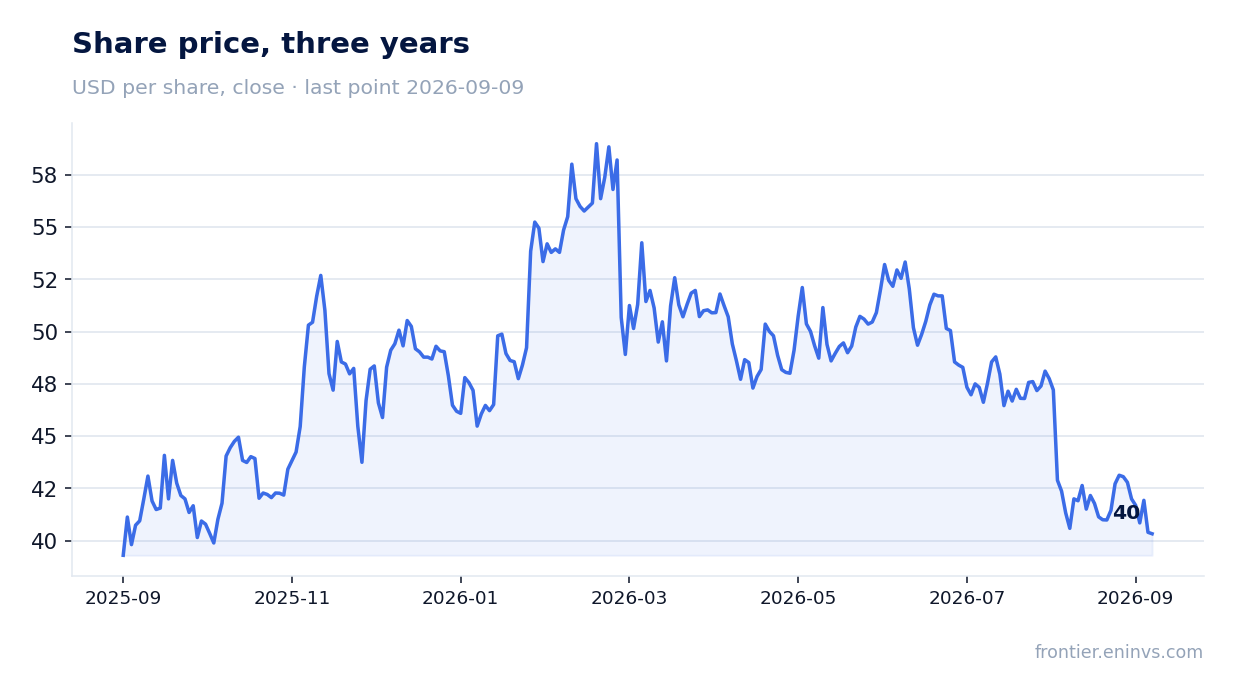
Dividend yield of 2.56% on a payout that may be at risk given the loss
The trailing 12-month dividend yield is 2.56%. The company did not announce new dividends in the Q2 report. With a Q2 net loss of $0.963m and significant capital expenditures, dividend payments may be constrained.
The company states its commitment to returning value to shareholders, but prioritises investments in growth and balance sheet strength. In 2026, operating profit and net income are expected to be significantly lower due to one-off write-offs and anticipated charges, which could affect the dividend size.
The 2.56% yield is below the key rate, making the stock less attractive for income investors. However, the company has a history of payments and may maintain the dividend at the current level if operating cash flow remains sufficient.
EV/EBITDA LTM of 9.70 is above the three-year average of 6.99, limiting upside
EV/EBITDA LTM is 9.70, above the three-year average of 6.99. This means the stock is valued higher than its average over the past three years. P/E LTM is 17.45. Market capitalisation is $301.7m.
The high valuation reflects expectations of growth from new contracts, but current financial results do not support rapid improvement. At the same time, EV/EBITDA LTM includes one-off write-offs that depress EBITDA, so the underlying valuation may be lower.
To justify the current valuation, the company needs to demonstrate sustainable growth in profit and cash flow. Otherwise, the multiple could revert to its historical average, pressuring the share price.
Valuation on the latest reported figures
| Metric | Value |
|---|---|
| Market cap | 0.30 bn USD |
| P/E (LTM) | 17.5 |
| EV/EBITDA (LTM) | 9.7 |
| P/B | 0.70 |
| Net debt / EBITDA (LTM) | 1.03 |
| Operating cash flow (LTM) | 0.05 bn |
| ROE | -0.9% |
| Dividend yield (12m) | 2.6% |
| EV/EBITDA, 3-year average | 7.0 |
Bottom line
The strong side of the report is the operating performance of the segments: gross profit rose 123% and adjusted EBITDA rose 72%, indicating a healthy business excluding one-off write-offs. However, the net loss and rising net debt of $74.6m with negative free cash flow raise questions. EV/EBITDA LTM of 9.70 is above the three-year average of 6.99, limiting upside. The 2.56% dividend yield is below the key rate and may be under pressure. Verdict – neutral: the current price already reflects recovery, but project execution risks and leverage balance the operating progress.
Open the company's financial profile NC →
See also: market overview · valuation map · stock screeners