Newmont Corporation: record quarterly free cash flow, but EBITDA margin compressed to 59.5%
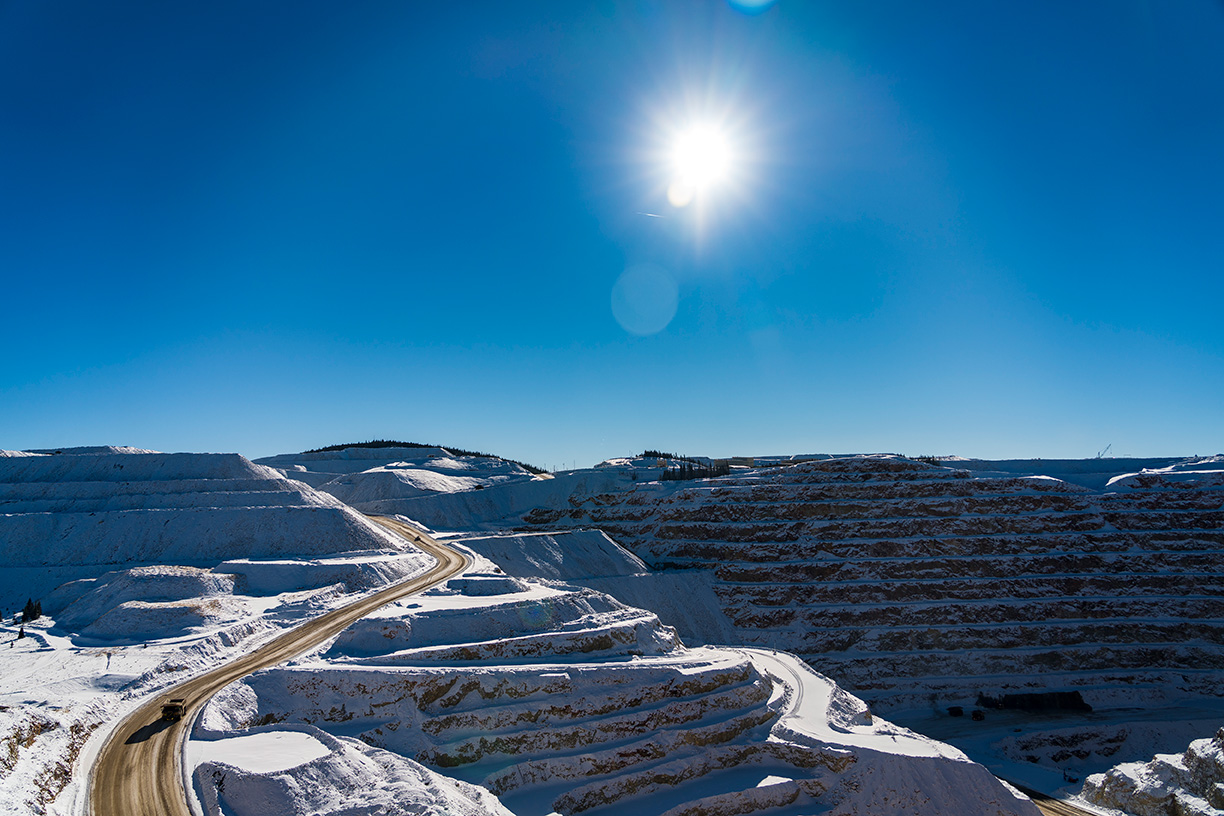
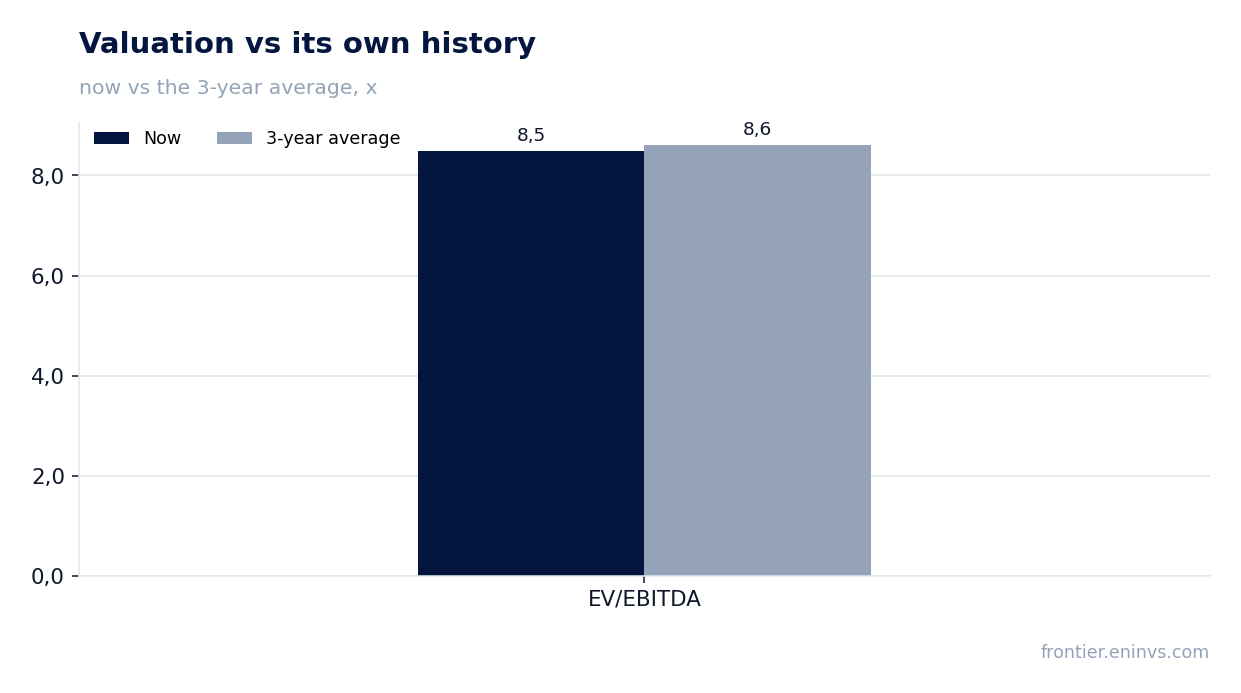
23 июля Newmont Corporation раскрыла результаты за второй квартал 2026 года. Выручка выросла на 15,1% год к году до 6 118 млн долларов, чистая прибыль – на 6,8% до 2 202 млн, но EBITDA снизилась на 2,7%, а маржа по EBITDA упала с 70,3% до 59,5%. При текущей цене акция выглядит скорее привлекательно: мультипликатор EV/EBITDA (8,5) ниже собственного трёхлетнего среднего (8,6), баланс нетто-кэшевый, а свободный денежный поток за квартал стал рекордным для второго квартала.
Key takeaways
— Revenue grew 15.1% thanks to record gold prices, but production volumes declined
— EBITDA margin compressed to 59.5% due to higher unit costs and the impact of seismic events at Cadia
— Net profit grew 6.8%, but adjusted earnings per share fell 6.7%
— Free cash flow reached a record $2.2 billion for the quarter
— The company maintains a net cash position and returned $1.9 billion to shareholders
— The share rose 33.8% after the report, but the portal's model sees only -7% upside
Attractiveness
Key figures, USD bn
| Metric | Q2 2025 | Q2 2026 | Change |
|---|---|---|---|
| Revenue | 5.32 | 6.12 | +15.1% |
| EBITDA | 3.74 | 3.64 | -2.7% |
| Operating profit | 3.12 | 3.15 | +1.2% |
| Net profit | 2.06 | 2.20 | +6.8% |
| Operating cash flow | 2.38 | 2.92 | +22.7% |
| Capex | 0.67 | 0.72 | +6.7% |
| EBITDA margin | 70.3% | 59.5% | -10.8 pp |
| Net margin | 38.8% | 36.0% | -2.8 pp |
Revenue grew 15.1% thanks to record gold prices, but production volumes declined
In the second quarter of 2026, Newmont Corporation's revenue reached $6,118 million, up 15.1% year-on-year. The main driver was the average realized gold price: $4,414 per ounce versus $3,320 in the second quarter of 2025. Copper prices also rose – from $4.37 to $6.82 per pound.
Production volumes, however, declined: attributable gold production fell 1% quarter-on-quarter to 1,293 thousand ounces, and copper production fell 43% to 17 thousand tonnes. The cause was seismic events at the Cadia mine in April, which led to downtime, as well as planned grade declines at several other assets. The company notes that Cadia returned to normal operations by mid-June.
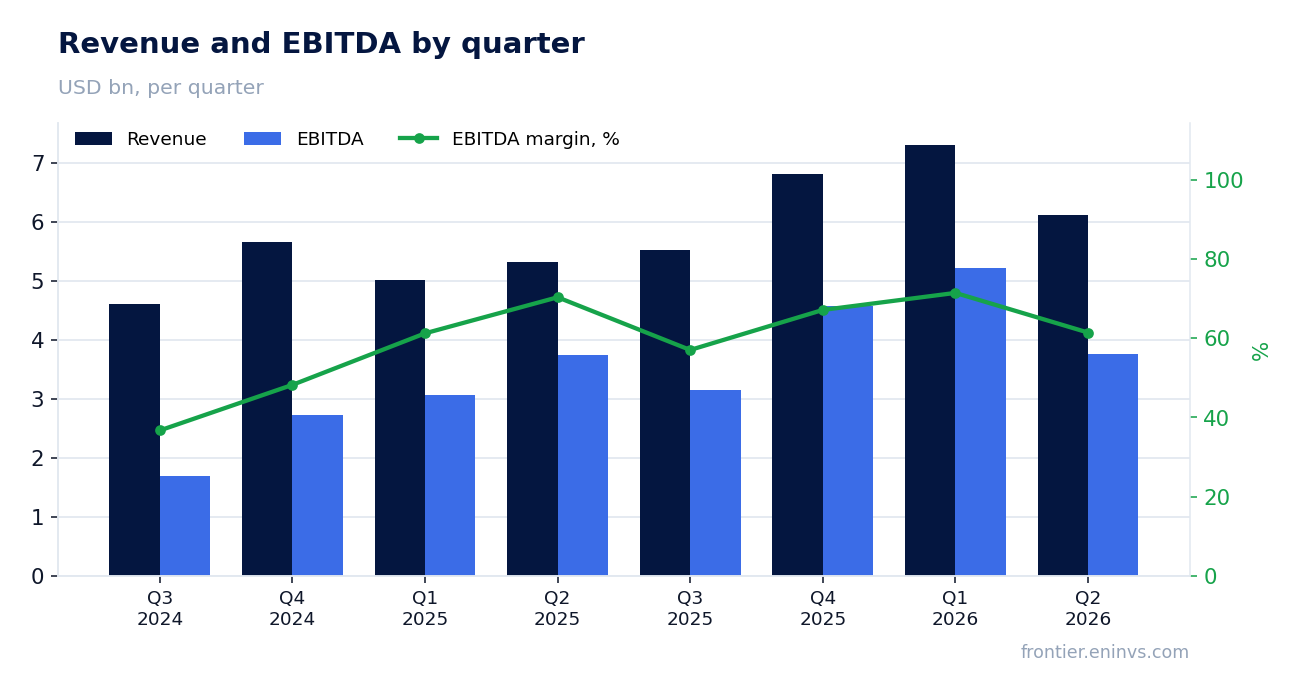
EBITDA margin compressed to 59.5% due to higher unit costs and the impact of seismic events at Cadia
EBITDA in the second quarter of 2026 was $3,759 million, down 2.7% year-on-year. EBITDA margin fell from 70.3% to 59.5%. Pressure came from higher unit costs: gold by-product CAS rose 93% to $1,043 per ounce, and AISC rose 58% to $1,621 per ounce.
The company attributes the cost increase to lower gold and co-product volumes, lower silver prices, a full quarter of increased royalties in Ghana, and higher diesel prices. Additionally, Cadia incurred costs related to downtime after the seismic event. These factors were partially offset by higher copper prices.
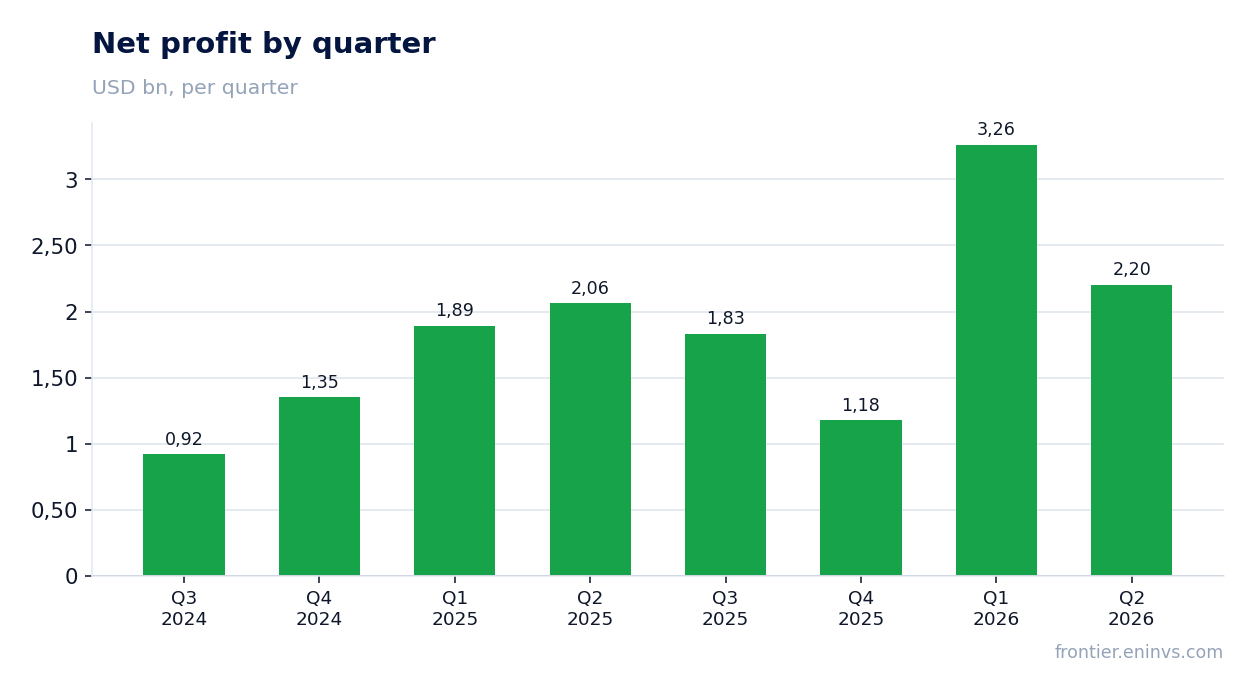
Net profit grew 6.8%, but adjusted earnings per share fell 6.7%
Net profit attributable to Newmont shareholders in the second quarter of 2026 was $2,202 million, up 6.8% year-on-year. The growth was mainly driven by a $452 million decrease in income and mining tax expense versus the prior quarter, as well as higher revenue.
However, adjusted earnings per share fell from $2.25 to $2.10 (–6.7%), as the results included losses from the fair value of investments and options of $111 million and restructuring and severance charges of $12 million. Diluted GAAP EPS was $2.06 versus $1.85 a year earlier.
Free cash flow reached a record $2.2 billion for the quarter
Operating cash flow in the second quarter of 2026 was $2,924 million, down 23% from the prior quarter, due to lower revenue and higher costs. Capital expenditures rose to $719 million. As a result, free cash flow was $2,205 million – a record for the second quarter in the company's history.
The decline in operating cash flow versus the prior quarter is mainly due to lower realized gold and silver prices, as well as working capital, which consumed $90 million. The company notes that favorable accounts receivable and payable movements in the second quarter may partially reverse in future periods.
The company maintains a net cash position and returned $1.9 billion to shareholders
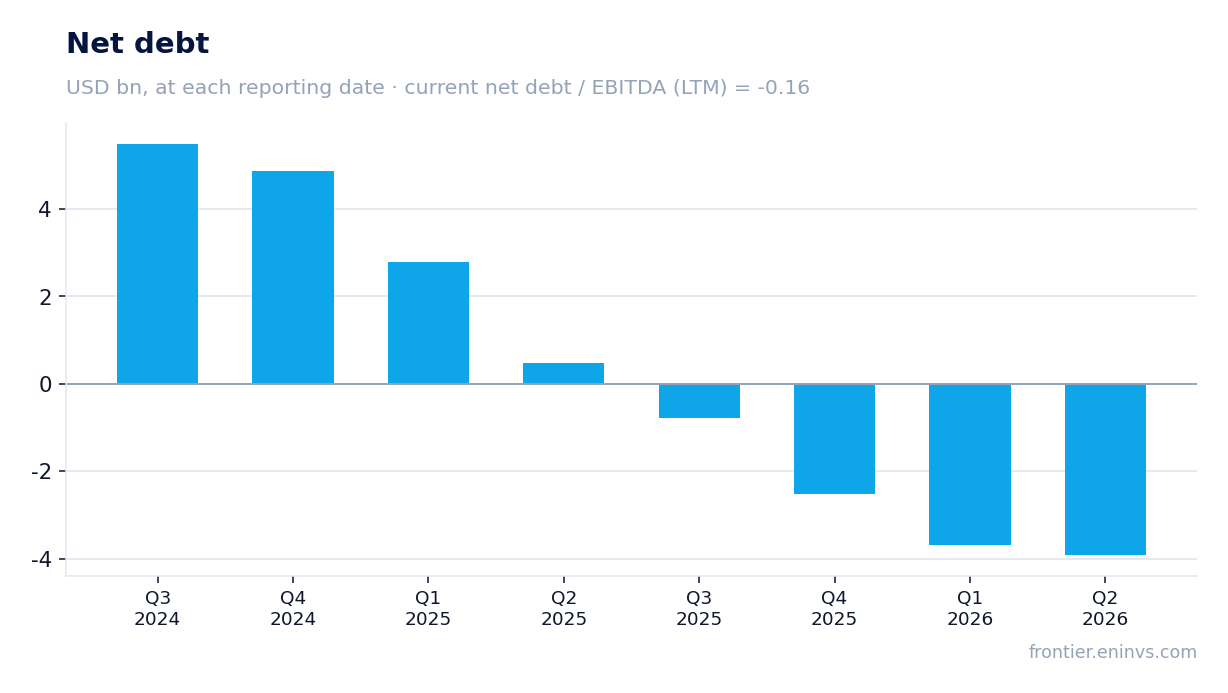
At the end of the second quarter of 2026, Newmont had $9.0 billion in cash and a net cash position of $3.4 billion. Over the last 12 months, net debt decreased by $4.4 billion, and the net debt/EBITDA ratio for the trailing twelve months stands at –0.16.
Since the last report, the company returned $1.9 billion to shareholders, including $1.7 billion in share repurchases. A dividend of $0.26 per share was declared, corresponding to an annual level of $1.04. The company confirmed plans for share repurchases under the $6 billion program, with $4.3 billion remaining.
The share rose 33.8% after the report, but the portal's model sees only -7% upside
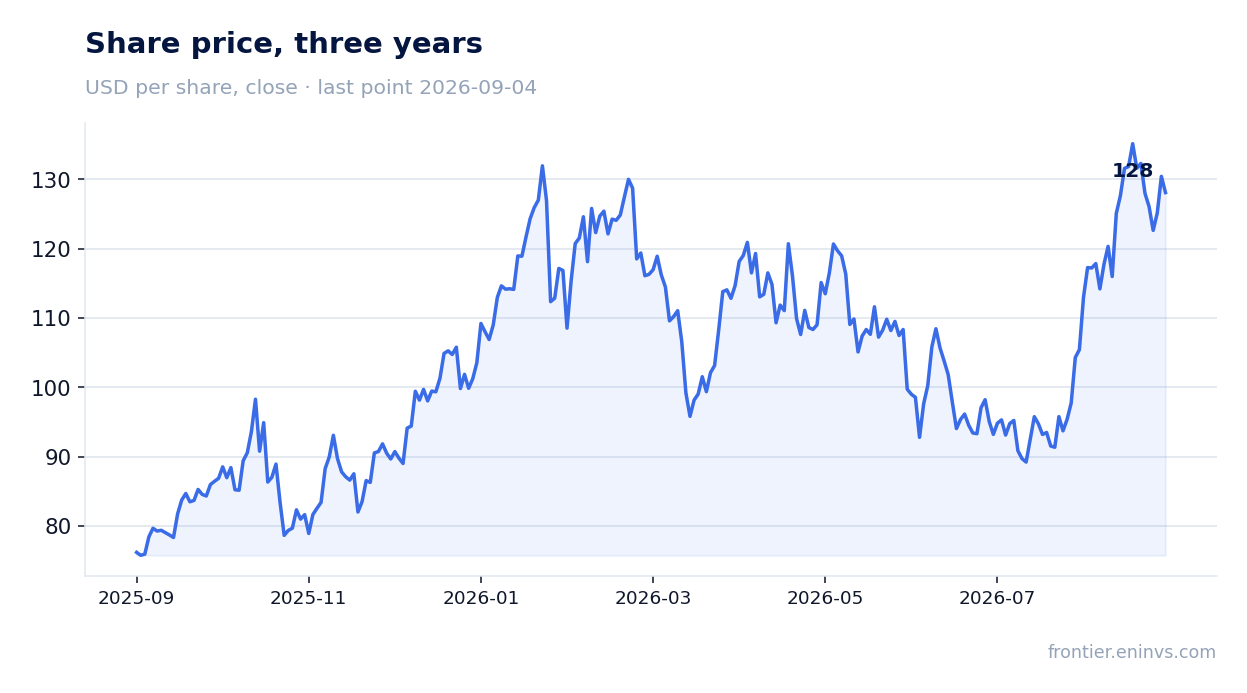
The share price before the report was $95.75; it fell 1.1% on the release day but rose 33.8% by September 4. Current market capitalization is $140,143 million. The EV/EBITDA multiple for the trailing twelve months is 8.5, only slightly below the three-year average of 8.6.
According to the portal's model, which re-prices EBITDA at current commodity prices and applies a target EV/EBITDA, the fair value of the share is 7% below the current market price. This means that after a strong rally, the share is already trading near the model's valuation, and further upside is limited unless gold prices continue to rise.
Valuation on the latest reported figures
| Metric | Value |
|---|---|
| Market cap | 140 bn USD |
| P/E (LTM) | 16.3 |
| EV/EBITDA (LTM) | 8.5 |
| P/B | 4.14 |
| Net debt / EBITDA (LTM) | -0.16 |
| Operating cash flow (LTM) | 10.3 bn |
| ROE | 25.1% |
| Dividend yield (12m) | 0.8% |
| EV/EBITDA, 3-year average | 8.6 |
Bottom line
Newmont's second quarter 2026 report showed strong free cash flow of $2.2 billion and a net cash position, confirming the company's ability to return capital to shareholders. However, EBITDA margin compressed to 59.5% due to higher costs and the impact of seismic events, and adjusted earnings per share declined. The share has risen 33.8% since the report and now trades at an EV/EBITDA multiple of 8.5, only slightly below its own three-year average. The portal's model values the share 7% below the current price, so with current gold prices, upside is limited. Verdict – rather attractive: a strong balance sheet and cash flow support the valuation, but further growth requires either new highs in gold or cost reductions.
Open the company's financial profile NEM →
See also: market overview · valuation map · stock screeners