NGL Energy Partners: revenue up 59.1%, but margin compressed and leverage at 8.27x EBITDA
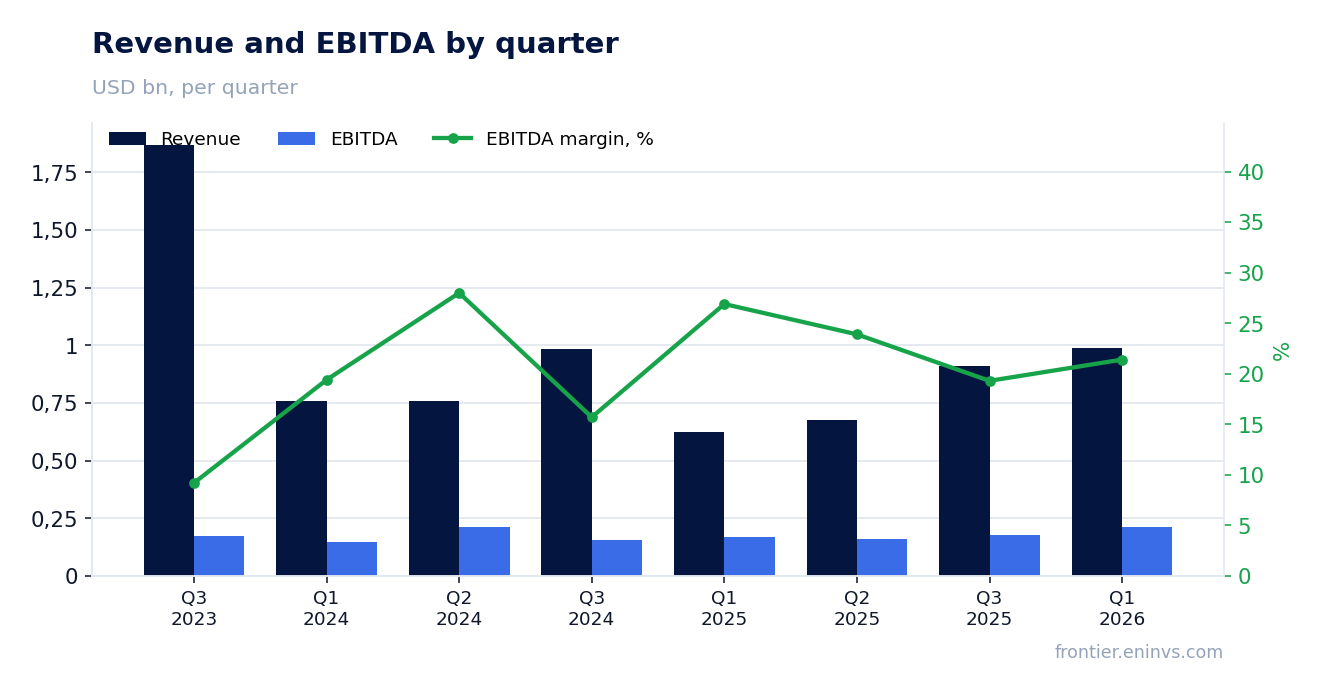
NGL Energy Partners reported results for the first quarter of 2026. Revenue rose 59.1% year-on-year, EBITDA added 26.8%, net profit – 14.2%. However, EBITDA margin fell to 21.4% from 26.9%, and net debt to LTM EBITDA stands at 8.27. On our model, the stock's upside to fair value is negative – minus 82%. At the current price, the share looks unattractive.
Key takeaways
— Revenue rose 59.1% year-on-year, but EBITDA margin compressed to 21.4% from 26.9%
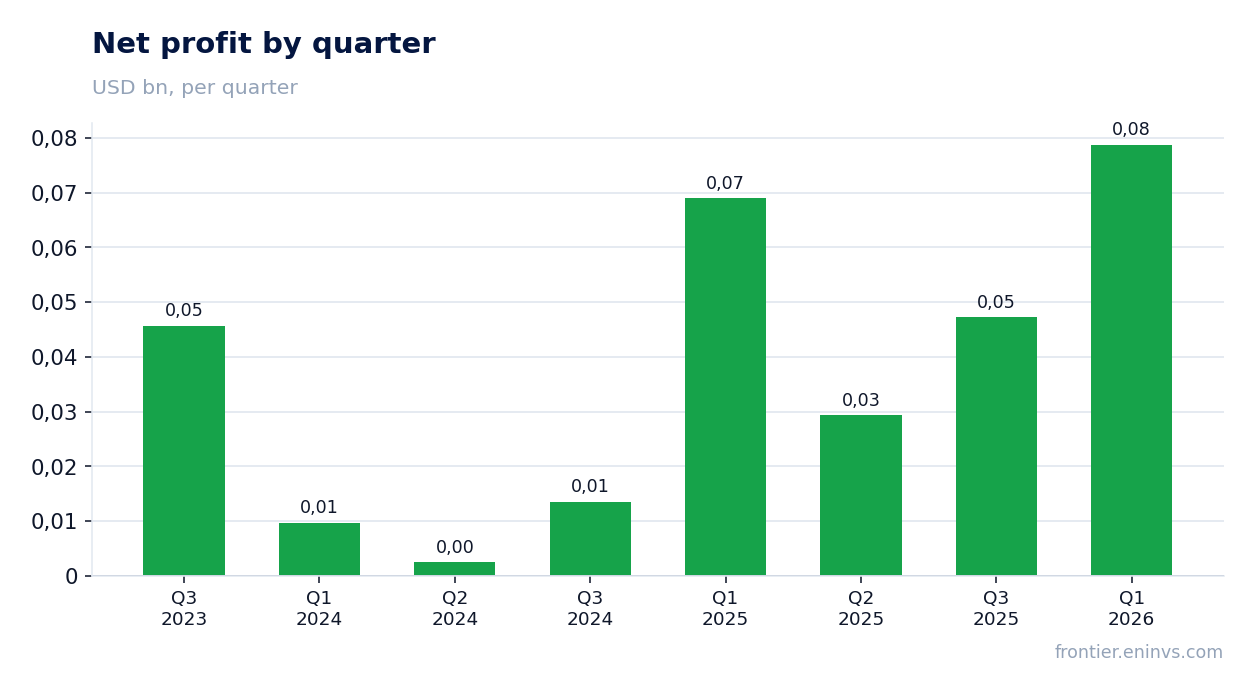
— Net profit increased only 14.2% – cost growth ate into operating leverage
— Operating cash flow for the quarter was $77.0 million with capital expenditures of $108.8 million
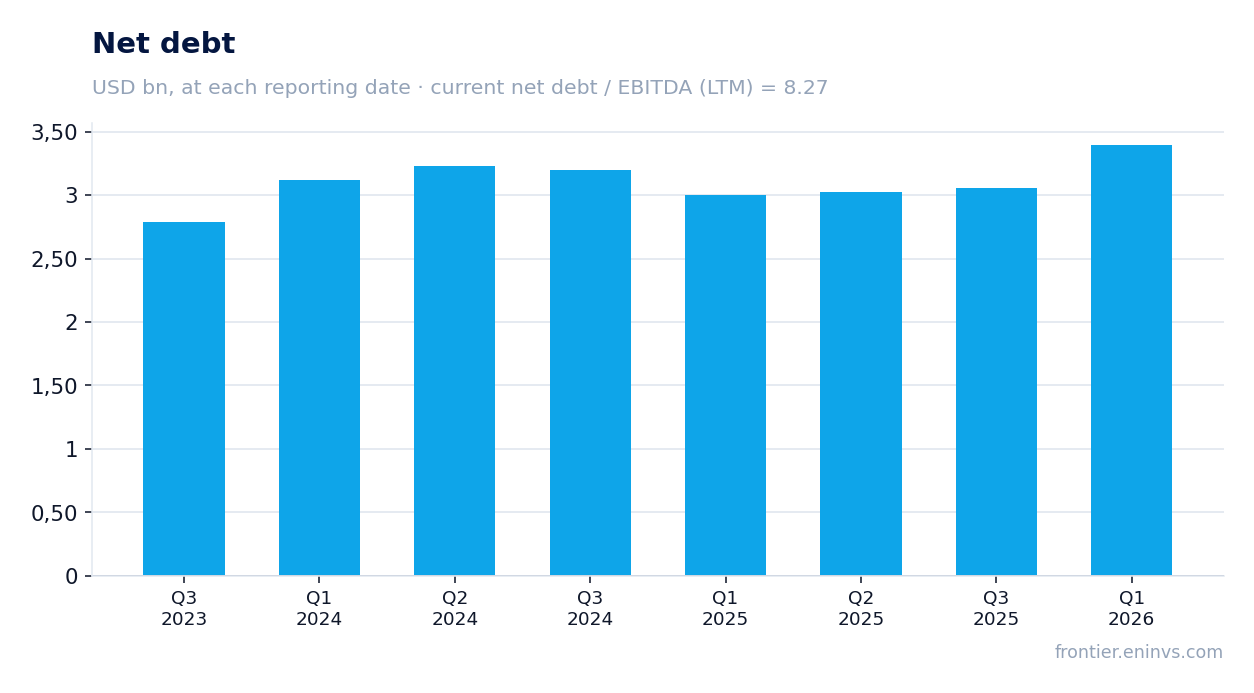
— Net debt reached $3,348.9 million, with net debt to LTM EBITDA at 8.27
— EV/EBITDA LTM stands at 13.83 – above historical levels, limiting re-rating potential
— On the portal's model, the stock's fair value is 82% below the current market price
Attractiveness
Key figures, USD bn
| Metric | Q1 2025 | Q1 2026 | Change |
|---|---|---|---|
| Revenue | 0.62 | 0.99 | +59.1% |
| EBITDA | 0.17 | 0.21 | +26.8% |
| Operating profit | 0.10 | 0.15 | +49.1% |
| Net profit | 0.07 | 0.08 | +14.2% |
| Operating cash flow | 0.03 | 0.08 | +132.0% |
| Capex | 0.02 | 0.11 | +391.5% |
| EBITDA margin | 26.9% | 21.4% | -5.5 pp |
| Net margin | 11.1% | 8.0% | -3.1 pp |
Revenue rose 59.1% year-on-year, but EBITDA margin compressed to 21.4% from 26.9%
In the first quarter of 2026, NGL Energy Partners' revenue reached $990.0 million, up 59.1% from the same quarter a year earlier. This is the highest quarterly revenue figure in the last three years. The revenue growth is likely driven by higher sales volumes or favorable energy price environment, though the exact drivers are not disclosed in the provided data.
Despite significant revenue growth, EBITDA increased only 26.8% to $212.0 million. This led to a decline in EBITDA margin to 21.4% from 26.9% a year earlier. The outpacing of revenue growth over EBITDA indicates that costs grew faster than revenues, putting pressure on operating efficiency.
Net profit increased only 14.2% – cost growth ate into operating leverage
Net profit in the first quarter of 2026 was $78.7 million, up 14.2% year-on-year. Net profit growth was significantly more modest than revenue and EBITDA growth. This is explained by the fact that while revenue rose 59.1% and EBITDA 26.8%, net profit increased only 14.2%, indicating a substantial impact from non-operating factors such as interest on debt and taxes.
Net margin declined to 8.0% from 11.1% a year earlier. This confirms that cost growth and debt servicing are pressuring the bottom line. To further improve profit, the company needs not only to grow revenue but also to control expenses.
Operating cash flow for the quarter was $77.0 million with capital expenditures of $108.8 million
Operating cash flow in the first quarter of 2026 was $77.0 million, significantly lower than in the previous quarter ($182.3 million) but higher than a year earlier ($33.2 million). At the same time, capital expenditures amounted to $108.8 million, exceeding operating cash flow. This means free cash flow was negative.
Negative free cash flow may limit the company's ability to fund dividends or reduce debt. Given the high debt level, it is important for the company to generate sufficient operating cash flow to cover capital expenditures and service obligations.
Net debt reached $3,348.9 million, with net debt to LTM EBITDA at 8.27
Net debt at the latest reporting date was $3,348.9 million, up $0.4 billion over the last 12 months. The net debt to LTM EBITDA ratio stands at 8.27. This is a high level of leverage that may limit the company's financial flexibility.
High debt requires significant interest payments, which pressures net profit. Amid revenue growth, it is important for the company to allocate part of its cash flow to debt reduction to mitigate risks. However, negative free cash flow in the reporting quarter complicates this task.
EV/EBITDA LTM stands at 13.83 – above historical levels, limiting re-rating potential
EV/EBITDA for the last 12 months is 13.83. This is a relatively high multiple, which may indicate that the market is already pricing in significant growth in financial performance. Historically, the company traded at lower multiples, which limits the potential for further re-rating.
The company's market capitalization is $2,249.5 million, and net debt is $3,348.9 million. The high debt level increases EV and, consequently, the multiple. To reduce the multiple, the company needs to grow EBITDA or reduce debt.
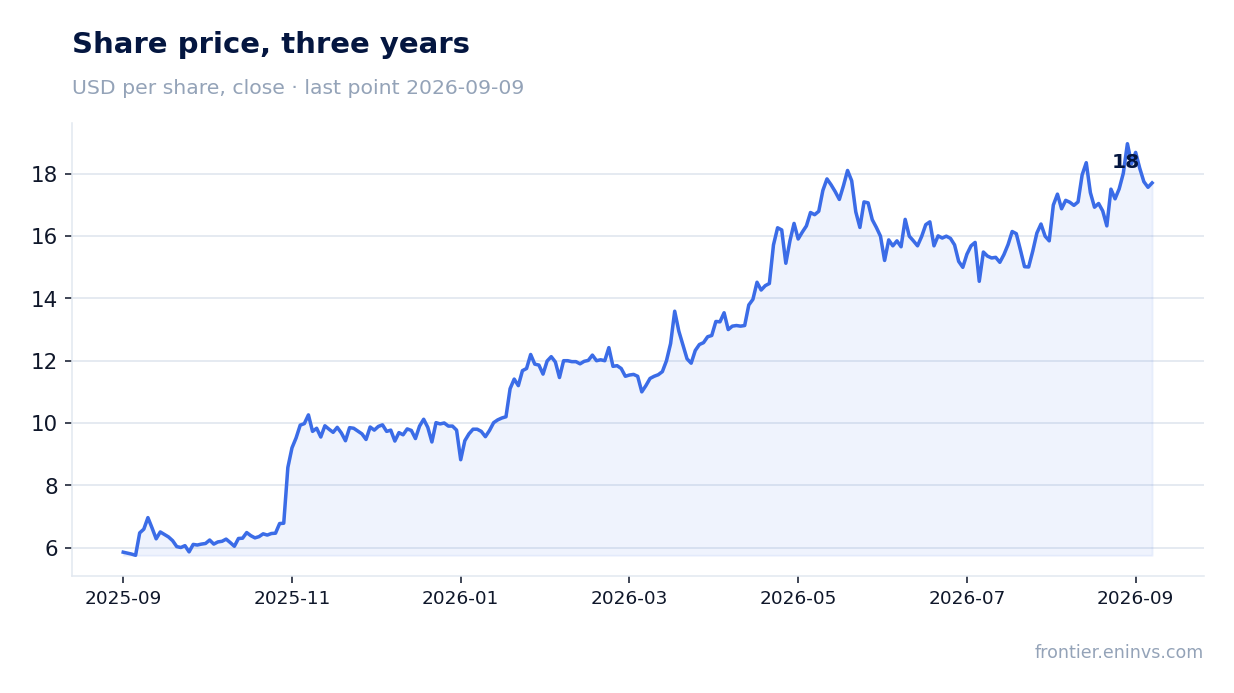
On the portal's model, the stock's fair value is 82% below the current market price
According to our model, the fair value of NGL Energy Partners' stock is 82% below the current market price. This means that at current commodity prices and target EV/EBITDA, the stock is overvalued by the market. The model takes into account current commodity prices and a target multiple, providing a more conservative valuation.
Thus, from our model's perspective, there is no upside potential, and the downside is 82%. This is a significant argument that the stock looks unattractive to investors at current levels.
Valuation on the latest reported figures
| Metric | Value |
|---|---|
| Market cap | 2.25 bn USD |
| EV/EBITDA (LTM) | 13.8 |
| Net debt / EBITDA (LTM) | 8.27 |
| Operating cash flow (LTM) | 0.37 bn |
| ROE | -118.2% |
Bottom line
NGL Energy Partners showed strong revenue growth of 59.1% year-on-year, but this did not translate into proportional profit improvement: EBITDA rose 26.8%, net profit – 14.2%, and EBITDA margin compressed to 21.4% from 26.9%. Operating cash flow was insufficient to cover capital expenditures, resulting in negative free cash flow. Debt burden remains high – net debt to LTM EBITDA at 8.27. On our model, the stock is overvalued by 82%. All this makes the stock unattractive to investors at current levels.
Open the company's financial profile NGL →
See also: market overview · valuation map · stock screeners