National Oilwell Varco: EBITDA up 23% but $40 million of it came from tariff refunds
On July 29, National Oilwell Varco released its second-quarter 2026 results. Revenue fell 2.5% year-on-year to $2,134 million, adjusted EBITDA rose 23.0% to $283 million, and net income added 3.7% to $112 million. Adjusted EBITDA includes a one-off $40 million benefit from tariff refunds; without it, growth would have been more modest. With an EV/EBITDA multiple of 11.2 versus its own three-year average of 7.4 and a portal model upside of +27%, the stock looks rather attractive, but the one-off nature of the profit and weak organic revenue growth call for caution.
Key takeaways
— Revenue falls for the fifth consecutive quarter, but the decline slowed to 2.5%
— EBITDA margin rose to 13.3% thanks to one-off tariff refunds of $40 million
— Net income grew 3.7% year-on-year, but quarter-on-quarter growth was manifold
— Operating cash flow remains weak: $17 million for the quarter against $81 million capex
— Debt load at 1.03x EBITDA LTM is moderate, but net debt rose to $1,162 million
— Dividend yield of 1.95% with $64 million paid in the quarter is modest against rates
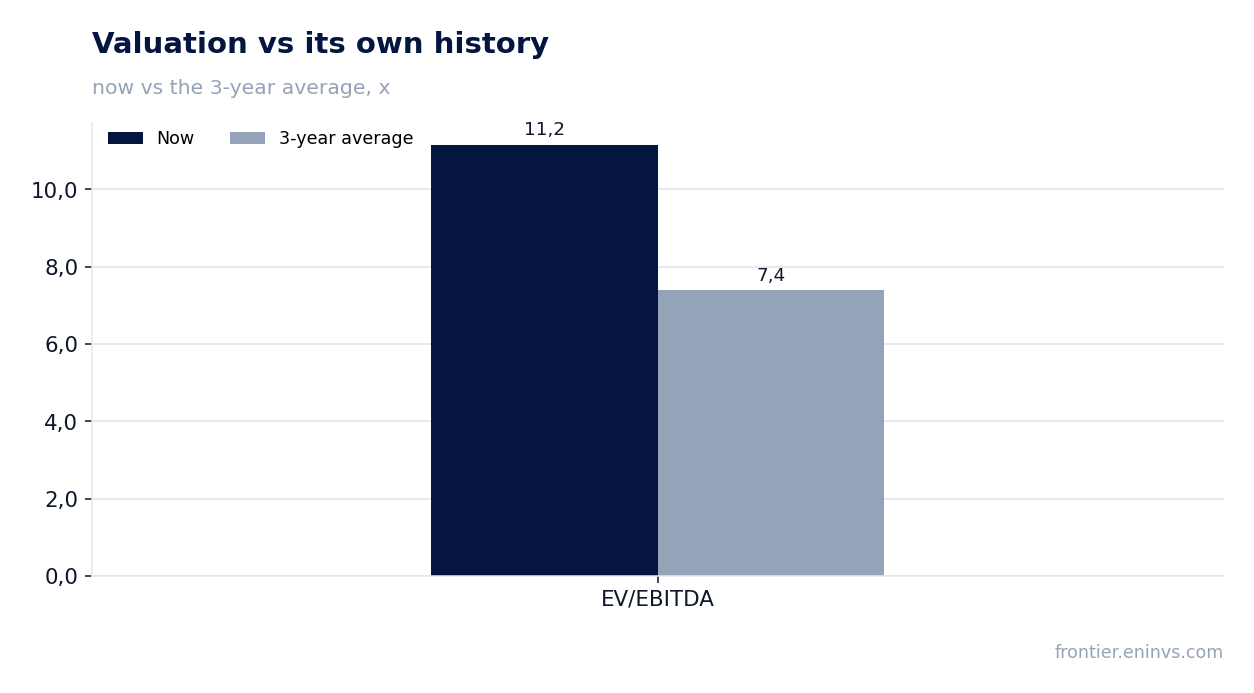
— Valuation: EV/EBITDA 11.2 versus historical average of 7.4 – the stock trades above its own history
Attractiveness
Key figures, USD bn
| Metric | Q2 2025 | Q2 2026 | Change |
|---|---|---|---|
| Revenue | 2.19 | 2.13 | -2.5% |
| EBITDA | 0.23 | 0.28 | +23.0% |
| Operating profit | 0.14 | 0.19 | +35.0% |
| Net profit | 0.11 | 0.11 | +3.7% |
| Operating cash flow | 0.19 | 0.02 | -91.1% |
| Capex | 0.08 | 0.08 | -2.4% |
| EBITDA margin | 10.5% | 13.3% | +2.8 pp |
| Net margin | 4.9% | 5.2% | +0.3 pp |
Revenue falls for the fifth consecutive quarter, but the decline slowed to 2.5%
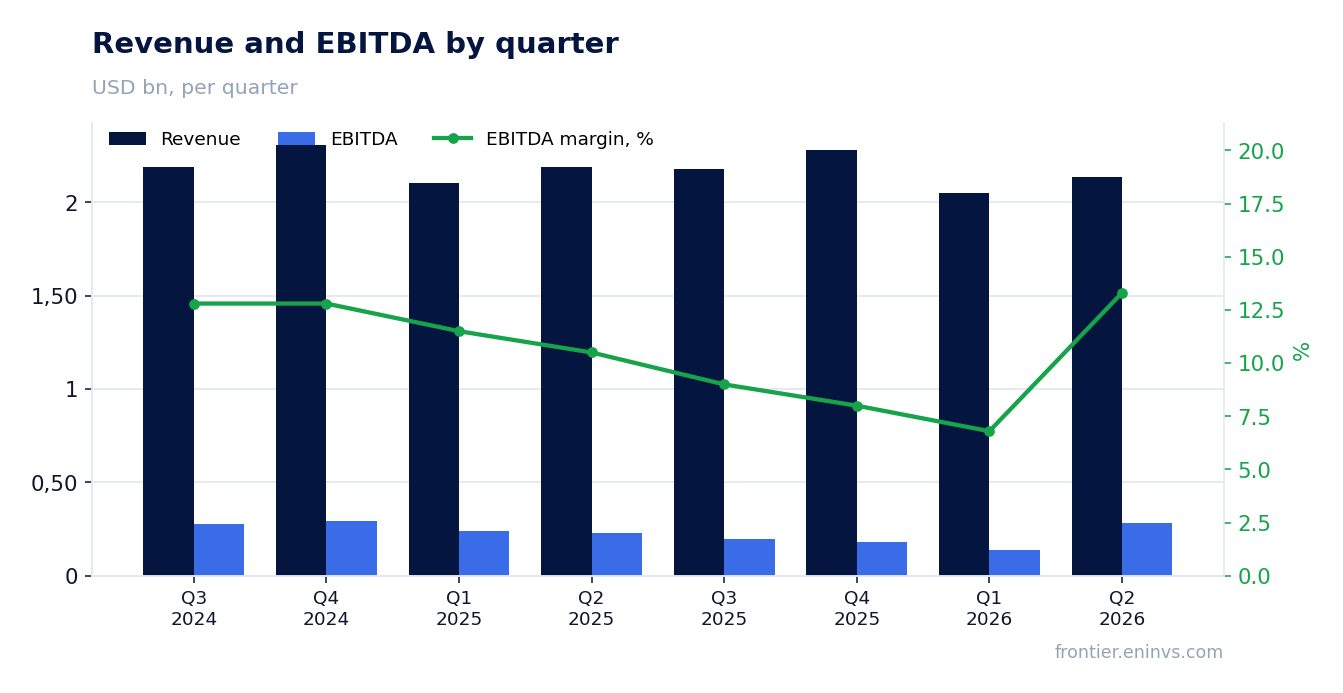
In the second quarter of 2026, National Oilwell Varco's revenue was $2,134 million, down 2.5% year-on-year. This is the fifth consecutive quarterly decline, but the pace slowed: in the first quarter the drop was 2.4%, in the fourth quarter of 2025 – 1.3%. Sequential growth to the first quarter was 4%, indicating some improvement from the start of the year.
The main contributor to the decline was the Energy Products and Services segment, whose revenue fell 5% to $974 million. The Energy Equipment segment grew 1% to $1,218 million. Weakness in Products and Services is linked to lower capital equipment sales, partly offset by growth in drill bit and artificial lift operations, as well as digital services.
The backlog of capital equipment orders at the end of June 2026 stood at $4.08 billion, down $220 million from a year earlier. Quarterly orders rose to $474 million from $420 million a year earlier, but the book-to-bill ratio remains below one – 74%. This means the company ships more than it books in new orders, putting pressure on future revenue.
EBITDA margin rose to 13.3% thanks to one-off tariff refunds of $40 million
Adjusted EBITDA in the second quarter of 2026 was $283 million, up 23.0% year-on-year. The EBITDA margin rose to 13.3% from 10.5% a year earlier. However, these $283 million include a one-off benefit of $40 million from tariff refunds. Without it, EBITDA would have been about $243 million, and the margin around 11.4%, still above last year's 10.5%.
Margin improvement occurred in both segments. In Energy Equipment, adjusted EBITDA rose $42 million to $200 million, with margin up to 16.4% from 13.1%. In Energy Products and Services, EBITDA fell $2 million to $144 million, but margin rose to 14.8% from 14.2%. Growth in Equipment was driven by strong execution on offshore projects nearing completion and a more favorable sales mix.
The one-off tariff refunds were unevenly distributed: $14 million in Energy Equipment and $26 million in Energy Products and Services. This means that without one-off factors, the Products and Services segment would have shown significantly weaker dynamics. The sustainability of the margin improvement is questionable given the revenue decline in this segment.
Net income grew 3.7% year-on-year, but quarter-on-quarter growth was manifold
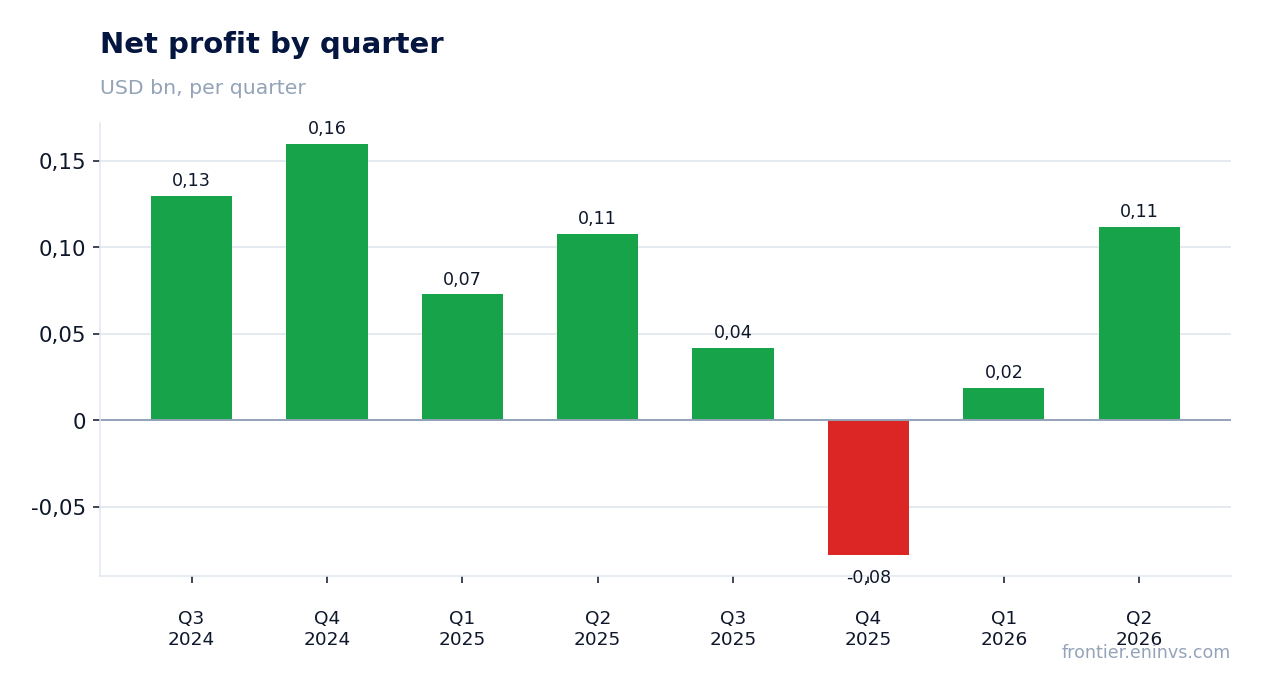
Net income in the second quarter of 2026 was $112 million, or $0.31 per share, up 3.7% year-on-year. Compared to the first quarter of 2026, profit increased almost sixfold from $19 million. Such a sharp rise is explained both by improved operations and the absence of large one-off write-offs that occurred in the first quarter.
Operating profit rose 35% to $193 million, or 9.0% of sales. In the first quarter it was only $47 million. Adjusted operating profit rose 15% to $190 million. In the reported quarter, the company recorded $17 million in pre-tax other items related to severance and facility closures, as well as $20 million in gains from asset sales.
Net income growth was restrained by a higher tax rate: the provision for income taxes was $41 million versus $1 million a year earlier. This is due to changes in income structure and one-off tax effects. Excluding one-off factors, profit could have been higher, but the quality of earnings remains questionable due to the contribution from tariff refunds.
Operating cash flow remains weak: $17 million for the quarter against $81 million capex
Operating cash flow in the second quarter of 2026 was only $17 million, significantly below $191 million a year earlier. With capital expenditures of $81 million, free cash flow was negative – minus $64 million. For the first half of 2026, operating cash flow was also negative – minus $9 million, and free cash flow – minus $155 million.
The weakness in cash flow is explained by a significant working capital outflow of $174 million. This is due to growth in receivables and inventories, which may reflect longer payment terms or inventory buildup ahead of expected growth in the second half. The company expects orders booked in the first half to support higher shipments in the second half.
For the first half of 2025, operating cash flow was positive – $326 million, making the current decline particularly notable. The company returned $127 million to shareholders through share repurchases and dividends, which, given negative free cash flow, was financed from cash reserves. The cash balance decreased to $1,164 million from $1,552 million at the end of 2025.
Debt load at 1.03x EBITDA LTM is moderate, but net debt rose to $1,162 million
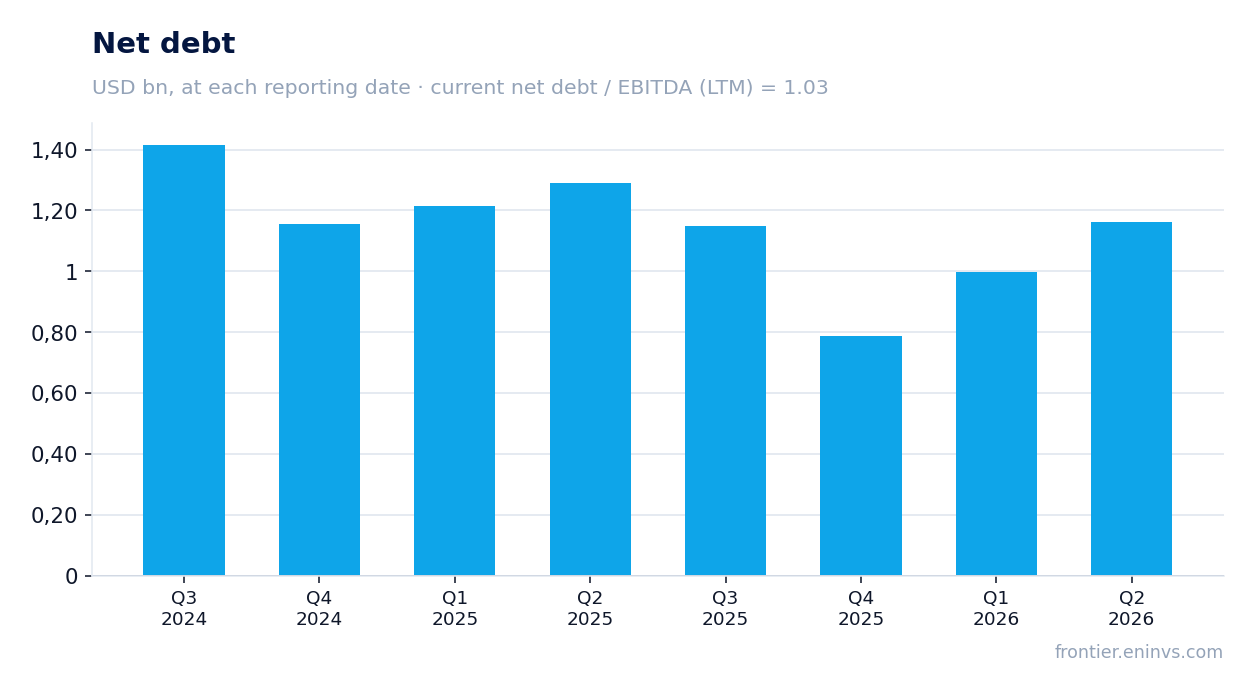
National Oilwell Varco's net debt at the end of the second quarter of 2026 was $1,162 million, corresponding to a net debt / EBITDA LTM ratio of 1.03. This is a moderate level of leverage that does not raise concerns. However, compared to the previous reporting date, net debt increased by 0.2 billion rubles, and over the last 12 months it decreased by 0.1 billion rubles.
The company's total debt is $1,706 million, of which $14 million is short-term and $1,692 million is long-term. The company has access to a revolving credit facility of $1.50 billion, providing good liquidity. Interest expense for the quarter was $21 million, corresponding to approximately 5% per annum on debt.
The net debt / EBITDA LTM ratio of 1.03 is comfortable for a company of this scale. However, debt growth amid negative free cash flow and ongoing share repurchases could lead to further increases in leverage if operating cash flow does not recover in the second half.
Dividend yield of 1.95% with $64 million paid in the quarter is modest against rates
In the second quarter of 2026, National Oilwell Varco paid $64 million in dividends and spent $63 million on share repurchases, returning a total of $127 million to shareholders. The current trailing 12-month dividend yield is 1.95%. This is a modest level, especially against high rates in the economy.
The company does not explicitly disclose its dividend policy, but historically pays stable dividends. With net income of $95 million over the last 12 months and quarterly payments of $64 million, the annual dividend volume could be around $256 million, exceeding annual profit. This means the payout ratio exceeds 100%, and payments are financed from cash flow and reserves.
Our estimate: if the current quarterly dividend is maintained, the annual yield will remain around 2%. However, the sustainability of payments depends on the recovery of operating cash flow. If free cash flow remains negative, the company may be forced to cut share repurchases or slow dividend growth. The key risk is further pressure on profit from weak demand for capital equipment.
Valuation: EV/EBITDA 11.2 versus historical average of 7.4 – the stock trades above its own history
The current EV/EBITDA LTM multiple is 11.2, significantly above the three-year average of 7.4. This means the stock trades at a premium to its own history. The P/E LTM multiple is 81.7, reflecting a low profit base over the last 12 months, including a loss in the fourth quarter of 2025.
The company's market capitalization is $7,764 million. With net debt of $1,162 million and EBITDA LTM of $766.5 million, EV/EBITDA is indeed 11.2. For comparison, the historical average of 7.4 suggests the market expects significant profit growth in the future. However, current results do not confirm such optimism: revenue is falling, and cash flow is negative.
According to the portal's model, which re-prices EBITDA at current commodity prices at the target EV/EBITDA, the upside to fair value is +27%. This is our own estimate, not a market consensus. It assumes current commodity prices persist and the company can improve operational efficiency. If oil prices fall or demand for equipment remains weak, the upside may not materialize.
Valuation on the latest reported figures
| Metric | Value |
|---|---|
| Market cap | 7.76 bn USD |
| P/E (LTM) | 81.7 |
| EV/EBITDA (LTM) | 11.2 |
| P/B | 1.24 |
| Net debt / EBITDA (LTM) | 1.03 |
| Operating cash flow (LTM) | 1.30 bn |
| ROE | 7.2% |
| Dividend yield (12m) | 2.0% |
| EV/EBITDA, 3-year average | 7.4 |
Bottom line
In the second quarter of 2026, National Oilwell Varco showed strong EBITDA growth of 23.0% and net income growth of 3.7% year-on-year, but these results rely heavily on a one-off tariff refund of $40 million. Revenue has been falling for the fifth consecutive quarter, although the decline has slowed. Operating cash flow remains weak, and free cash flow is negative, which, combined with generous shareholder returns, increases debt. The EV/EBITDA valuation of 11.2 is significantly above the historical average of 7.4, implying high market expectations. At the same time, the portal model indicates a +27% upside, making the stock rather attractive for those who believe in a recovery in equipment demand.
Open the company's financial profile NOV →
See also: market overview · valuation map · stock screeners