ONEOK: revenue accelerated to +52.8%, but margin compressed to 17.3% – growth on borrowed leverage
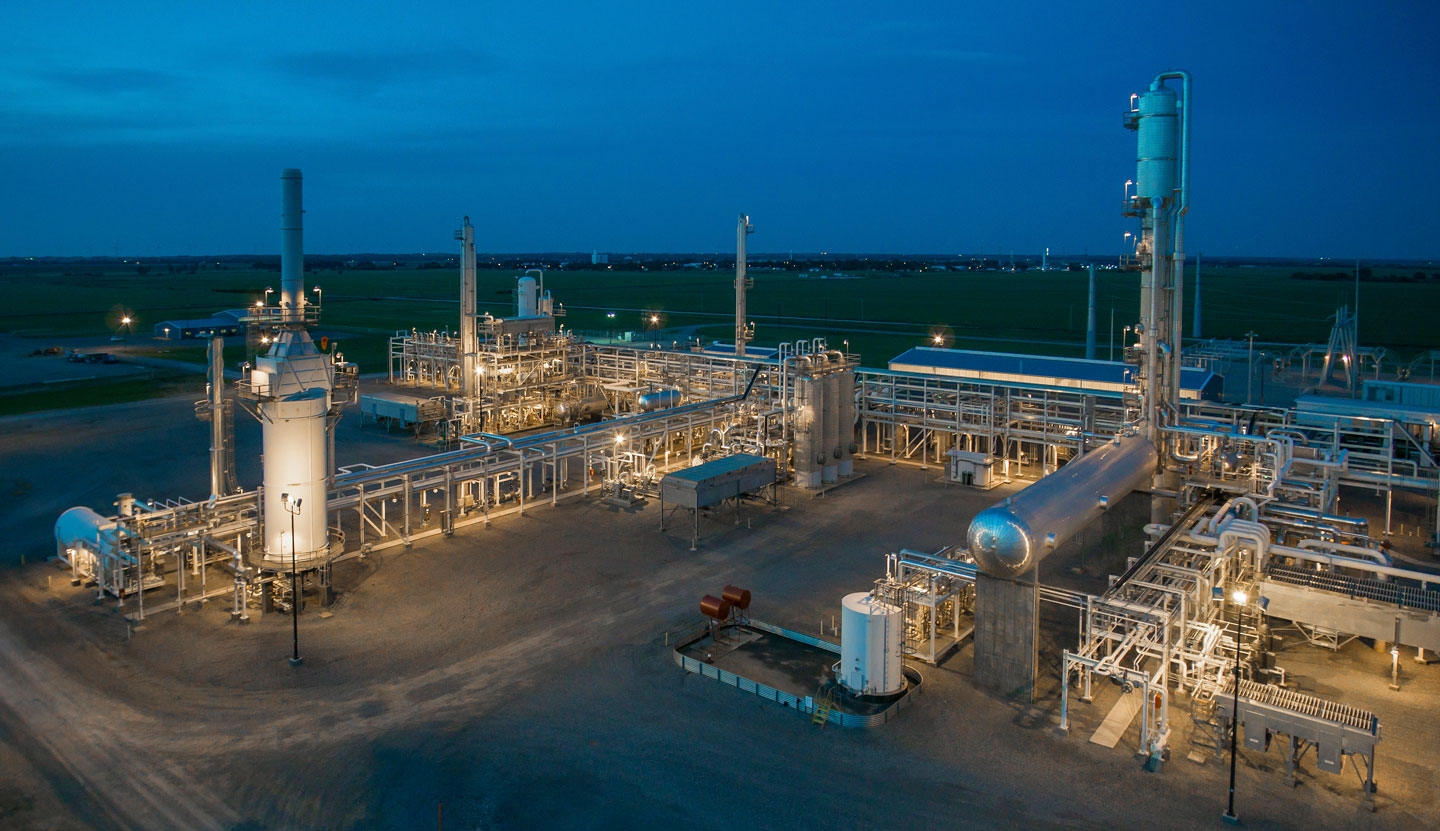
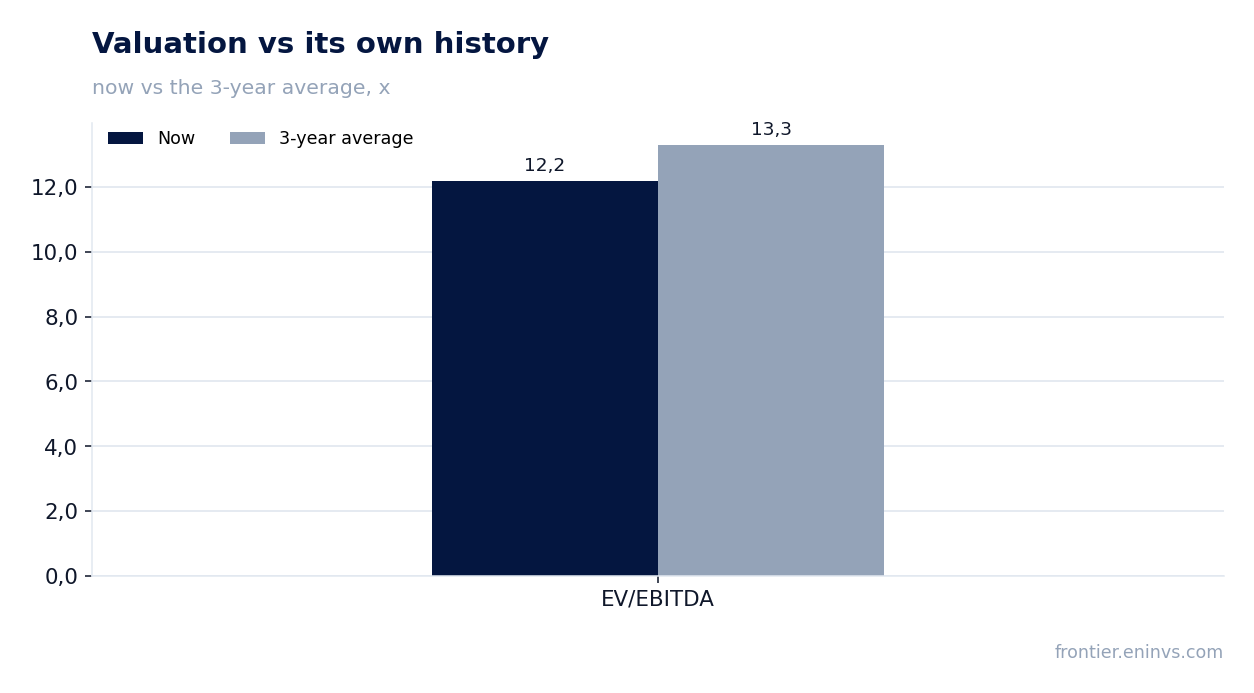
On August 25, ONEOK reported Q2 2026 results: revenue grew 52.8% YoY to $12,049 million, EBITDA rose 16.0% to $1,984 million, and net profit increased 14.9% to $966 million. Despite strong top-line growth, EBITDA margin contracted from 22.8% to 17.3%, and leverage remains high at 4.31x trailing-twelve-month EBITDA. At the current price, the share looks unattractive: the portal's model implies -26% to fair value, and EV/EBITDA (12.2x) is only slightly below its three-year average (13.3x).
Key takeaways
— Q2 2026 revenue grew 52.8% YoY to $12,049 million, accelerating from 19.6% in Q1
— EBITDA margin fell to 17.3% from 22.8% a year earlier – sales growth does not offset margin pressure
— Net profit rose only 14.9% to $966 million as operating efficiency declined
— Operating cash flow in Q2 was $2,053 million, nearly double the average of the previous four quarters ($1,254 million)
— Capex in Q2 fell to $613 million from $970 million in Q4 2025, but free cash flow remains constrained
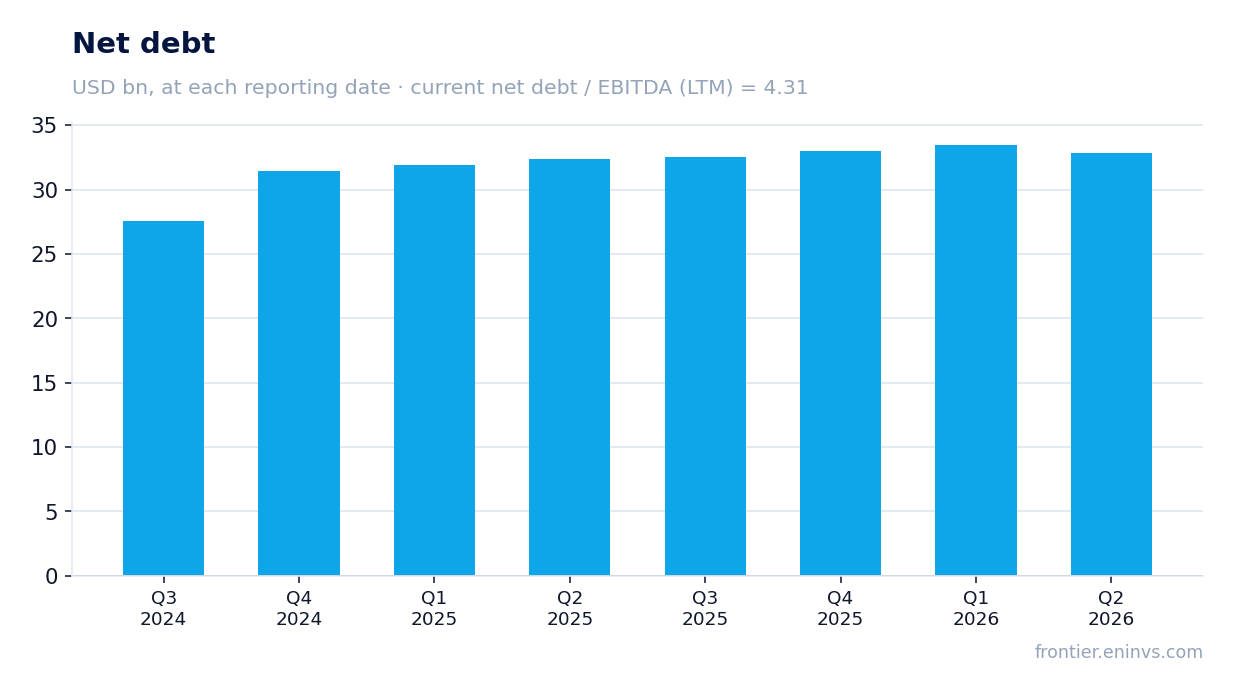
— Net debt decreased by $0.6 billion in the quarter to $32,861 million, but rose by $0.5 billion over the year – leverage at 4.31x EBITDA stays high
— Trailing dividend yield is 4.42% – at the current price, that is below historical levels and lags the key rate
Attractiveness
Key figures, USD bn
| Metric | Q2 2025 | Q2 2026 | Change |
|---|---|---|---|
| Revenue | 7.89 | 12.0 | +52.8% |
| EBITDA | 1.80 | 2.09 | +16.0% |
| Operating profit | 1.43 | 1.60 | +11.6% |
| Net profit | 0.84 | 0.97 | +14.9% |
| Operating cash flow | 1.52 | 2.05 | +34.6% |
| Capex | 0.75 | 0.61 | -18.2% |
| EBITDA margin | 22.8% | 17.3% | -5.5 pp |
| Net margin | 10.7% | 8.0% | -2.7 pp |
Q2 2026 revenue grew 52.8% YoY to $12,049 million, accelerating from 19.6% in Q1
In Q2 2026, ONEOK's revenue reached $12,049 million, up 52.8% from a year earlier. This is a notable acceleration from Q1 2026, when growth was 19.6%. Quarterly dynamics show the company is increasing volumes, likely driven by higher natural gas and NGL prices, as well as infrastructure expansion.
Over the trailing twelve months, revenue reached $39,400 million, reflecting a solid upward trend. However, it is important to note that this growth is accompanied by declining margins, raising questions about the quality of that growth.
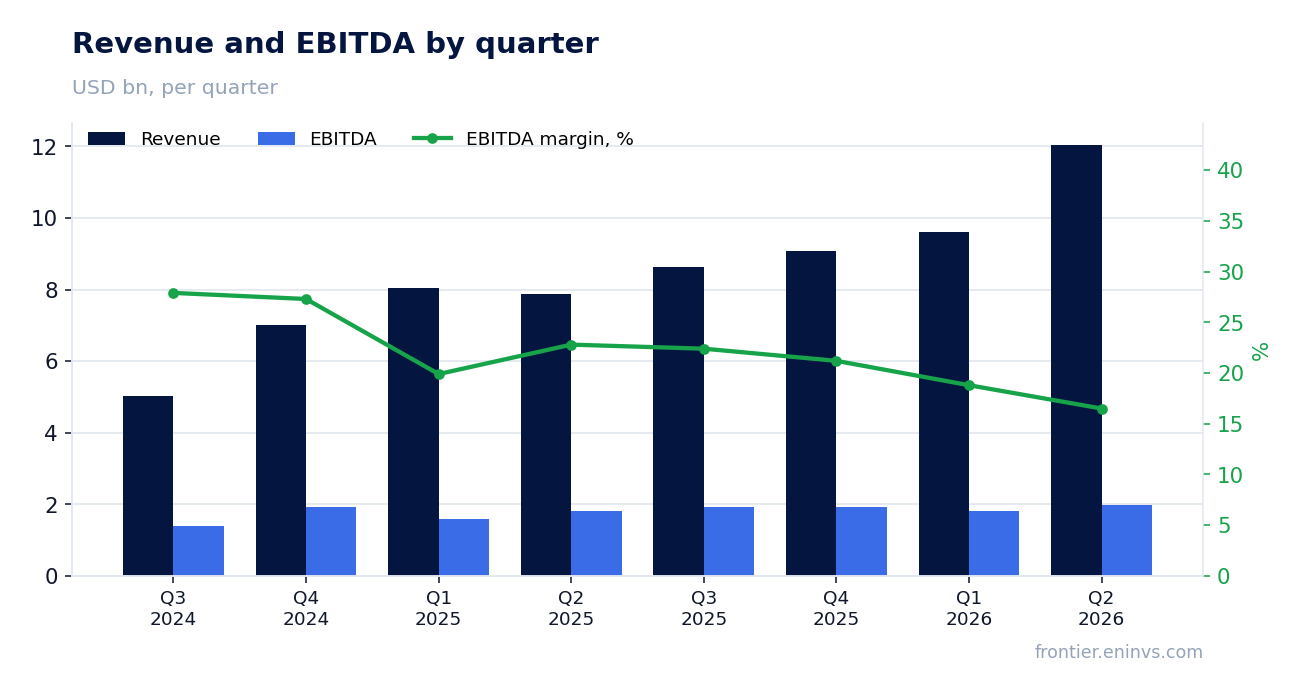
EBITDA margin fell to 17.3% from 22.8% a year earlier – sales growth does not offset margin pressure
EBITDA in Q2 2026 grew 16.0% YoY to $1,984 million, but that is significantly slower than revenue growth. As a result, EBITDA margin contracted from 22.8% to 17.3%. The main pressure appears to come from rising operating expenses that are not keeping pace with product prices.
The decline in margins is a key negative signal for investors. Even with strong top-line growth, the company cannot maintain profitability at previous levels, which may indicate intensifying competition or higher transportation and processing costs.
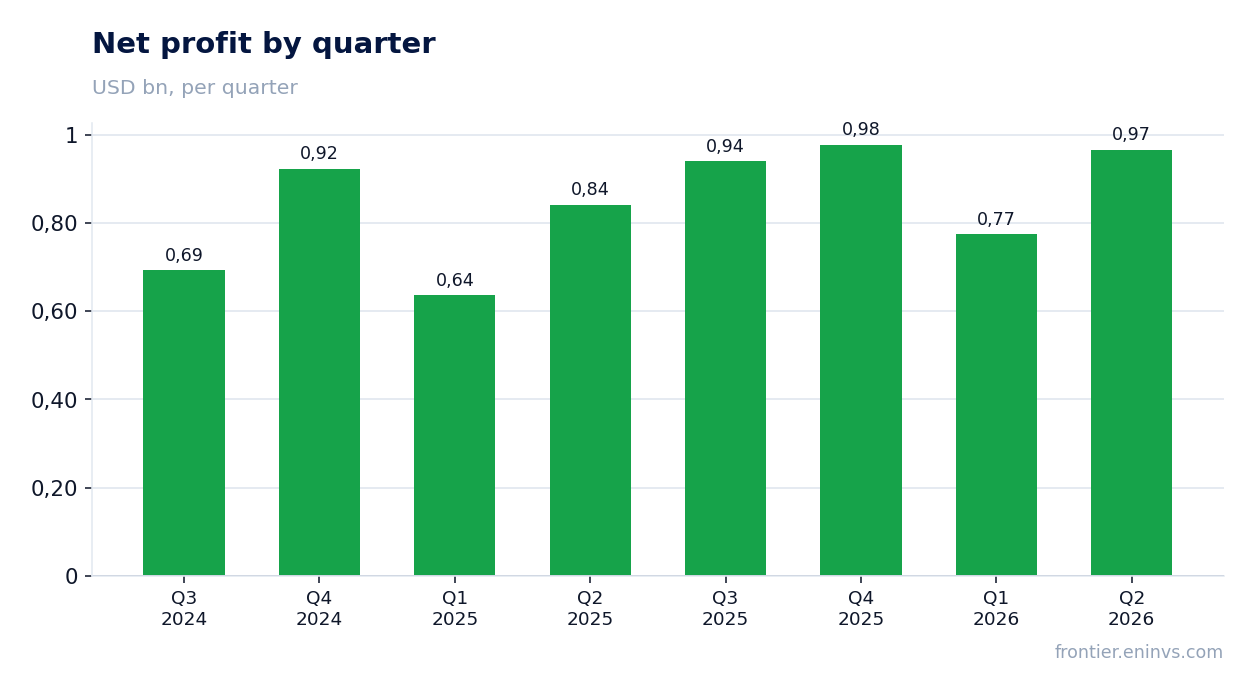
Net profit rose only 14.9% to $966 million as operating efficiency declined
Net profit for Q2 2026 was $966 million, up 14.9% from a year earlier. Profit growth significantly lags revenue, reflecting margin compression. Net margin fell from 10.7% to 8.0%.
Over the trailing twelve months, net profit reached $3,656 million, implying a return on equity of 17.1%. However, current dynamics show that the company's ability to convert revenue into profit is weakening.
Operating cash flow in Q2 was $2,053 million, nearly double the average of the previous four quarters ($1,254 million)
Operating cash flow in Q2 2026 reached $2,053 million, significantly above the average of the previous four quarters – about $1,254 million. This is a strong result, likely driven by improved working capital and seasonal factors.
Over the trailing twelve months, operating cash flow was $5,600 million. This covers capital expenditures, which totaled about $3,256 million over the same period (sum of quarterly values), leaving free cash flow of roughly $2,344 million.
Capex in Q2 fell to $613 million from $970 million in Q4 2025, but free cash flow remains constrained
Capital expenditures in Q2 2026 were $613 million, notably below the peak of $970 million in Q4 2025. The decline in capex may be due to the completion of major projects or seasonality.
Nevertheless, even with lower capex, free cash flow remains constrained. Over the trailing twelve months, it was about $2,344 million, which is insufficient to comfortably service debt and pay dividends without taking on new borrowings.
Net debt decreased by $0.6 billion in the quarter to $32,861 million, but rose by $0.5 billion over the year – leverage at 4.31x EBITDA stays high
At the end of Q2 2026, ONEOK's net debt stood at $32,861 million, down $0.6 billion from the previous reporting date. However, over the trailing twelve months, debt rose by $0.5 billion, indicating continued accumulation of borrowings.
The net debt to EBITDA ratio for the trailing twelve months is 4.31x. This is a high level that limits the company's financial flexibility and increases sensitivity to interest rate changes.
Trailing dividend yield is 4.42% – at the current price, that is below historical levels and lags the key rate
Over the trailing twelve months, ONEOK paid dividends providing a yield of 4.42% at the current share price. This is notably below the average yield of recent years, making the stock less attractive for income-oriented investors.
In a high key-rate environment, a dividend yield of 4.42% does not look competitive. For comparison, the risk-free rate in the US is currently higher, reducing the appeal of dividend stocks. Payouts could come under pressure if free cash flow continues to shrink.
Valuation: EV/EBITDA at 12.2x is only slightly below the three-year average (13.3x), and the portal's model implies -26%
The current EV/EBITDA multiple is 12.2x, only slightly below the three-year average of 13.3x. This suggests the stock is not cheap relative to its own history, especially given declining margins.
According to the portal's model, the fair value of the share is 26% below the current market price. This implies that the market has already priced in an optimistic scenario that may not materialize if margin pressure persists.
Valuation on the latest reported figures
| Metric | Value |
|---|---|
| Market cap | 60.3 bn USD |
| P/E (LTM) | 16.5 |
| EV/EBITDA (LTM) | 12.2 |
| P/B | 2.68 |
| Net debt / EBITDA (LTM) | 4.31 |
| Operating cash flow (LTM) | 5.60 bn |
| ROE | 17.1% |
| Dividend yield (12m) | 4.4% |
| EV/EBITDA, 3-year average | 13.3 |
Bottom line
Strong revenue growth in Q2 2026 (+52.8%) does not offset the decline in profitability: EBITDA margin fell to 17.3%, and net profit rose only 14.9%. Operating cash flow was strong, but free cash flow remains constrained, and leverage at 4.31x EBITDA is high. The dividend yield of 4.42% does not look attractive given the key rate. At the current price, the stock is valued higher than the portal's model suggests (-26%) and offers no margin of safety. Verdict – unattractive.
Open the company's financial profile OKE →
See also: market overview · valuation map · stock screeners