Osisko Gold Royalties: revenue more than doubled, but the entire gain went into a $283m royalty acquisition

Osisko Gold Royalties reported second-quarter 2026 results. Revenue rose 126.4% year on year to $97.8m, EBITDA by 149.7% to $88.2m, and net profit by 165.1% to $61.4m. The EBITDA margin reached 90.1% versus 81.7% a year earlier, while capital expenditure jumped to $282.9m as the company bought new royalties. The shares look unattractive: EV/EBITDA of 21.6 against its own three-year average of 29.8, but the portal model implies 51% downside to fair value, and a 0.32% dividend yield does not compensate for the risks.
Key takeaways
— Revenue rose 126.4% year on year to $97.8m, but almost all the gain came in one quarter – the fourth quarter of 2025 with $128.0m
— The EBITDA margin rose to 90.1% from 81.7% a year earlier, the best level in eight quarters
— Net profit rose 165.1% to $61.4m, but $59.3m of it came in the third quarter of 2025 – a one-off effect, not a sustainable flow
— Capital expenditure in the second quarter of 2026 was $282.9m – the company bought new royalties, three times quarterly revenue
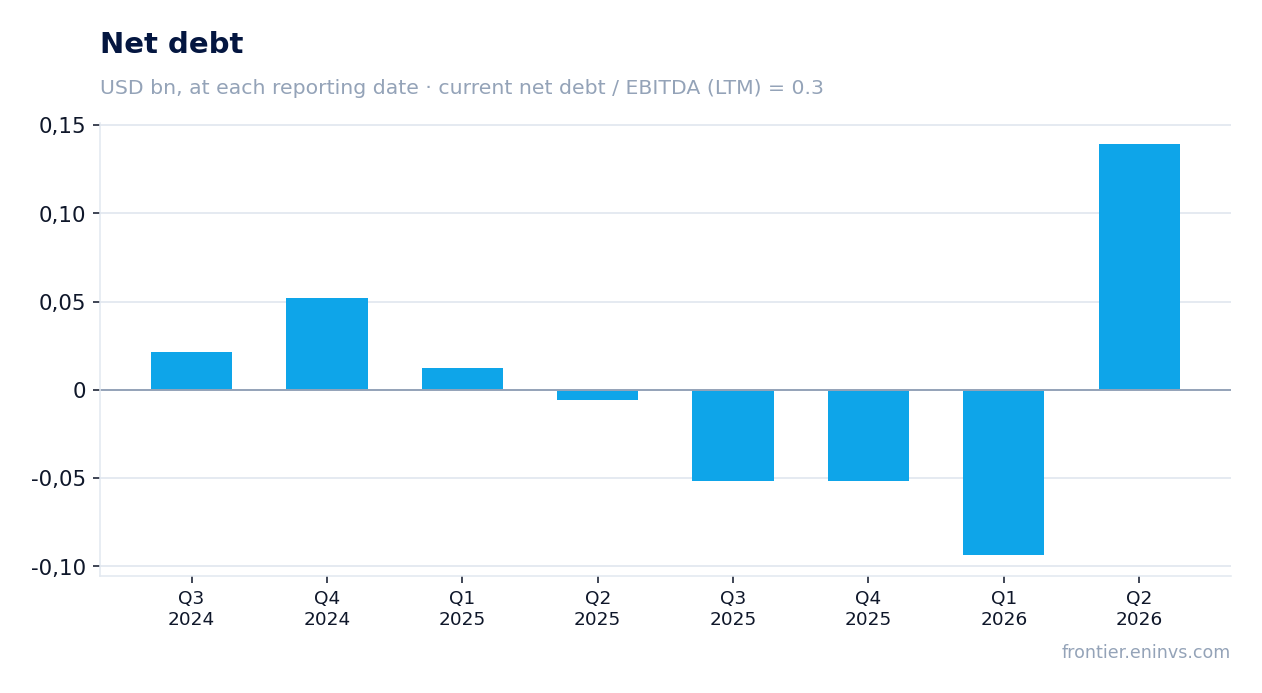
— Net debt at the end of the quarter was $98.7m, with net debt to LTM EBITDA at 0.3, still a comfortable level
— The trailing 12-month dividend yield is 0.32%, below the key rate and offering no support for the shares
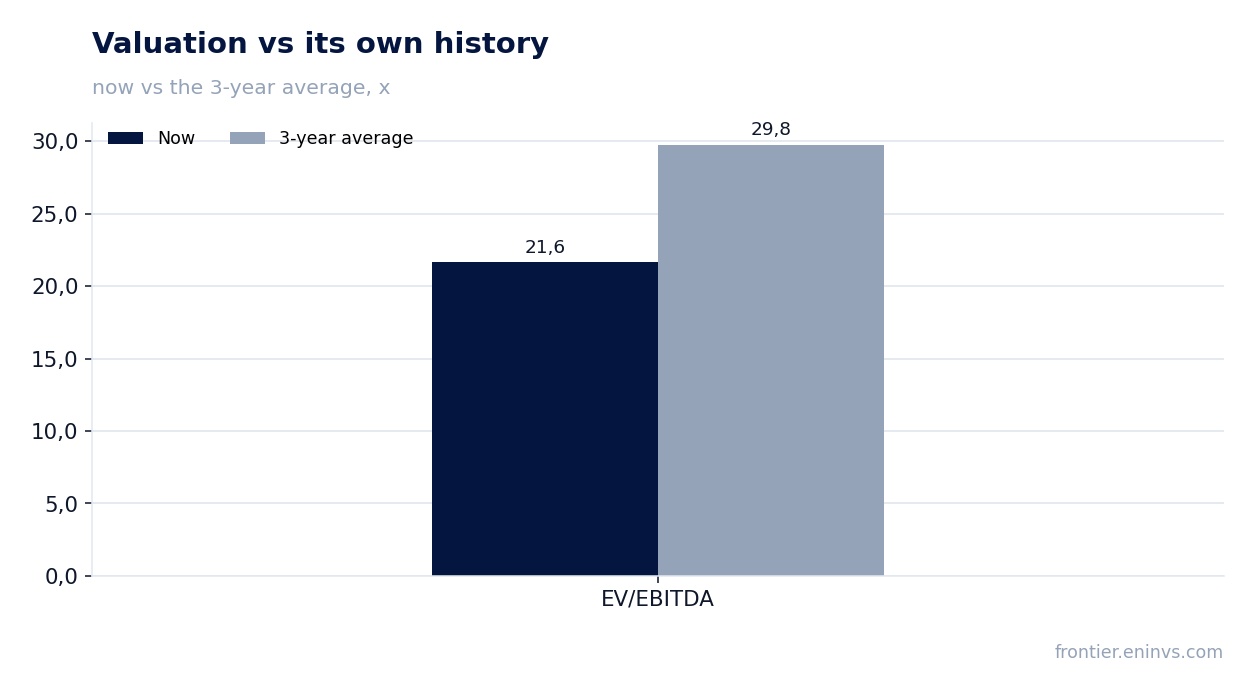
— EV/EBITDA LTM of 21.6 against its own three-year average of 29.8 – the stock trades below its historical valuation, but the portal model implies 51% downside to fair value
Attractiveness
Key figures, USD bn
| Metric | Q2 2025 | Q2 2026 | Change |
|---|---|---|---|
| Revenue | 0.04 | 0.10 | +126.4% |
| EBITDA | 0.04 | 0.09 | +149.7% |
| Operating profit | 0.03 | 0.08 | +154.0% |
| Net profit | 0.02 | 0.06 | +165.1% |
| Operating cash flow | 0.04 | 0.08 | +126.2% |
| Capex | 0.01 | 0.28 | +2104.8% |
| EBITDA margin | 81.7% | 90.1% | +8.4 pp |
| Net margin | 53.6% | 62.8% | +9.2 pp |
Revenue rose 126.4% year on year to $97.8m, but almost all the gain came in one quarter – the fourth quarter of 2025 with $128.0m
In the second quarter of 2026, Osisko Gold Royalties' revenue was $97.8m, up 126.4% year on year. Such growth looks impressive, but it reflects a low base effect rather than organic acceleration: in the second quarter of 2025, revenue was only $43.2m. The main jump occurred in the fourth quarter of 2025, when revenue reached $128.0m – up 121.9% from the fourth quarter of 2024.
In the first quarter of 2026, revenue was $102.8m, up 87.3% year on year. Thus, the last two quarters show a consistently high level – around $100m per quarter, twice the average level of 2025. This is linked to the acquisition of new royalties and rising gold prices, but the exact reasons are not detailed in the report.
For an investor, it is important that revenue growth is not linear: the company depends on production volumes at mines where it holds royalties and on metal prices. The last two quarters demonstrate that the new scale of the business has taken hold, but the sustainability of this level will depend on further acquisitions and market conditions.
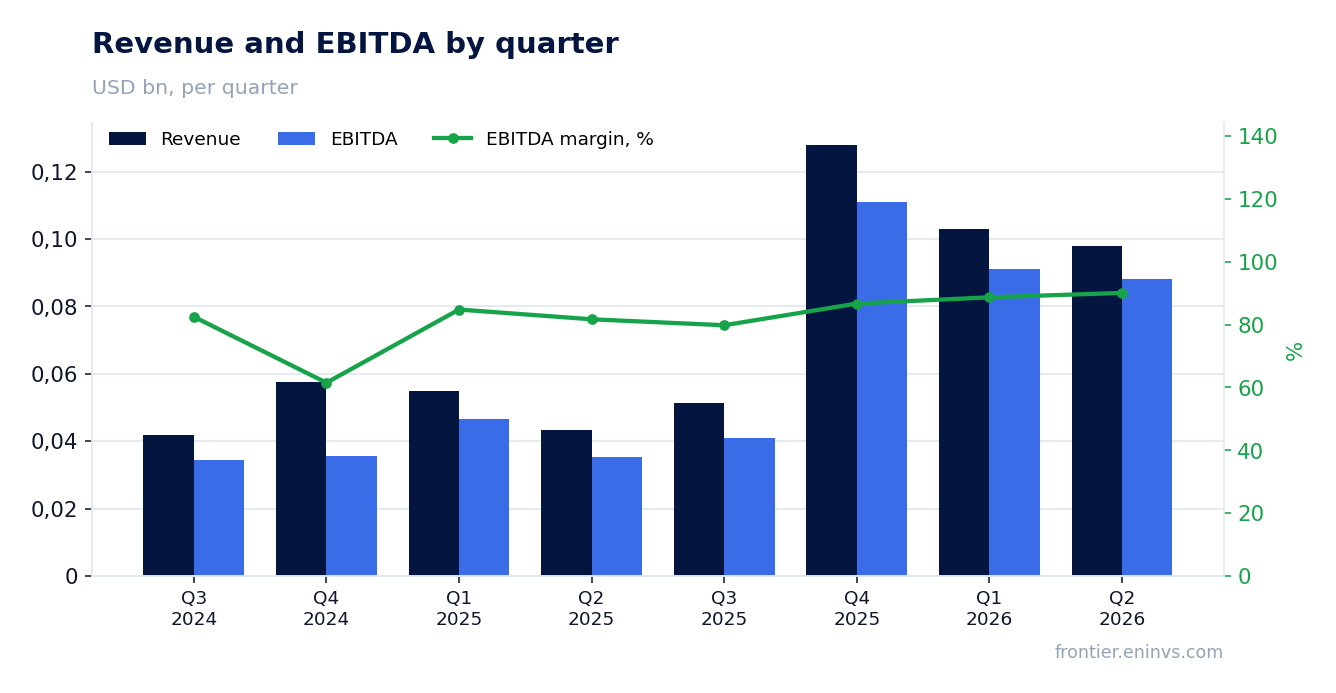
The EBITDA margin rose to 90.1% from 81.7% a year earlier, the best level in eight quarters
In the second quarter of 2026, EBITDA was $88.2m, and the EBITDA margin was 90.1%. A year earlier, these figures were $35.3m and 81.7%, respectively. The margin expansion of 8.4 percentage points is explained by revenue growing faster than costs: for royalty companies, operating expenses are relatively fixed, so each additional dollar of revenue almost entirely flows into EBITDA.
Among the last eight quarters, the 90.1% margin is the highest. For comparison, in the fourth quarter of 2025 it was 86.7%, and in the first quarter of 2026 – 88.7%. This indicates that the company not only increased revenue but also maintained high efficiency.
However, such a high margin is a feature of the royalty business model, not the result of unique management efforts. It cannot grow indefinitely, and in the future any decline in metal prices or increase in administrative expenses could lead to its correction.
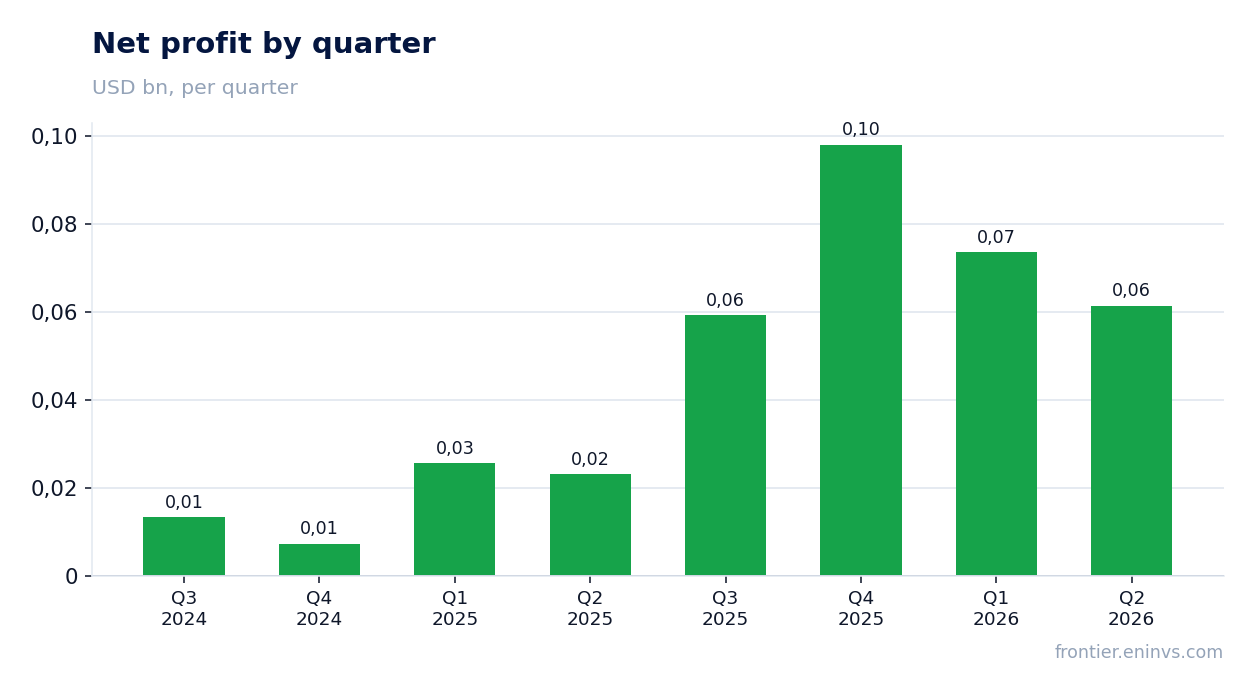
Net profit rose 165.1% to $61.4m, but $59.3m of it came in the third quarter of 2025 – a one-off effect, not a sustainable flow
Net profit in the second quarter of 2026 was $61.4m, up 165.1% year on year. However, looking at the quarterly dynamics, the third quarter of 2025 stands out with abnormally high profit – $59.3m on revenue of only $51.3m. This means that in that quarter the company received significant one-off income unrelated to core operations.
In the fourth quarter of 2025, net profit was $98.0m, in the first quarter of 2026 – $73.6m, in the second – $61.4m. Thus, profit is consistently declining from the peak reached at the end of 2025. This may be due to increased depreciation after acquiring new royalties or a change in revenue structure.
For assessing business sustainability, operating profit is more important, which in the second quarter of 2026 was $75.3m. It also grew year on year, but not as dramatically as net profit. An investor should focus on operating metrics, not one-off spikes in net profit.
Capital expenditure in the second quarter of 2026 was $282.9m – the company bought new royalties, three times quarterly revenue
Capital expenditure in the second quarter of 2026 reached $282.9m, significantly exceeding both revenue ($97.8m) and operating cash flow ($83.2m). This means the company actively invested in acquiring new royalties, financing them from available funds and possibly debt. For royalty companies, such investments are the main way to grow, and they may pay off in the future.
Operating cash flow for the quarter was $83.2m, up 126.3% year on year ($36.8m). However, these funds are insufficient to cover capital expenditure, so net debt rose to $98.7m from a negative value in the previous quarter. This is the first quarter with positive net debt after several quarters with a net cash position.
It is important for an investor to understand that such large investments could lead to revenue growth in the future, but they also increase risk. If the acquired assets do not meet expectations, the company may face write-offs or slower growth.
Net debt at the end of the quarter was $98.7m, with net debt to LTM EBITDA at 0.3, still a comfortable level
At the end of the second quarter of 2026, Osisko Gold Royalties' net debt was $98.7m. This is the first quarter with positive net debt after a period when the company had a net cash position: in the first quarter of 2026, net debt was negative (–$93.7m), and in the second quarter of 2025 – also negative (–$6.0m). The increase in debt is linked to large capital expenditures on royalty acquisitions.
The ratio of net debt to EBITDA for the last 12 months is 0.3. This is a low level, indicating that the company can easily service its debt. However, the FACTS do not provide a previous value for this ratio, so it cannot be stated that leverage rose or fell – only the current level can be noted.
Interest expenses are not highlighted in the provided data, but at this debt level they should not put significant pressure on profit. The main risk is that the company may continue to finance acquisitions with debt, leading to a further increase in the ratio.
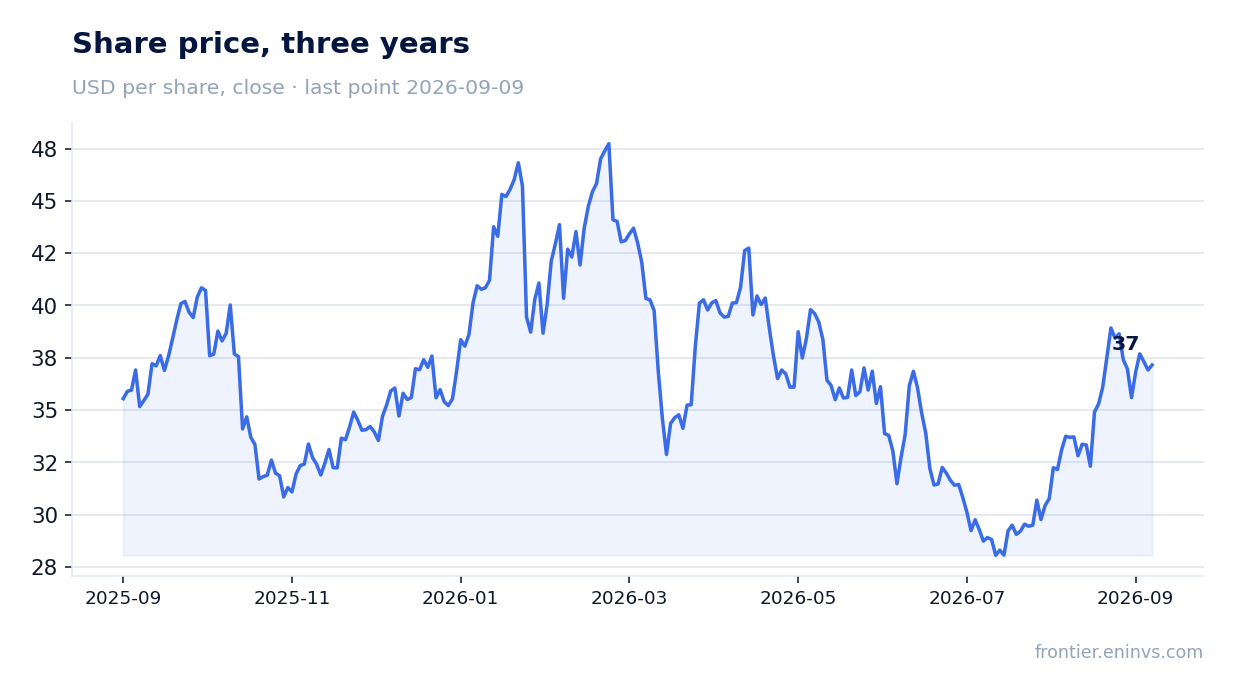
The trailing 12-month dividend yield is 0.32%, below the key rate and offering no support for the shares
The dividend yield of Osisko Gold Royalties over the last 12 months is 0.32%. This is an extremely low level that is not attractive to income-oriented investors. For comparison, the key rate in Russia is significantly higher, but even without this comparison, 0.32% is a symbolic payment that does not compensate for the risks of owning the shares.
The company is not a dividend story: its main goal is growth through royalty acquisitions, not returning capital to shareholders. The provided data does not include information on the dividend per share or payout policy, but the current yield indicates that dividends are not a significant factor in valuation.
An investor should not count on substantial dividend income. If the company increases payouts, this could be a positive signal, but for now the dividend yield does not affect the investment case.
EV/EBITDA LTM of 21.6 against its own three-year average of 29.8 – the stock trades below its historical valuation, but the portal model implies 51% downside to fair value
The current valuation of Osisko Gold Royalties based on EV/EBITDA for the last 12 months is 21.6. This is below its own three-year average of 29.8, meaning the shares trade at a discount to their historical valuation. On a P/E LTM basis, the multiple is 24.0. This dynamic may indicate that the market is pricing in lower profits or higher risks.
However, the portal model, which recalculates EBITDA at current commodity prices and the target EV/EBITDA, implies a fair value 51% below the current market capitalisation. This means that even with the historical discount, the shares appear overvalued relative to the fundamental value calculated by our model.
The company's market capitalisation is $7.03bn. With the current debt level, EV is about $7.13bn. If EBITDA remains at the LTM level of $329.4m, then to justify the current price the multiple should be around 21.6, which is below the historical average but still higher than the portal model implies. An investor should note that the portal model is our own calculation, not a consensus forecast.
Valuation on the latest reported figures
| Metric | Value |
|---|---|
| Market cap | 7.03 bn USD |
| P/E (LTM) | 24.0 |
| EV/EBITDA (LTM) | 21.6 |
| P/B | 5.63 |
| Net debt / EBITDA (LTM) | 0.30 |
| Operating cash flow (LTM) | 0.25 bn |
| ROE | 16.6% |
| Dividend yield (12m) | 0.3% |
| EV/EBITDA, 3-year average | 29.8 |
Bottom line
In the second quarter of 2026, Osisko Gold Royalties showed strong revenue and profit growth, but this growth was driven by a low base from the previous year and one-off factors. The EBITDA margin reached 90.1%, the highest in eight quarters, but the sustainability of this level is questionable. The company actively invested $282.9m in new royalties, which led to an increase in net debt to $98.7m. The dividend yield of 0.32% offers no support for the shares. The EV/EBITDA valuation of 21.6 is below the historical average of 29.8, but the portal model indicates 51% downside potential. The shares look unattractive to an investor at current levels.
Open the company's financial profile OR →
See also: market overview · valuation map · stock screeners