Occidental Petroleum: quarterly profit up 6.4x, but one-offs drive the surge
On July 10, Occidental Petroleum reported Q2 2026 results: revenue rose 10.0% YoY to $7,053 million, EBITDA jumped 115.5% to $5,762 million, and net profit surged 540.2% to $2,996 million. Much of the profit growth came from one-off items, and at the current price the share looks rather attractive: EV/EBITDA is below its own three-year average, and the portal's model implies 16% upside.
Key takeaways
— Q2 revenue grew 10% on strong oil prices
— EBITDA margin jumped to 81.7% – driven by one-off gains, not just operations
— Net profit rose 6.4x, but a large part is one-off items
— Debt fell by $2.1 billion in the quarter, Net Debt/EBITDA at 1.36
— Dividend yield of 1.63% – below historical levels, but the company is actively repaying debt
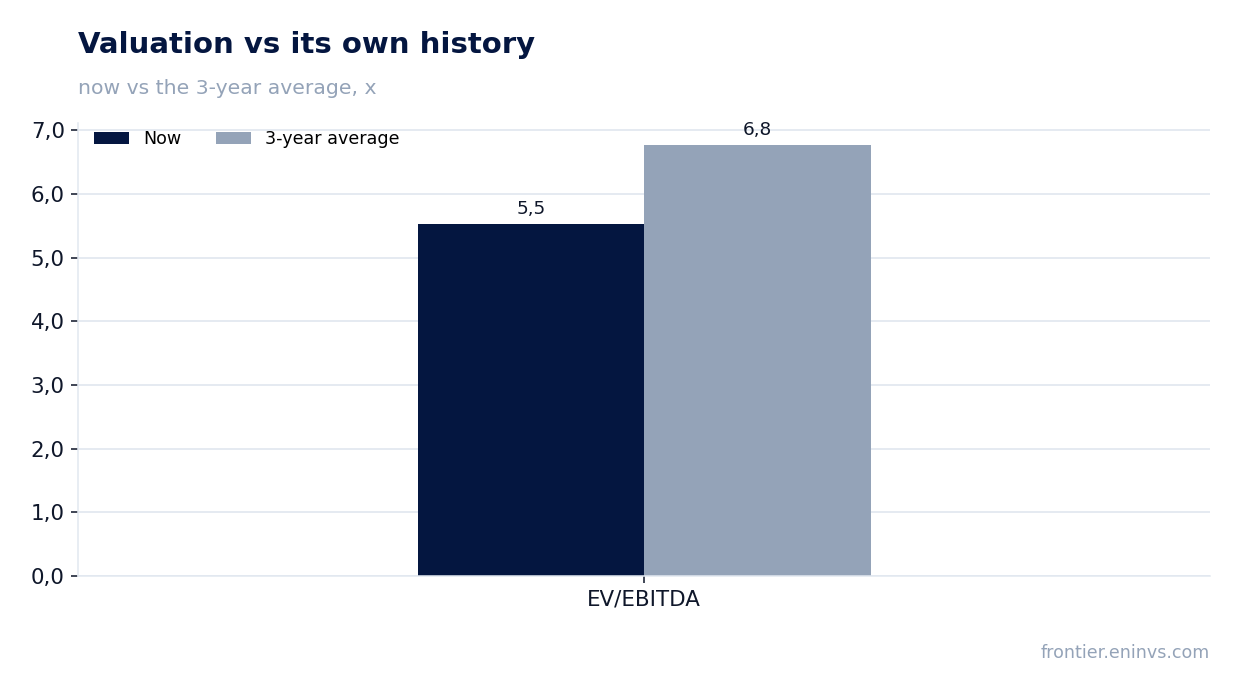
— Valuation: EV/EBITDA 5.53 vs 6.77 three-year average, portal model implies +16% upside
Attractiveness
Key figures, USD bn
| Metric | Q2 2025 | Q2 2026 | Change |
|---|---|---|---|
| Revenue | 6.41 | 7.05 | +10.0% |
| EBITDA | 2.67 | 5.76 | +115.5% |
| Operating profit | 0.74 | 3.92 | +430.5% |
| Net profit | 0.47 | 3.00 | +540.2% |
| Operating cash flow | 2.96 | 5.10 | +72.3% |
| Capex | 2.22 | 1.59 | -28.6% |
| EBITDA margin | 41.7% | 81.7% | +40.0 pp |
| Net margin | 7.3% | 42.5% | +35.2 pp |
Q2 revenue grew 10% on strong oil prices
In Q2 2026, Occidental Petroleum's revenue reached $7,053 million, up 10.0% YoY. Growth was driven by strong oil prices: average WTI was $92.79/bbl, Brent – $97.06/bbl. Worldwide realized oil price hit $96.78/bbl, or 104% of WTI and 100% of Brent.
Quarterly revenue dynamics were volatile: in Q1 2026 it fell 8.3% YoY, but in Q2 it turned to growth. Over the last twelve months, revenue was $21,800 million, reflecting a mixed picture: weak gas prices were partly offset by firm oil.
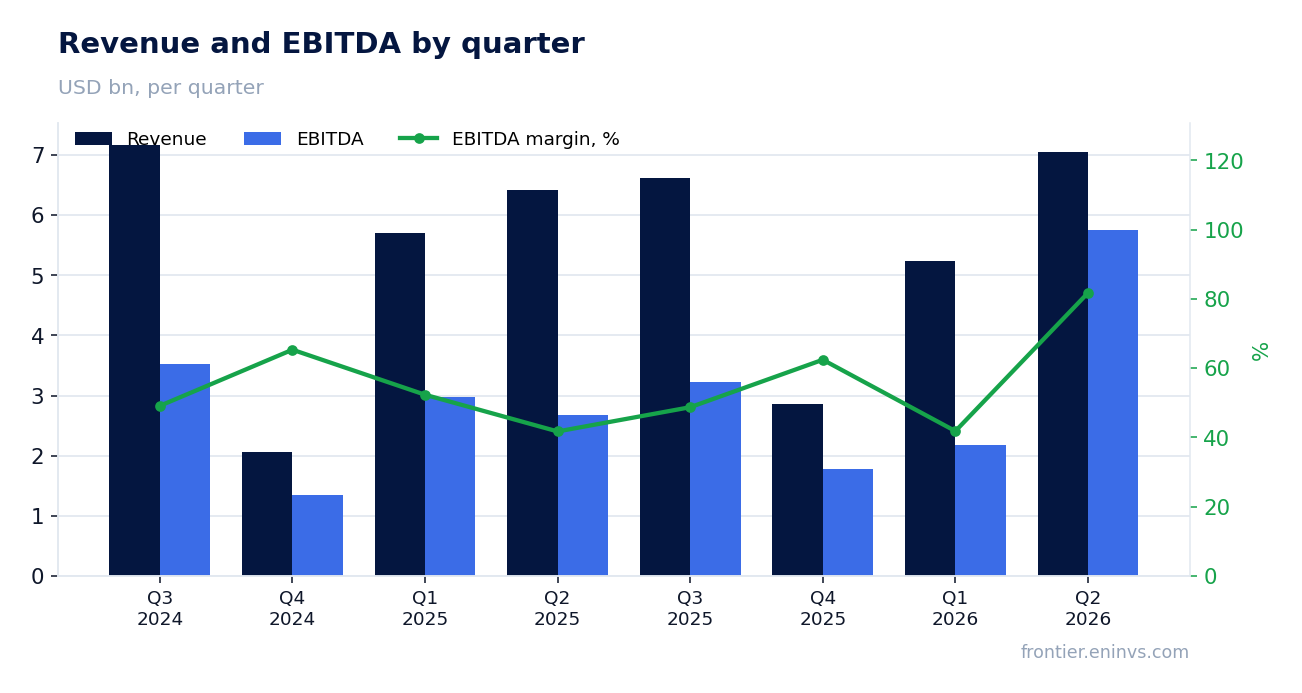
EBITDA margin jumped to 81.7% – driven by one-off gains, not just operations
EBITDA in Q2 2026 reached $5,762 million, up 115.5% YoY. EBITDA margin jumped to 81.7% from 41.7% in Q2 2025. Such a leap cannot be explained solely by higher oil prices – one-off gains, possibly from revaluation or asset sales, likely played a significant role.
Operating profit rose to $3,915 million from $738 million a year earlier, also pointing to extraordinary items. Without them, margins would be notably lower, though still supported by high oil prices.
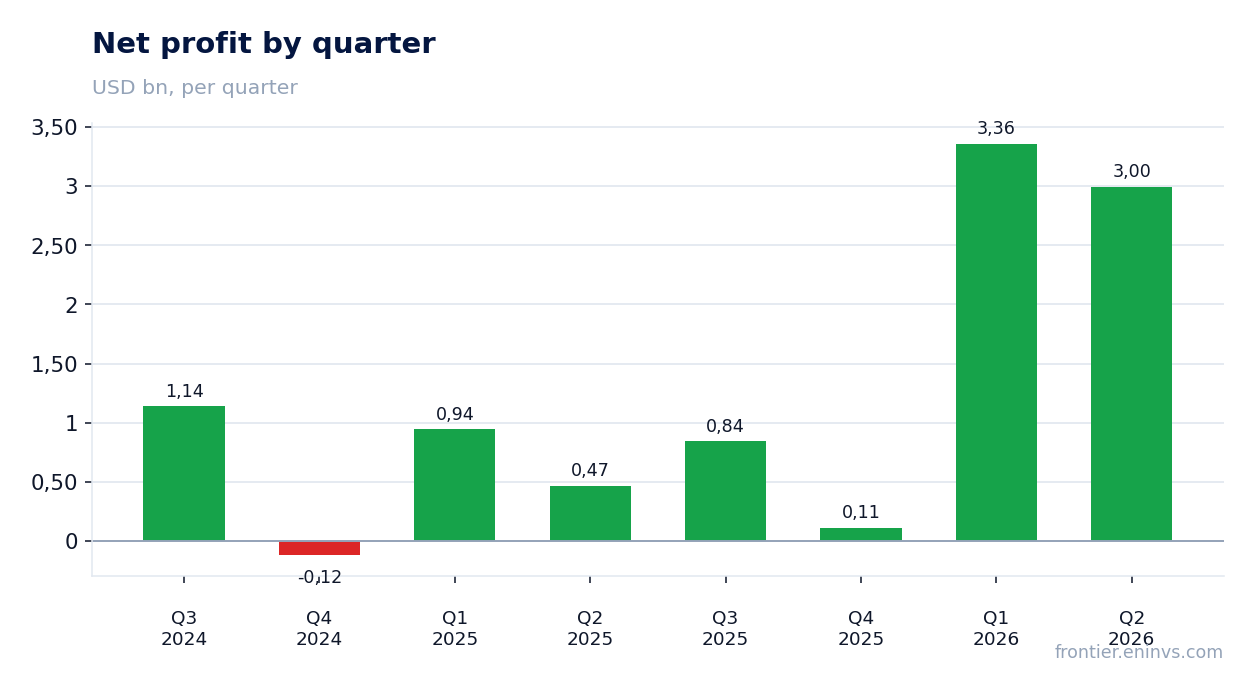
Net profit rose 6.4x, but a large part is one-off items
Net profit for Q2 2026 was $2,996 million versus $468 million a year earlier – a 6.4x increase. Net margin reached 42.5% versus 7.3% in Q2 2025. Such a high margin is a result of one-off gains that also boosted EBITDA and operating profit.
Over the last twelve months, net profit was $7,311 million, implying a P/E LTM of 8.27. Excluding one-offs, profit would be much lower, so the multiple may be deceptively low.
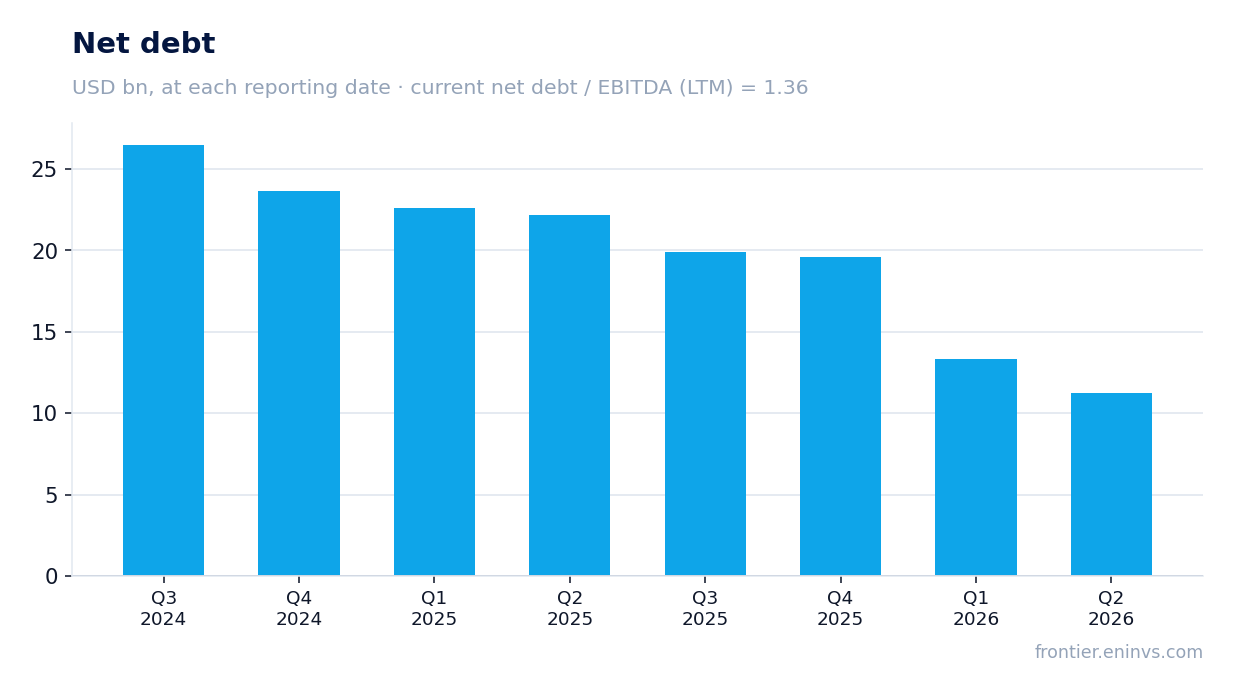
Debt fell by $2.1 billion in the quarter, Net Debt/EBITDA at 1.36
Net debt at the end of Q2 2026 was $11,216 million, down $2.1 billion from the previous reporting date. Over the last twelve months, debt fell by $11.0 billion – the company is actively using free cash flow to repay obligations.
Operating cash flow in Q2 reached $5,100 million, almost double the average of previous quarters. Capital expenditures were $1,589 million, leaving substantial free cash flow for debt reduction. Net debt/EBITDA LTM stands at 1.36, a moderate level for an oil company.
Dividend yield of 1.63% – below historical levels, but the company is actively repaying debt
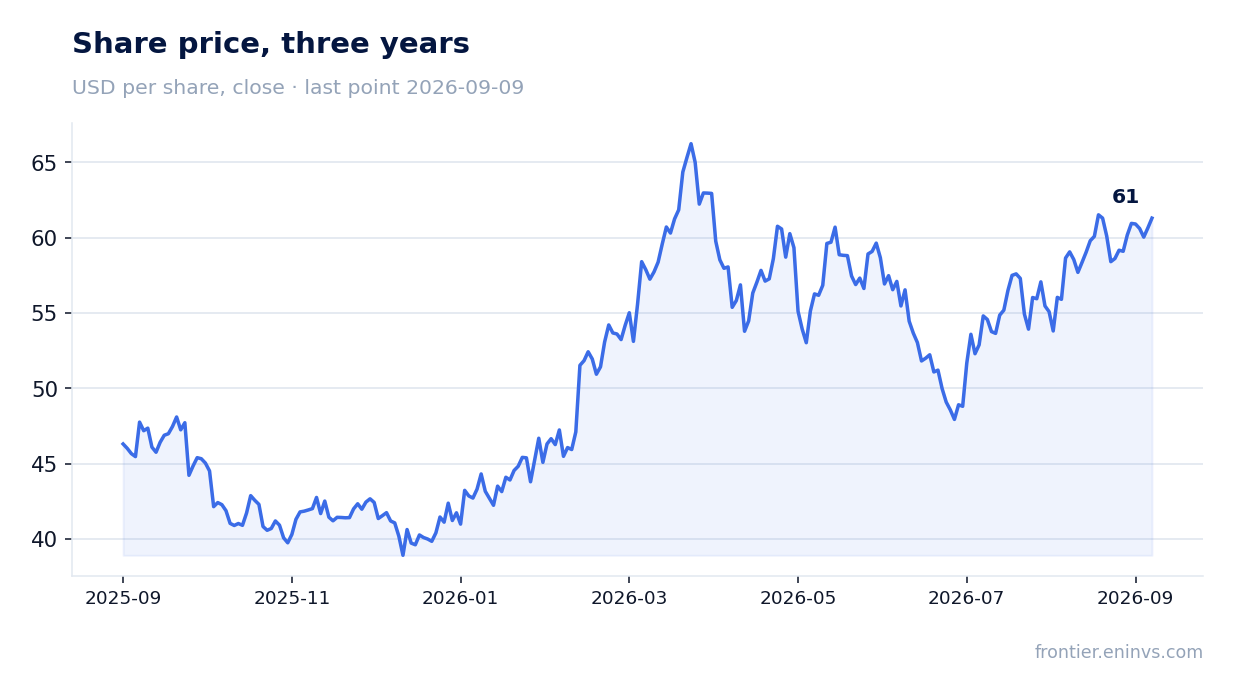
Over the last twelve months, Occidental Petroleum's dividend yield was 1.63% at the current share price. This is relatively modest, reflecting the company's priority on debt reduction over increasing shareholder payouts.
In the Q2 report, the company did not announce a dividend increase. Payouts are expected to remain at current levels unless the company decides to raise the payout ratio after achieving debt targets. At the current yield, the dividend is unlikely to be a primary driver for investors, but it is backed by solid cash flow.
Valuation: EV/EBITDA 5.53 vs 6.77 three-year average, portal model implies +16% upside
Current EV/EBITDA LTM is 5.53, well below the three-year average of 6.77. This suggests the market values the company at a discount to its own history, despite strong quarterly results. P/E LTM is 8.27, also looking attractive, though adjusted for one-offs.
According to the portal's model, which re-prices EBITDA at current commodity prices and applies a target EV/EBITDA, the share has +16% upside to its current price. This is our own calculation, not market consensus. If oil prices stay at current levels and the company continues to reduce debt, the share has every chance of further growth.
Valuation on the latest reported figures
| Metric | Value |
|---|---|
| Market cap | 60.4 bn USD |
| P/E (LTM) | 8.3 |
| EV/EBITDA (LTM) | 5.5 |
| P/B | 1.68 |
| Net debt / EBITDA (LTM) | 1.36 |
| Operating cash flow (LTM) | 10.5 bn |
| ROE | 29.7% |
| Dividend yield (12m) | 1.6% |
| EV/EBITDA, 3-year average | 6.8 |
Bottom line
The Q2 2026 report was strong: revenue grew 10%, EBITDA more than doubled, and debt fell by $2.1 billion in the quarter. However, a large part of profit came from one-offs, so the sustainability of such results is questionable. Valuation remains attractive: EV/EBITDA is below its own three-year average, and the portal's model implies +16% upside. The key question for holders is whether oil prices stay at current levels and whether the company can generate comparable cash flow without one-off gains.
Open the company's financial profile OXY →
See also: market overview · valuation map · stock screeners