Pan American Silver: profit up 61%, but cash flow lagged it by nearly half
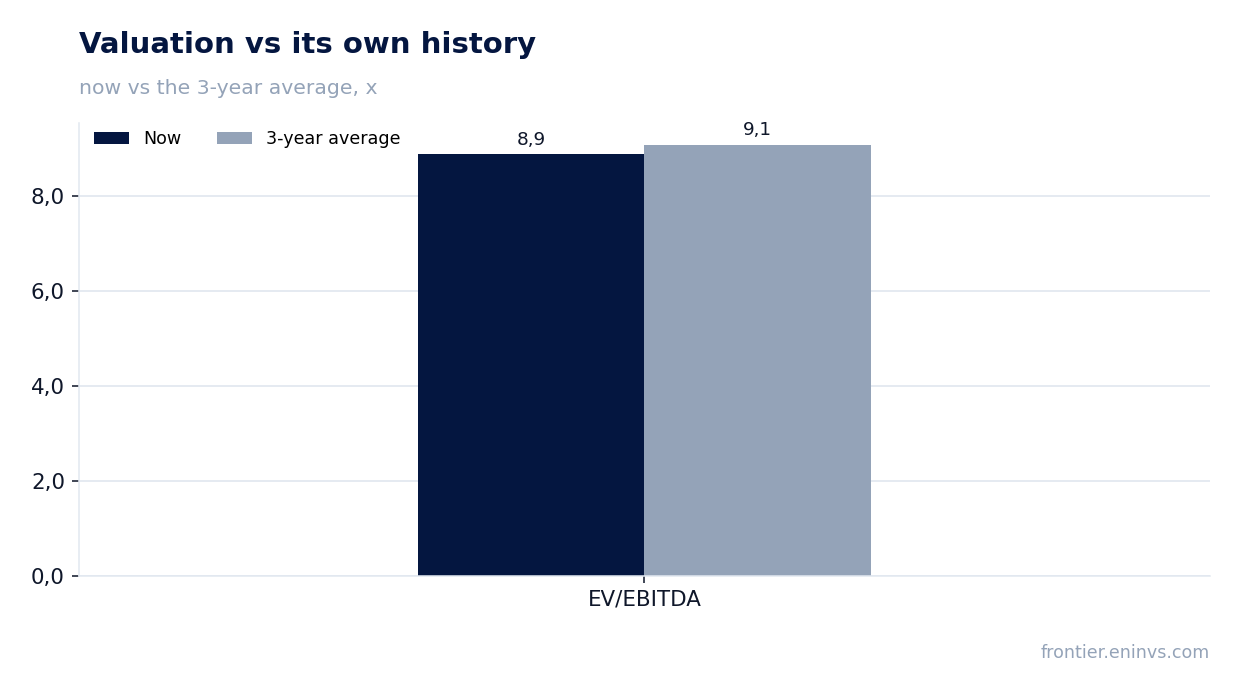
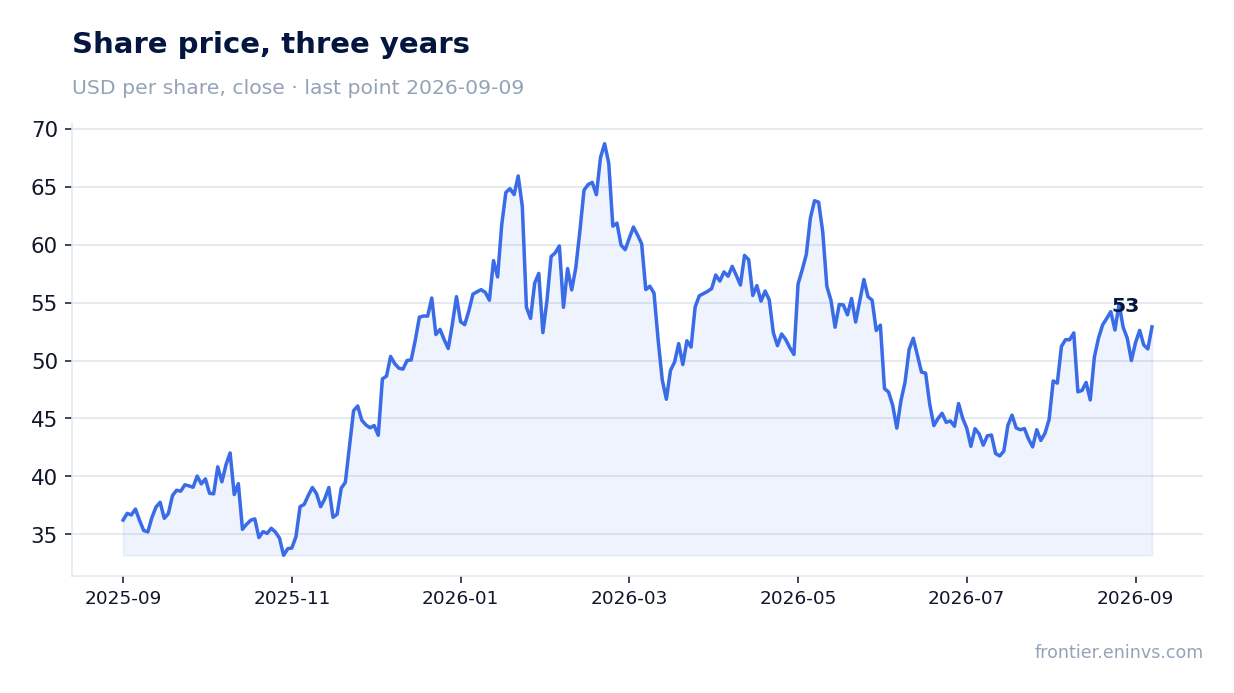
On 25 August Pan American Silver reported results for the second quarter of 2026. Revenue rose 38.4% year on year to USD 1,124.0 million, EBITDA – by 56.0% to USD 547.0 million, net profit – by 60.7% to USD 304.0 million. The EBITDA margin climbed to 48.7% from 43.2% a year earlier, and the net margin – to 27.0% from 23.3%. Yet operating cash flow for the quarter was only USD 320.0 million, with capital expenditure of USD 99.0 million. In our view the share looks neutral: the EV/EBITDA multiple of 8.87 is below its own three-year average of 9.08, but the portal's model points to minus 36% upside to fair value.
Key takeaways
— Revenue rose 38.4% year on year but fell 2.6% quarter on quarter
— EBITDA margin climbed to 48.7% from 43.2% a year earlier
— Net profit rose 60.7% to USD 304.0 million
— Operating cash flow of USD 320.0 million was half of EBITDA
— Net debt is negative: a cash cushion of USD 368.0 million
— Dividend yield of 1.03% with a payout covered by profit
— EV/EBITDA of 8.87 is below its own three-year average of 9.08
Attractiveness
Key figures, USD bn
| Metric | Q2 2025 | Q2 2026 | Change |
|---|---|---|---|
| Revenue | 0.81 | 1.12 | +38.4% |
| EBITDA | 0.35 | 0.55 | +56.0% |
| Operating profit | 0.23 | 0.43 | +87.1% |
| Net profit | 0.19 | 0.30 | +60.7% |
| Operating cash flow | 0.29 | 0.32 | +9.1% |
| Capex | 0.06 | 0.10 | +64.2% |
| EBITDA margin | 43.2% | 48.7% | +5.5 pp |
| Net margin | 23.3% | 27.0% | +3.7 pp |
Revenue rose 38.4% year on year but fell 2.6% quarter on quarter
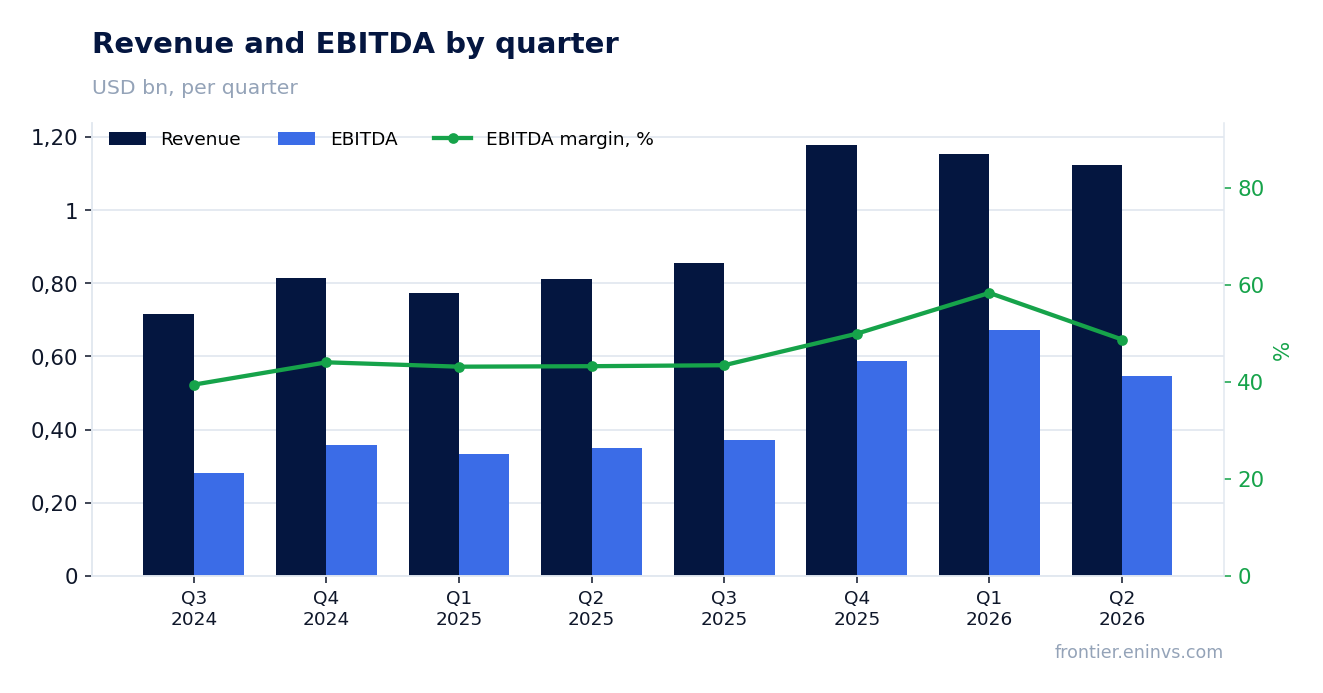
In the second quarter of 2026 Pan American Silver's revenue reached USD 1,124.0 million, up 38.4% year on year. This extends a strong run: growth was 49.3% in the first quarter and 44.7% in the fourth quarter of 2025. However, compared with the first quarter of 2026 revenue declined 2.6% from USD 1,154.0 million.
The year-on-year increase was driven by high gold and silver prices. The company does not disclose production volumes in the provided data, so splitting the increase into price and volume is impossible. But the sequential decline suggests that the price tailwind may have stopped improving while volumes could have fallen.
EBITDA margin climbed to 48.7% from 43.2% a year earlier
EBITDA in the second quarter of 2026 was USD 547.0 million, up 56.0% year on year. That is faster than revenue growth, so the EBITDA margin rose to 48.7% from 43.2% a year earlier. Margin expansion means costs grew slower than revenue – likely operating leverage at high metal prices.
Operating profit rose to USD 427.0 million from USD 228.2 million a year earlier. This is also faster than revenue, confirming better profitability at the operating level. However, EBITDA declined quarter on quarter from USD 673.0 million in the first quarter of 2026, in line with the seasonal revenue drop.
Net profit rose 60.7% to USD 304.0 million
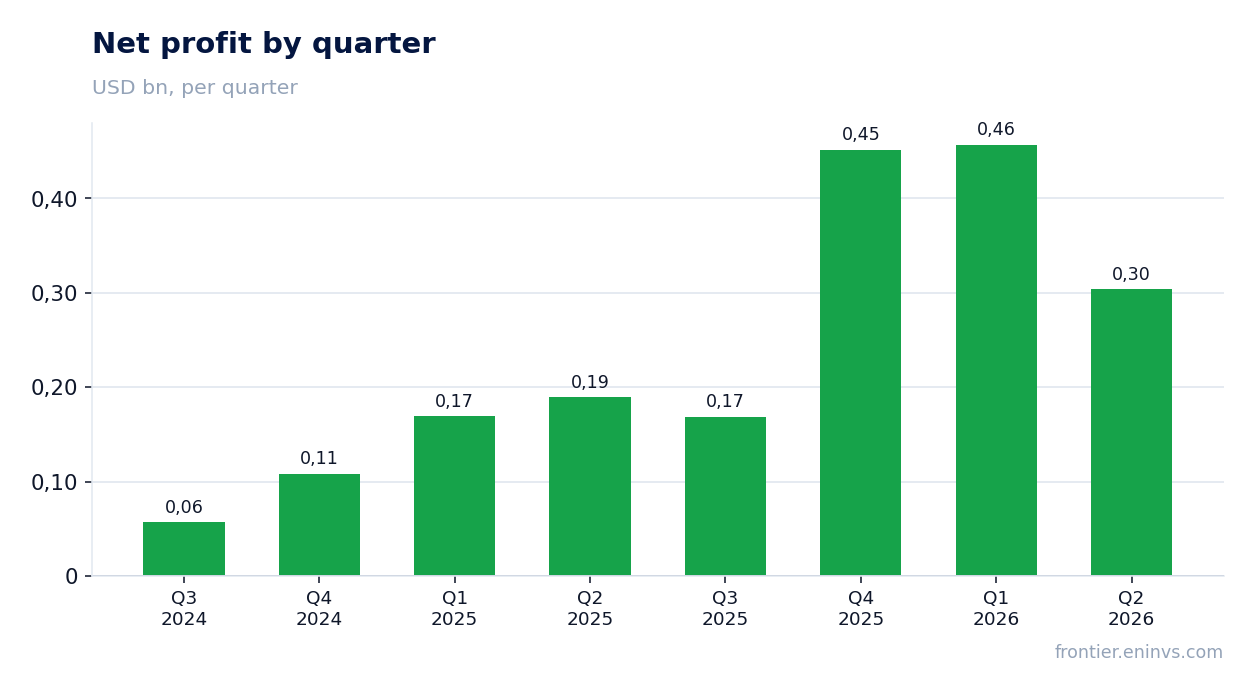
Net profit in the second quarter of 2026 was USD 304.0 million, up 60.7% year on year. The net margin rose to 27.0% from 23.3%. Profit growth outpaced EBITDA growth, which may point to a lower effective tax rate or one-off items below the operating line.
The provided data does not break profit into one-off and recurring items. However, net profit growth of 60.7% versus EBITDA growth of 56.0% means the net margin expanded more than the operating margin. This could be due to tax effects or foreign-exchange gains, but the exact reason is not disclosed.
Operating cash flow of USD 320.0 million was half of EBITDA
Operating cash flow in the second quarter of 2026 was USD 320.0 million, well below EBITDA of USD 547.0 million. The gap of USD 227.0 million could be explained by working capital growth, tax payments or other non-cash items. This is a key point: profit is there, but it converts into less cash.
Capital expenditure for the quarter was USD 99.0 million, roughly in line with previous quarters. Free cash flow therefore was about USD 221.0 million. That is still a solid amount, but less than the company could generate at such high EBITDA.
Net debt is negative: a cash cushion of USD 368.0 million
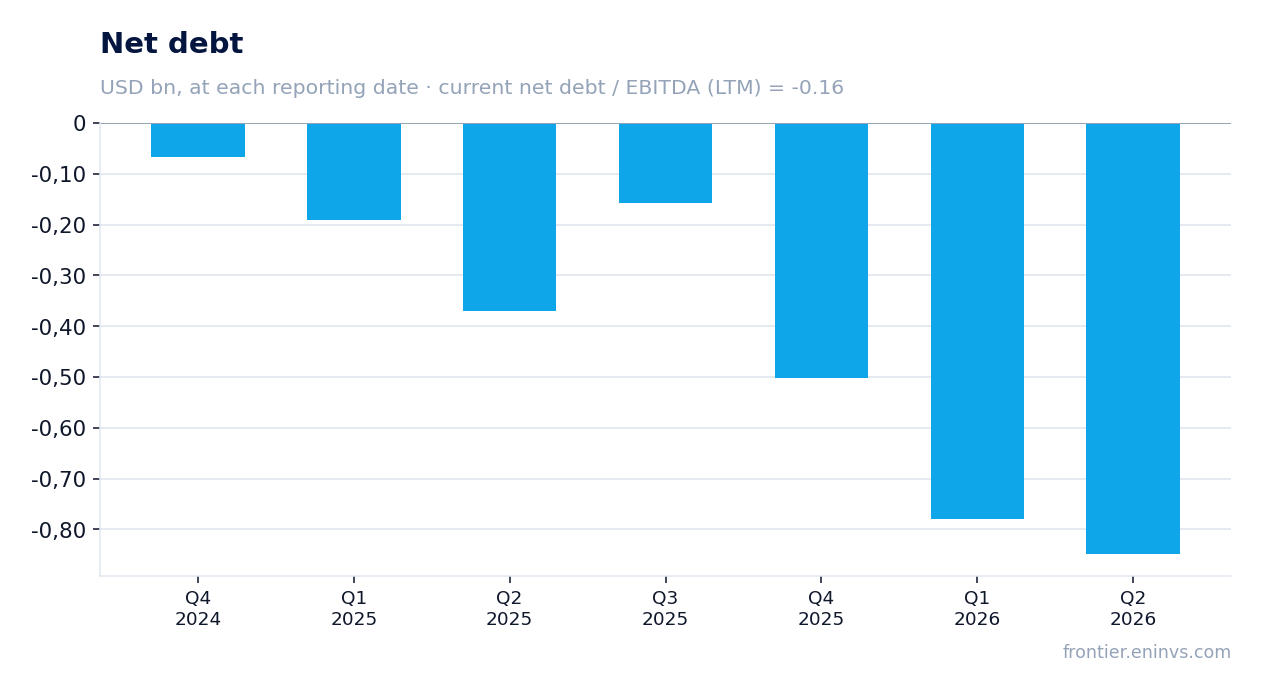
As of the latest reporting date Pan American Silver's net debt is negative at minus USD 368.0 million, meaning cash exceeds debt. This gives the company financial stability and the ability to fund development without external borrowing.
The net debt to EBITDA ratio for the trailing twelve months is minus 0.16. The negative value confirms the company has no debt burden. Over the past 12 months net debt decreased by RUB 0.5 billion, but since the reporting currency is USD, this figure is in rubles and may reflect exchange-rate differences.
Dividend yield of 1.03% with a payout covered by profit
Pan American Silver's dividend yield over the trailing twelve months is 1.03%. That is a modest figure, especially against high profit. The company likely pays out a small share of earnings, preferring to invest in development or accumulate cash.
Our estimate for the current year's dividend is based on the payout ratio derived from available data. With net profit of USD 1,381.1 million over the trailing twelve months and a market capitalisation of USD 20,180.2 million, a 1.03% yield corresponds to an annual dividend of about USD 208.0 million. That is roughly 15% of profit. If the company maintains this ratio, the dividend will remain stable but will not grow quickly. The risk of a cut is linked to falling metal prices or rising capital expenditure.
EV/EBITDA of 8.87 is below its own three-year average of 9.08
The EV/EBITDA multiple for the trailing twelve months is 8.87, slightly below its own three-year average of 9.08. This means the share is valued a bit cheaper than usual over the past three years. The difference is small – about 2%.
The P/E multiple for the trailing twelve months is 14.61. At the same time, the portal's model, which reprices EBITDA at current commodity prices and the target EV/EBITDA, points to minus 36% upside to fair value. This is a significant gap, suggesting the market may be too optimistic about the sustainability of current metal prices.
Valuation on the latest reported figures
| Metric | Value |
|---|---|
| Market cap | 20.2 bn USD |
| P/E (LTM) | 14.6 |
| EV/EBITDA (LTM) | 8.9 |
| P/B | 2.88 |
| Net debt / EBITDA (LTM) | -0.16 |
| Operating cash flow (LTM) | 1.30 bn |
| ROE | 16.5% |
| Dividend yield (12m) | 1.0% |
| EV/EBITDA, 3-year average | 9.1 |
Bottom line
Bottom line: Pan American Silver delivered strong revenue and profit growth in the second quarter of 2026, but cash flow lagged EBITDA. The EBITDA margin rose to 48.7%, net profit – by 60.7% to USD 304.0 million. The company has no debt burden, and the dividend yield is 1.03%. The EV/EBITDA multiple of 8.87 is below its own three-year average of 9.08, but the portal's model points to minus 36% upside to fair value. The question for a holder now is how sustainable current metal prices are and why profit is not fully converting into cash.
Open the company's financial profile PAAS →
See also: market overview · valuation map · stock screeners