Par Pacific: profit up eightfold, but half the quarter came from a Hawaii price lag
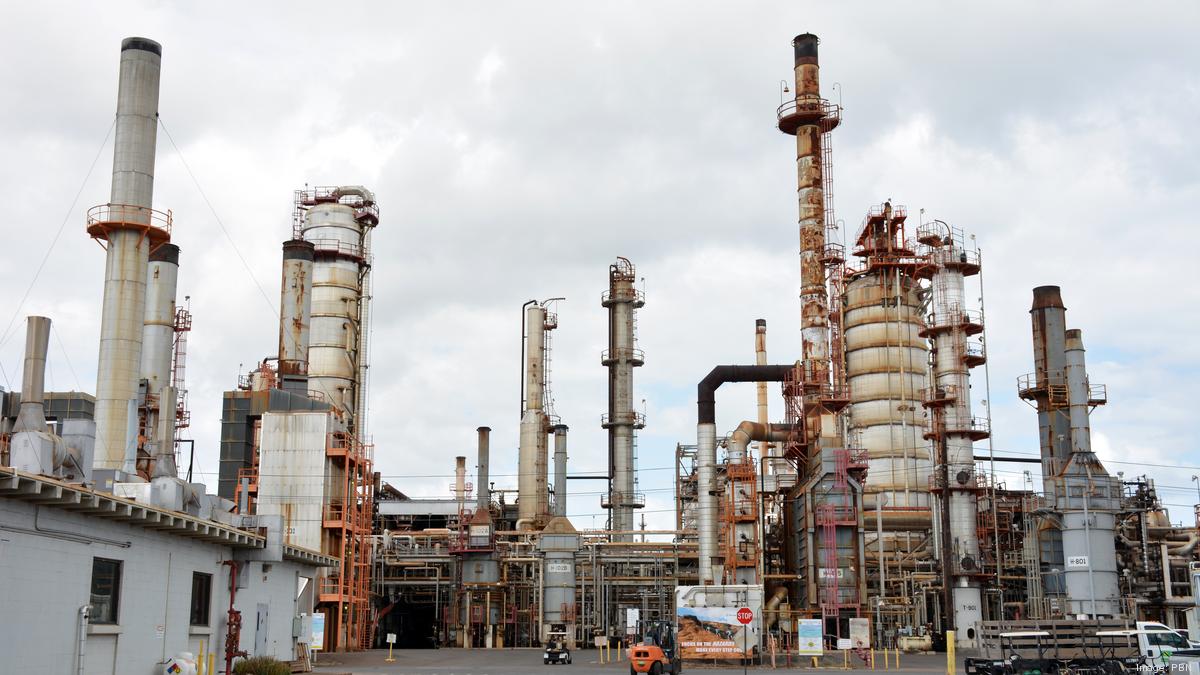
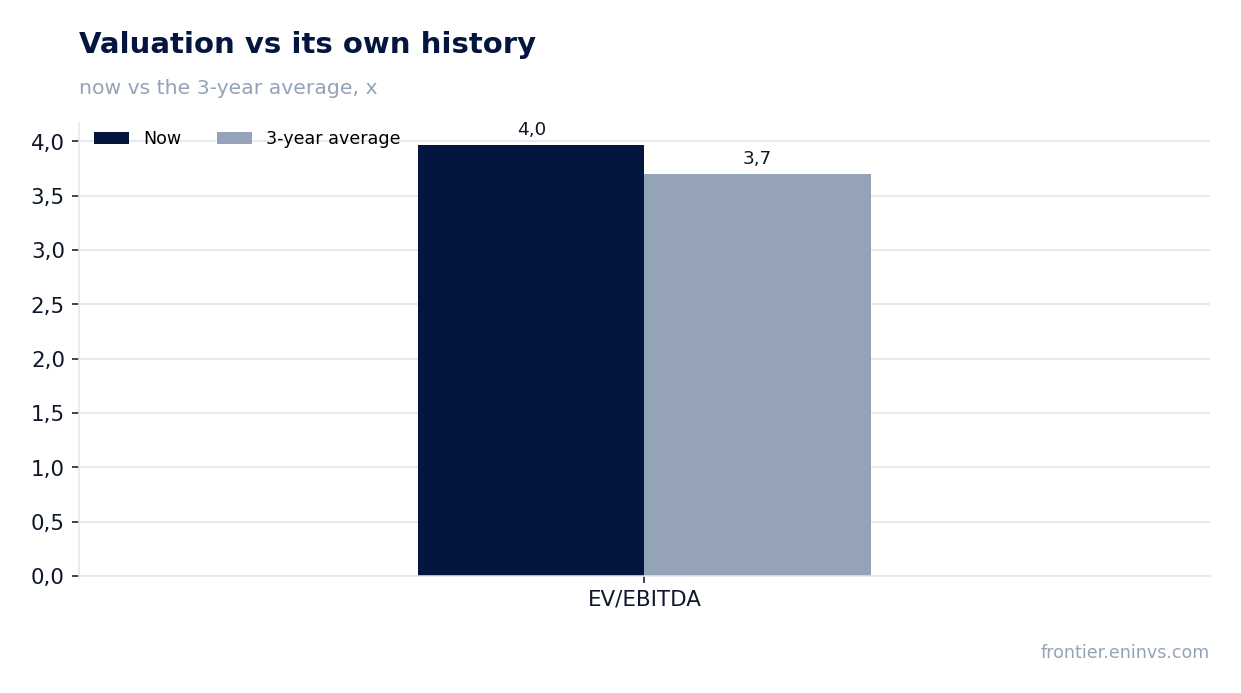
On 5 August Par Pacific reported second-quarter 2026 results. Revenue rose 56.8% year on year to $2,968.9 million, EBITDA by 334.5% to $671.1 million, and net profit by 677.2% to $462.1 million. The EBITDA margin reached 19.2% against 6.9% a year earlier, and leverage over the trailing twelve months stands at 0.8 EBITDA. The share trades at about 4.9 times earnings and 4.0 times EBITDA – against its own three-year average of 3.7 on EBITDA – and at that valuation looks attractive, though the durability of earnings depends on whether the Hawaii price lag repeats.
Key takeaways
— Revenue rose 56.8% year on year, and almost all of the gain came from one Hawaii plant
— The EBITDA margin reached 19.2% on a price lag, not on processing volumes
— Of the $462.1 million profit, $76.5 million came from the Hawaii price lag
— Debt fell to $949.0 million, and leverage stands at 0.8 EBITDA
— Operating cash flow of $282.6 million was dented by a $312.2 million working-capital outflow
— The share trades at 4.0 times EBITDA against its own three-year average of 3.7
— On the portal's model the upside to fair value is +121%
Attractiveness
Key figures, USD bn
| Metric | Q2 2025 | Q2 2026 | Change |
|---|---|---|---|
| Revenue | 1.89 | 2.97 | +56.8% |
| EBITDA | 0.13 | 0.57 | +334.5% |
| Operating profit | 0.10 | 0.63 | +555.8% |
| Net profit | 0.06 | 0.46 | +677.2% |
| Operating cash flow | 0.13 | 0.28 | +111.6% |
| Capex | 0.05 | 0.04 | -17.5% |
| EBITDA margin | 6.9% | 19.2% | +12.3 pp |
| Net margin | 3.1% | 15.6% | +12.5 pp |
Revenue rose 56.8% year on year, and almost all of the gain came from one Hawaii plant
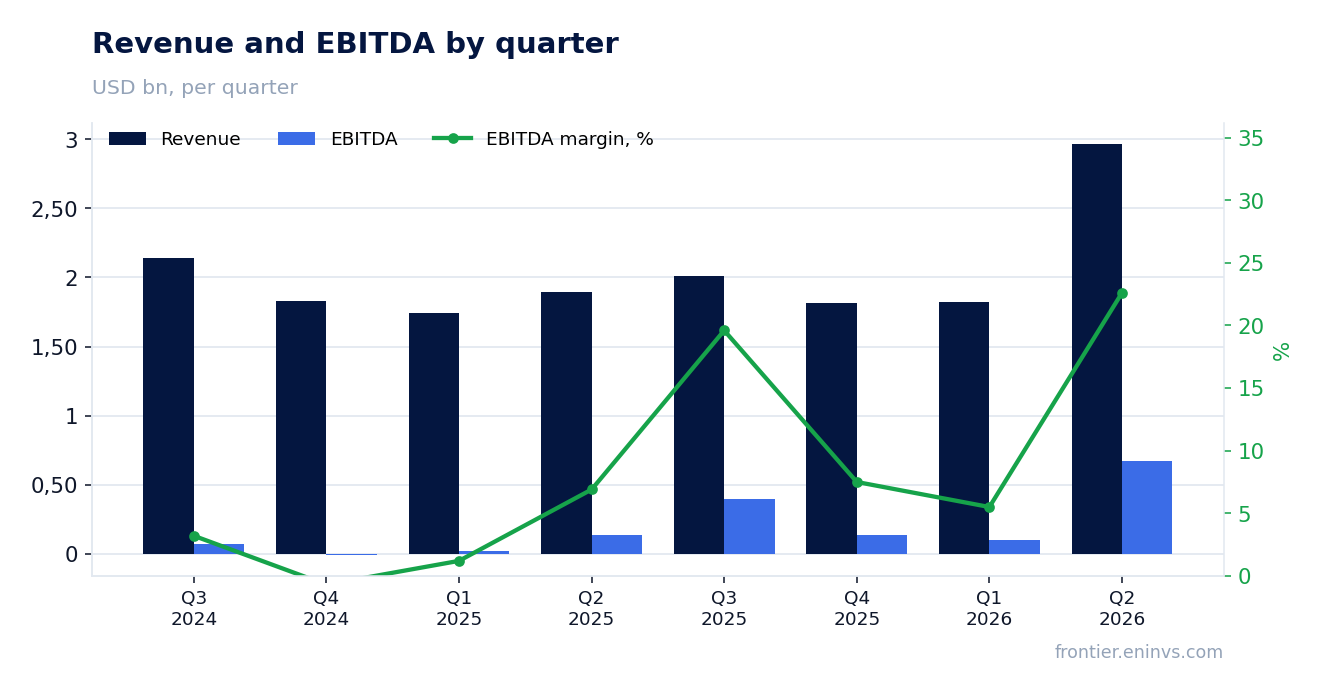
Second-quarter 2026 revenue was $2,968.9 million against $1,893.4 million a year earlier – growth of 56.8%. This is a sharp reversal after four quarters of decline: in the first quarter of 2026 revenue added 4.5%, and before that it fell by 1.0–11.9% year on year. The main contribution came from the Hawaii plant: the Hawaii index rose to $46.06 per barrel from $8.57 a year earlier, while Montana, Washington and Wyoming rose far more modestly – to $25.76, $20.27 and $28.73 respectively.
Processing volumes barely grew: total throughput was 181.4 thousand barrels per day against 186.6 thousand a year earlier. The Hawaii plant processed 73.2 thousand barrels per day against 88.1 thousand – the aftermath of scheduled maintenance weighed. In other words, revenue was pulled up by prices and margin, not by capacity utilisation.
Revenue growth with lower utilisation means the company sold its product dearer, not in greater volume. For the durability of the result this distinction matters: the Hawaii price lag, which the company describes directly, may reverse next quarter.
The EBITDA margin reached 19.2% on a price lag, not on processing volumes
The EBITDA margin in the second quarter of 2026 was 19.2% against 6.9% a year earlier, and the net margin 15.6% against 3.1%. EBITDA rose to $671.1 million from $131.5 million, and operating profit to $634.6 million from $96.8 million. Such a jump in margin with almost unchanged utilisation is explained not by lower costs but by the structure of sales.
The company states directly: the Hawaii refinery's adjusted gross margin was $57.00 per barrel, including a net price lag of $76.5 million, or $11.49 per barrel. That lag arose because part of Hawaii sales is priced off the previous month's and week's prices, and refined product prices in June fell relative to March. The company notes that falling prices produce a positive lag and rising prices a negative one.
The reverse side is visible in the first quarter of 2026: then rising prices produced a negative lag, and profit was only $54.5 million. The mechanism works both ways, and the current result is partly a reflection of past price moves rather than of current conditions.
Of the $462.1 million profit, $76.5 million came from the Hawaii price lag
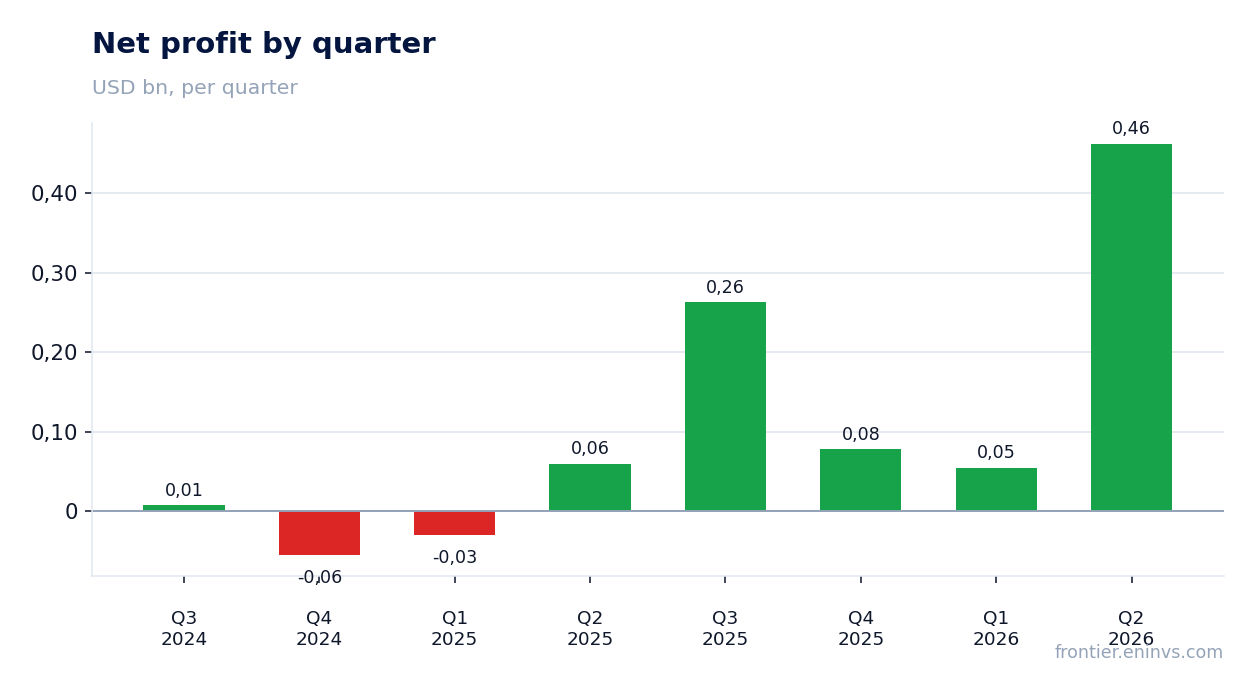
Second-quarter 2026 net profit was $462.1 million, or $9.35 per diluted share, against $59.5 million, or $1.17, a year earlier. Adjusted net profit was $499.2 million, or $10.10 per share, against $78.3 million a year earlier. The gap between reported and adjusted profit comes from one-off items: a $35.7 million inventory valuation adjustment, a $41.2 million mark-to-market on environmental obligations, and a $28.9 million unrealised gain on derivatives.
The company separately discloses that the Hawaii margin contains a price lag of $76.5 million – about 17% of quarterly profit. That lag is not cash in the sense that it reflects the difference between selling prices and current market prices, not an additional physical sales volume.
The report also states that during the quarter the company completed a $500 million senior unsecured notes offering and reduced term debt by more than $130 million. Debt extinguishment and commitment costs were $11.5 million – another one-off item that reduced profit.
Debt fell to $949.0 million, and leverage stands at 0.8 EBITDA
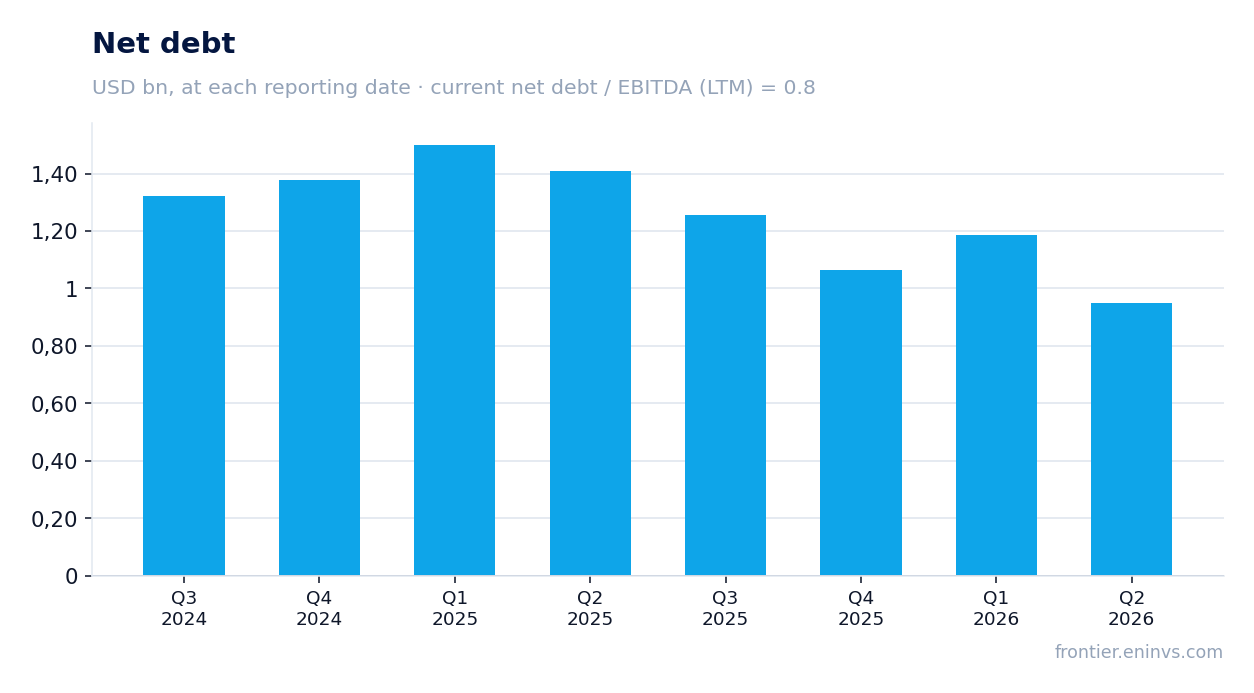
Net debt at the end of the second quarter of 2026 was $949.0 million against $1,184.5 million at the end of the first quarter – a reduction of $235.5 million over three months. The company attributes this to the $500 million notes offering and a reduction of term debt by more than $130 million. The ratio of net debt to trailing-twelve-month EBITDA is 0.8, a low level for a refiner with volatile margins.
Total debt, including the current portion, at 30 June 2026 was $739.2 million, of which $505.7 million was term debt and $243.0 million was drawn under the revolving credit facility. Cash was $185.0 million, and total liquidity $1.4 billion. Interest expense for the quarter fell to $14.3 million from $22.1 million a year earlier.
Lower debt with higher EBITDA produced low leverage, but the durability of that level depends on whether EBITDA stays at its current level. If margins return to those of earlier quarters, leverage will rise mechanically, even without new debt.
Operating cash flow of $282.6 million was dented by a $312.2 million working-capital outflow
Operating cash flow in the second quarter of 2026 was $282.6 million against $133.6 million a year earlier. Within that figure, however, the company discloses a working-capital outflow of $312.2 million and deferred turnaround expenditure of $19.5 million. Excluding these items, operating cash flow would have been $614.3 million.
The company expects a substantial portion of the working-capital outflow to reverse as commodity prices normalise and Hawaii inventory returns to more typical levels after the turnaround. This means part of the quarterly cash flow was deferred rather than lost.
Capital expenditure was $39.7 million against $45.9 million a year earlier – a reduction of $6.2 million. With operating cash flow of $282.6 million and capex of $39.7 million, free cash flow remains positive, but its quality this quarter is lower because of working capital.
The share trades at 4.0 times EBITDA against its own three-year average of 3.7
On the trailing twelve months Par Pacific trades at an EV/EBITDA of 3.97 and a P/E of 4.92. Its own three-year average EV/EBITDA is 3.70 – so the current multiple is slightly above its own history. Return on equity over twelve months is 105.7%, reflecting both high profit and a low equity base.
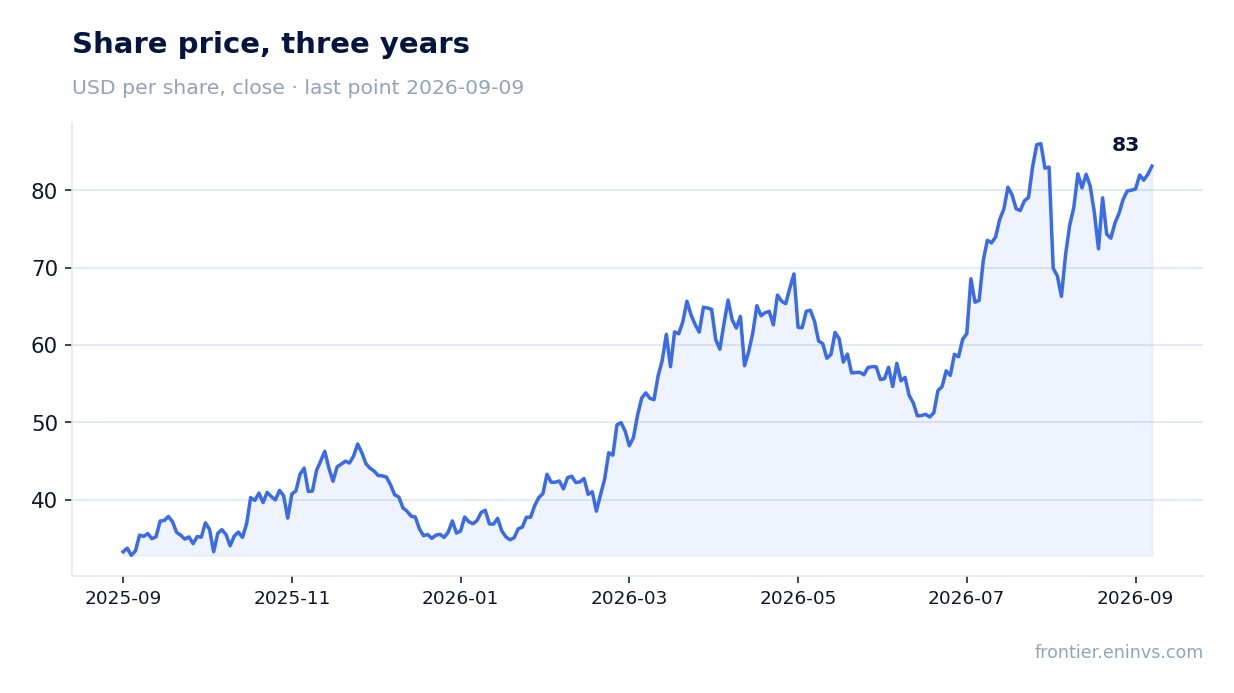
Market capitalisation is $4,218.3 million. The share closed at 83.0 before the release, lost 15.8% on the release day, and has added 0.2% from the release to 9 September. The market first marked the stock sharply down, then stabilised.
On the portal's model, which re-prices EBITDA to current commodity prices at the target EV/EBITDA, the upside to fair value is +121%. This is our own estimate, not a market consensus and not a target price.
On the portal's model the upside to fair value is +121%
Our model re-prices EBITDA to current commodity prices and applies a target EV/EBITDA, then compares the result with market capitalisation. At current prices this gives an upside to fair value of +121%. This is not a market forecast or a recommendation, but our own estimate under stated assumptions.
The model's key assumption is that EBITDA stays close to its current level. If the Hawaii price lag reverses and the margin returns to the level of the first quarter of 2026, the calculated fair value would be materially lower. That is why the model is sensitive to whether the favourable price environment persists.
A multiple of 4.0 times EBITDA does not look high for a company that has just posted a 19.2% margin. But it rests on earnings in which $76.5 million is a price lag rather than a sustainable cash flow. Excluding the lag, the valuation moves closer to its historical norm.
Valuation on the latest reported figures
| Metric | Value |
|---|---|
| Market cap | 4.22 bn USD |
| P/E (LTM) | 4.9 |
| EV/EBITDA (LTM) | 4.0 |
| P/B | 2.79 |
| Net debt / EBITDA (LTM) | 0.80 |
| Operating cash flow (LTM) | 0.45 bn |
| ROE | 105.7% |
| EV/EBITDA, 3-year average | 3.7 |
Bottom line
The report's strength is not only record profit but also the reduction of debt to $949.0 million with leverage at 0.8 EBITDA – the company used favourable conditions to strengthen its balance sheet. However, a significant part of the quarterly result is the $76.5 million price lag, which worked against the company in the first quarter, along with one-off adjustments of $35.7 million on inventory and $41.2 million on environmental obligations. Operating cash flow of $282.6 million looks modest against profit of $462.1 million because of the $312.2 million working-capital outflow. The question for a holder now is whether the current margin is a new norm or a one-off spike on a price difference. At a multiple of 4.0 times EBITDA against its own three-year average of 3.7 and with +121% upside on the portal's model, the share looks attractive, but that attractiveness rests on the assumption that the favourable price environment persists.
Open the company's financial profile PARR →
See also: market overview · valuation map · stock screeners