PEDEVCO: Q2 2026 profit came from a $13.1m hedge mark-to-market gain, not operations
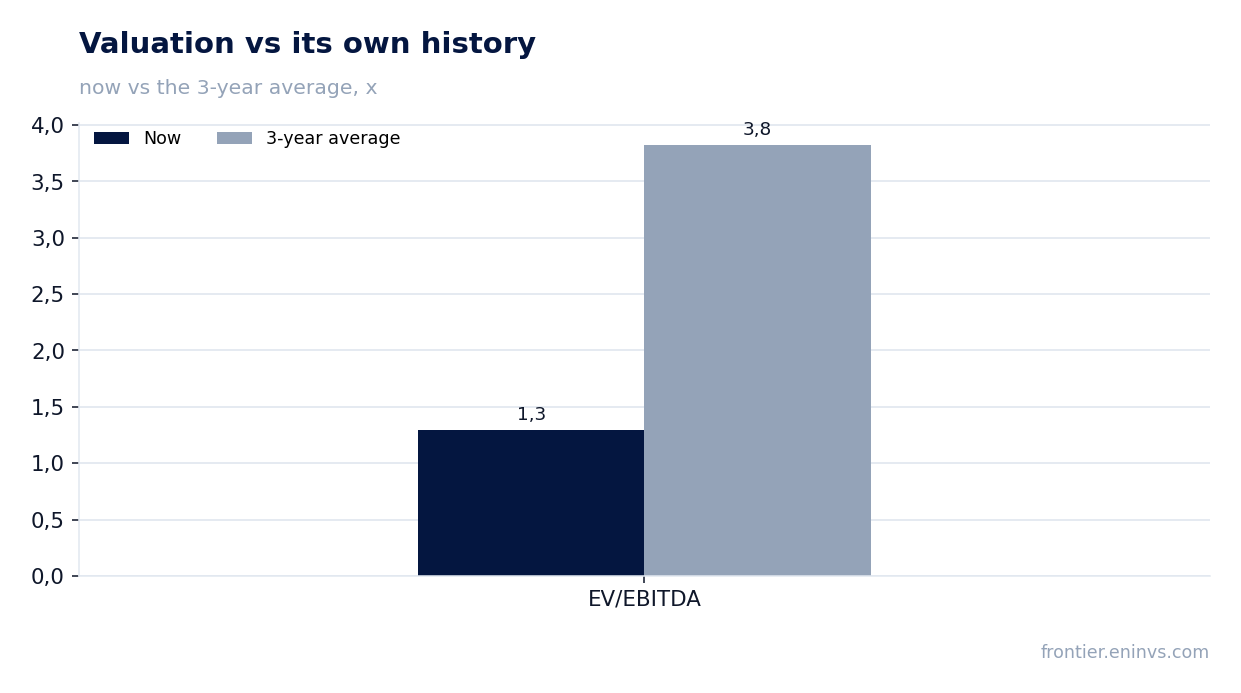
On 13 August PEDEVCO released its Q2 2026 results. Revenue rose 561.4% year on year to $46.1m, adjusted EBITDA was up 516% to $18.7m, and net income reached $17.5m against a $1.7m loss a year earlier. However, $13.1m of that profit came from a non-operating derivative mark-to-market gain, while production fell 16% quarter on quarter. At an LTM EV/EBITDA of 1.3 versus its own three-year average of 3.8, the stock looks attractive, but the durability of the result hinges on how quickly the company restores production growth.
Key takeaways
— Revenue grew 6.6x on acquired assets, not organically
— The 40.5% EBITDA margin rests on a $94.07 realised oil price
— $13.1m of the $17.5m profit came from a hedge mark-to-market gain
— Debt of $85m against LTM EBITDA of $49.8m is moderate, but quarterly interest expense is already $2.0m
— Production fell 16% quarter on quarter, with growth promised only late in 2026
— LTM EV/EBITDA of 1.3 versus its own three-year average of 3.8 – the market values the stock below its history
Attractiveness
Key figures, USD bn
| Metric | Q2 2025 | Q2 2026 | Change |
|---|---|---|---|
| Revenue | 0.01 | 0.05 | +561.4% |
| EBITDA | 0.00 | 0.02 | +1057.4% |
| Operating profit | -0.00 | 0.02 | to profit |
| Net profit | -0.00 | 0.02 | to profit |
| Operating cash flow | -0.00 | 0.02 | to profit |
| Capex | 0.00 | 0.00 | +54.0% |
| EBITDA margin | 23.1% | 40.5% | +17.4 pp |
| Net margin | -24.0% | 37.9% | +61.9 pp |
Revenue grew 6.6x on acquired assets, not organically
Q2 2026 revenue reached $46.1m, up 561.4% from $7.0m a year earlier. The increase is primarily due to the merger with Juniper Capital assets, closed on 31 October 2025: these assets delivered their first full quarterly contribution. Of the $39.1m total increase, $35.8m came from higher sales volumes and only $3.3m from pricing.
Production rose 348% year on year to 618,912 barrels of oil equivalent, or 6,801 Boe/d. Sequentially, however, production fell 16% from Q1 2026: the first quarter benefited from D-J Basin wells brought online in late 2025. The annual growth therefore reflects a change in perimeter, not organic expansion.
The average realised oil price rose 53% to $94.07 per barrel, natural gas fell 22% to $2.10 per Mcf, and NGLs rose 22% to $31.98 per barrel. Oil volumes of 450,607 barrels at that price generate the bulk of revenue. Without the acquired assets, the company would have reported a far smaller result.
The 40.5% EBITDA margin rests on a $94.07 realised oil price
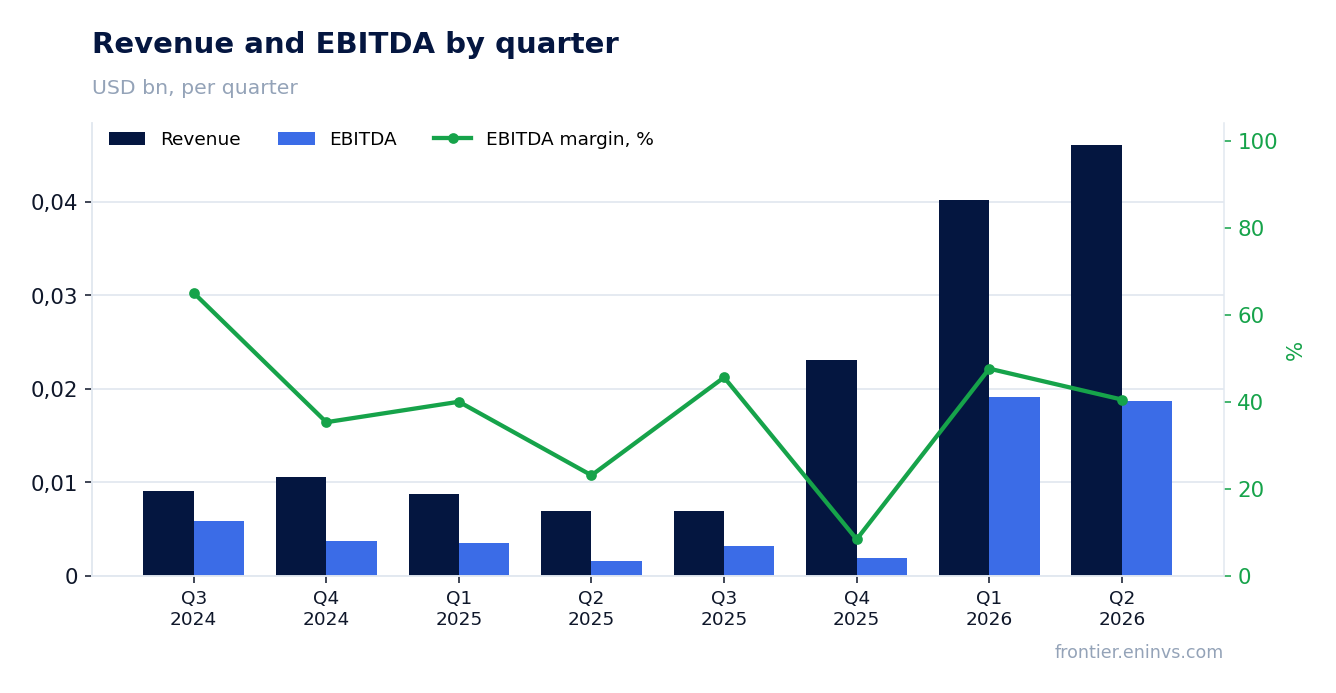
Adjusted EBITDA in Q2 2026 was $18.7m against $3.0m a year earlier, with an EBITDA margin of 40.5% versus 23.1%. The margin expansion is driven not by lower unit costs but by the high realised price: at $94.07 per barrel, even elevated operating costs leave substantial gross profit.
Operating expenses rose sharply: lease operating costs to $16.4m from $2.8m, G&A to $3.4m from $1.7m, and DD&A to $10.2m from $3.9m. All these lines reflect the inclusion of acquired assets. The company mentions a cost-optimisation programme, but its effect is not yet visible in the reported figures.
The net margin was 37.9% versus negative 24.0% a year earlier. That figure, however, includes a non-operating gain discussed below. The operating margin, based on operating income of $15.4m, is about 33.3% – also high, but noticeably below the net margin due to the derivative effect.
$13.1m of the $17.5m profit came from a hedge mark-to-market gain
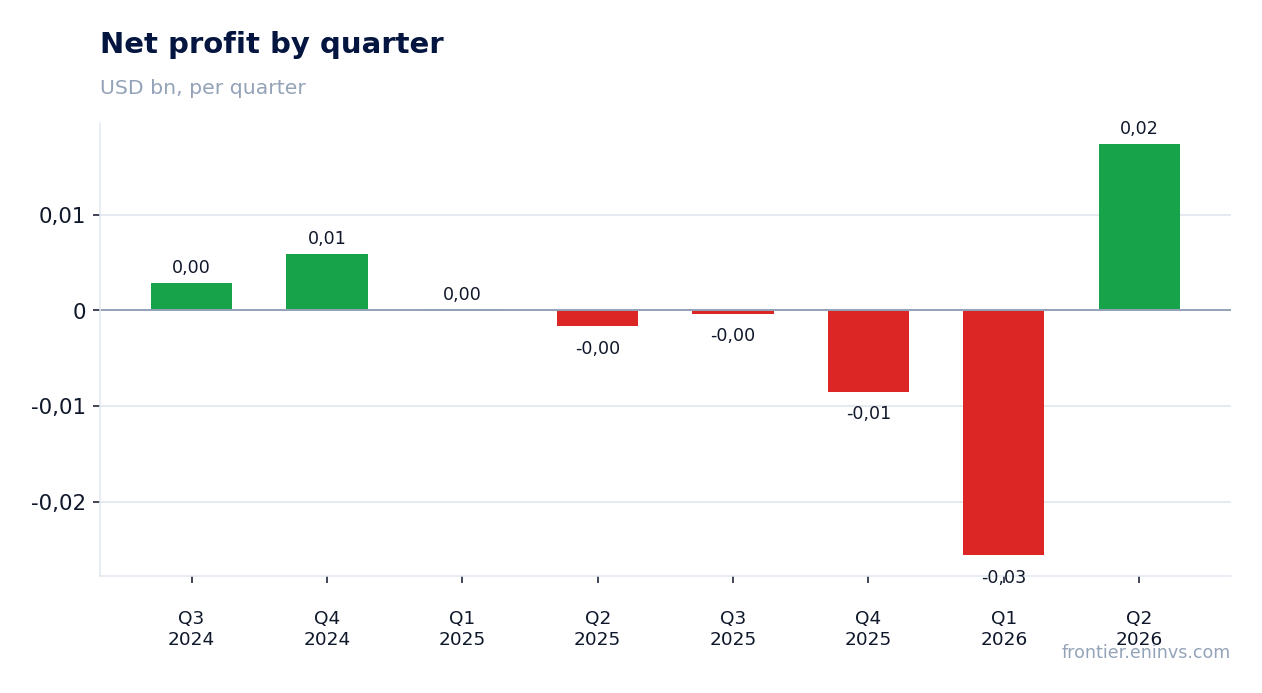
Q2 2026 net income was $17.5m, or $1.31 per share, against a $1.7m loss a year earlier. Within that, $5.0m is net income on derivative contracts, which in turn comprises $8.1m of realised settlement losses and a $13.1m unrealised mark-to-market gain. It was the unrealised revaluation, not cash flow, that provided the bulk of the profit.
The unrealised gain arose from the decline in commodity prices between 31 March and 30 June 2026 for unsettled periods. This is an accounting effect: it brings no cash and could reverse in coming quarters if prices move the other way. The $8.1m realised loss is a real cash outflow already reflected in operating cash flow.
Operating income, excluding derivatives, was $15.4m – up $17.6m from negative $2.2m a year earlier. The operating business has indeed become profitable, but not to the extent the net income figure suggests. For assessing durability, operating income matters more than the bottom line.
Debt of $85m against LTM EBITDA of $49.8m is moderate, but quarterly interest expense is already $2.0m
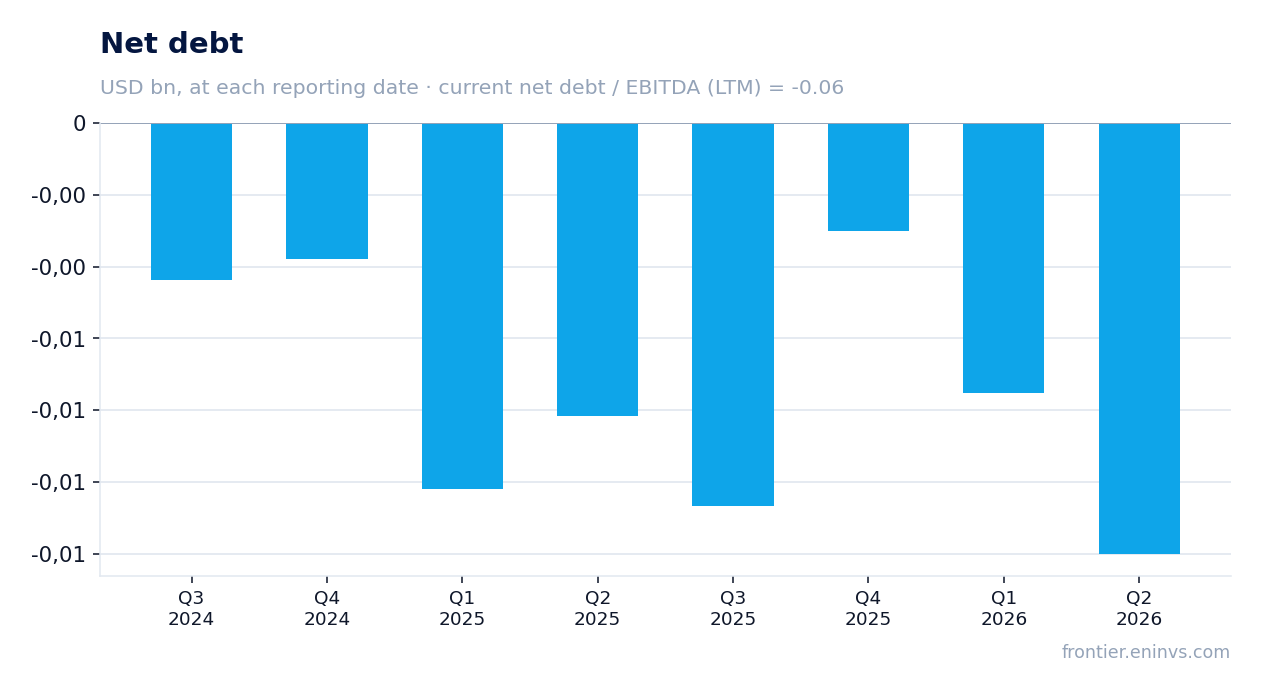
As of 30 June 2026, borrowings under the revolving credit facility were $85.0m, down from $98.0m at 31 March. Cash and restricted cash stood at $12.1m, with net debt of about $73m. The net debt to LTM EBITDA ratio, per the facts, is -0.06, meaning the company has negative net debt on that metric, which reflects a definition different from management's calculation.
Quarterly interest expense was $2.0m, of which $1.8m was interest on the credit facility and $0.2m amortisation of deferred financing costs. A year earlier there was no debt. With annual interest expense of about $8m and LTM EBITDA of $49.8m, coverage remains comfortable, but debt has appeared for the first time and now affects cash flow.
Operating cash flow for the quarter was $15.3m, covering interest expense. However, capital expenditure of $3.5m was low due to a drilling pause; the company plans to drill or participate in over 20 wells in H2, which will increase both capex and debt. Free cash flow under such conditions could be negative.
Production fell 16% quarter on quarter, with growth promised only late in 2026
Average daily production in Q2 2026 was 6,801 Boe/d, 16% below Q1. The company attributes this to an expected decline after D-J Basin wells were brought online in late 2025. In July production was even lower due to temporary shut-ins of nearby wells during completion of the Hastings well, which was expected to begin producing in early August.
A drilling programme of over 20 wells is planned for H2, which management expects to add material production in late 2026 and into 2027. This means the current quarterly production level is not a base for sustainable growth but a local minimum. Investors will need confirmation of the programme in coming reports.
The company holds a substantial acreage position: about 88,605 net acres in the D-J Basin, 202,100 in the Powder River Basin, and 14,505 in the Permian Basin. Permitting issues in Wyoming have been resolved, improving development prospects. However, executing the programme requires capital, which may increase debt.
LTM EV/EBITDA of 1.3 versus its own three-year average of 3.8 – the market values the stock below its history
The LTM EV/EBITDA multiple is 1.3, while its own three-year average is 3.8. The stock trades well below its historical valuation. This may reflect both lingering integration risks after the merger and market expectations that the current EBITDA level is unsustainable due to one-off effects.
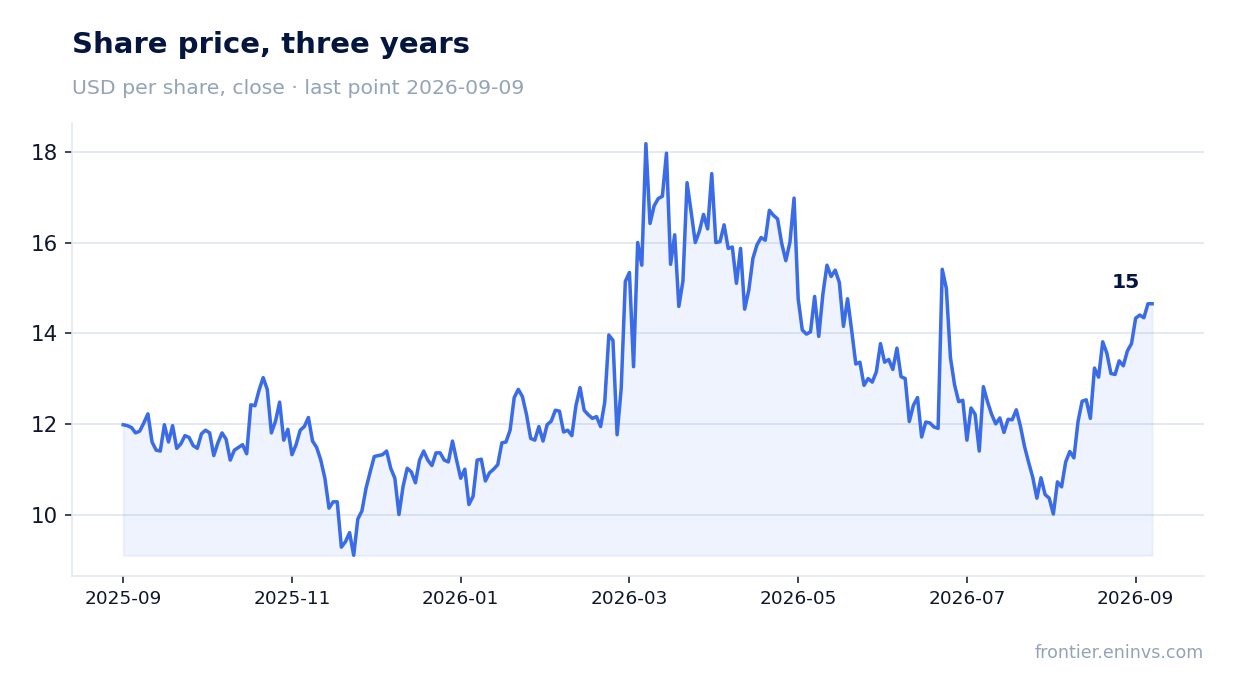
Market capitalisation at the time of the report was $67.6m. With LTM EBITDA of $49.8m and net debt close to zero on one metric, EV/EBITDA indeed looks low. However, if EBITDA is adjusted for unrealised derivative effects, it may be lower, and the multiple would rise. Importantly, the LTM includes quarters with losses before the merger.
Return on equity (ROE) is 36.5% – a high figure, but it is based on profit that includes the unrealised hedge revaluation. Without it, ROE would be noticeably lower. For a sustainable assessment of the business, operating profitability and cash generation matter more than one-off accounting gains.
Valuation on the latest reported figures
| Metric | Value |
|---|---|
| Market cap | 0.07 bn USD |
| EV/EBITDA (LTM) | 1.3 |
| P/B | 0.33 |
| Net debt / EBITDA (LTM) | -0.06 |
| Operating cash flow (LTM) | 0.01 bn |
| ROE | 36.5% |
| EV/EBITDA, 3-year average | 3.8 |
Bottom line
The strong part of the report is operating income of $15.4m and EBITDA of $18.7m, showing that the acquired assets generate profit. However, $13.1m of net income is an unrealised hedge revaluation, and production is declining sequentially. Debt is moderate, but quarterly interest expense is already $2.0m, and capex of $3.5m was low due to a pause. At EV/EBITDA of 1.3 versus a three-year average of 3.8, the market values the stock below its history, but confirmation of durability requires production growth and organic profit without one-offs. The verdict is 'rather attractive' provided the drilling programme delivers the promised volumes.
Open the company's financial profile PED →
See also: market overview · valuation map · stock screeners