Paramount Resources: profit up 16-fold, but the base effect did most of the work
Paramount Resources has reported results for the second quarter of 2026. Revenue reached 238.3 million, EBITDA — 117.7 million, net profit — 49.1 million; year on year revenue added 92.8%, EBITDA — 147.7%, profit — 1517.5%. The EBITDA margin rose to 49.4% from 38.4% a year earlier, and net debt at 30 June 2026 stood at -0.3 billion — the company retains a net cash position. Yet the stock trades above its own three-year average EV/EBITDA, and the portal's model implies -37% to fair value, so despite a strong report the share looks neutral.
Key takeaways
— Revenue grew 92.8% year on year, but the base a year earlier was depressed — the sequential gain is more modest
— EBITDA margin of 49.4% versus 38.4% a year earlier — the margin expansion reflects a low base, not a durable improvement
— Net profit of 49.1 million versus 3.0 million a year earlier — the 16-fold jump came mostly from the low base, not one-offs
— Net debt of -0.3 billion at 30 June 2026 — the company retains a net cash position, but debt rose by 0.2 billion over the quarter
— Operating cash flow of 103.9 million for the quarter — with no capex data, free cash flow cannot be assessed
— Dividend yield of 2.02% over the last 12 months — modest versus the key rate, but the payout is sustainable at current profit
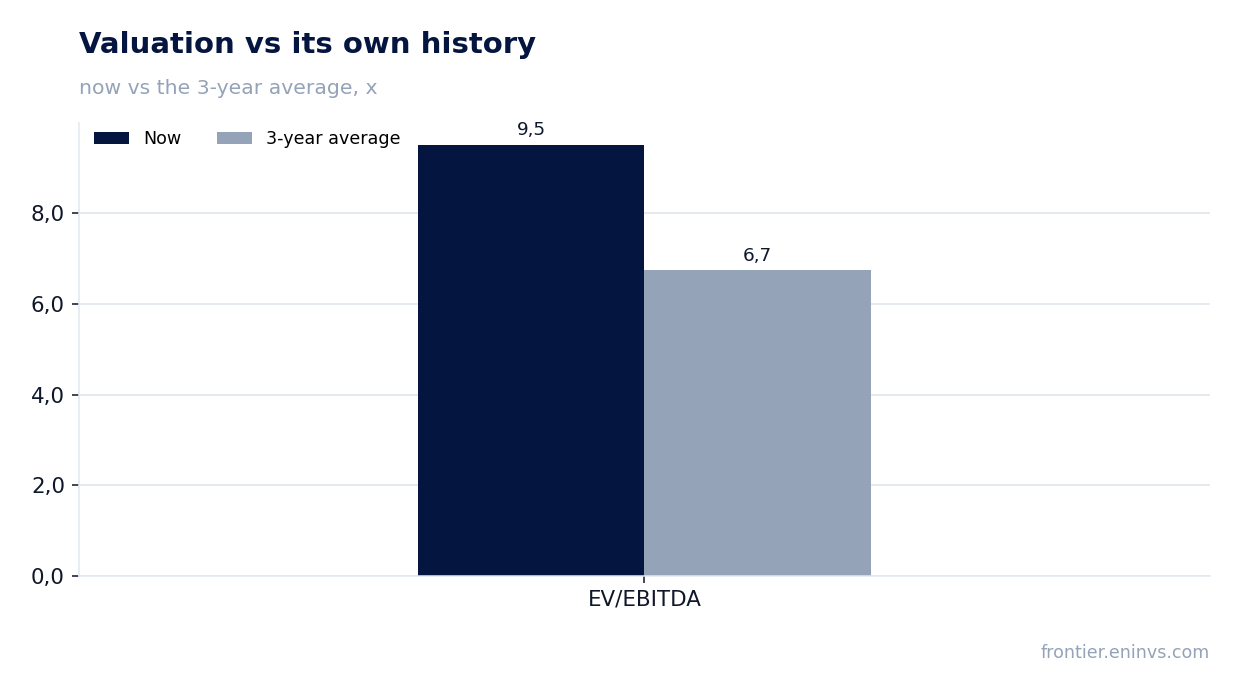
— EV/EBITDA of 9.5 versus a three-year average of 6.7 — the stock trades above its own history, and the portal's model implies -37% to fair value
Attractiveness
Key figures, USD bn
| Metric | Q2 2025 | Q2 2026 | Change |
|---|---|---|---|
| Revenue | 0.12 | 0.24 | +92.8% |
| EBITDA | 0.05 | 0.12 | +147.7% |
| Operating profit | -0.01 | 0.06 | to profit |
| Net profit | 0.00 | 0.05 | +1517.5% |
| Operating cash flow | 0.03 | 0.10 | +260.9% |
| EBITDA margin | 38.4% | 49.4% | +11.0 pp |
| Net margin | 2.5% | 20.6% | +18.1 pp |
Revenue grew 92.8% year on year, but the base a year earlier was depressed — the sequential gain is more modest
Revenue in the second quarter of 2026 was 238.3 million, up 92.8% from the second quarter of 2025. A year earlier, however, revenue was only 123.6 million — a depressed quarter, and it was this low base that produced such a high percentage gain. In the first quarter of 2026 revenue was 213.0 million, so quarter on quarter it added only about 12% — far more modest than the annual figure.
The acceleration in the annual rate from -18.6% in the first quarter of 2026 to +92.8% in the second quarter is explained not so much by a sharp improvement in conditions as by the base effect: in the first quarter of 2025 revenue was 261.5 million, while in the second it was already 123.6 million. The year-on-year decline at the start of 2026 gave way to growth in the second quarter precisely because of the collapse in revenue a year earlier, not because of explosive growth in current sales.
Nevertheless, the sequential recovery in revenue from 213.0 million in the first quarter to 238.3 million in the second is a fact. It shows the company is gaining momentum, but the pace of that gain is far from the annual 92.8%. For an investor, the quarterly dynamics matter more, as they are cleansed of the base effect.
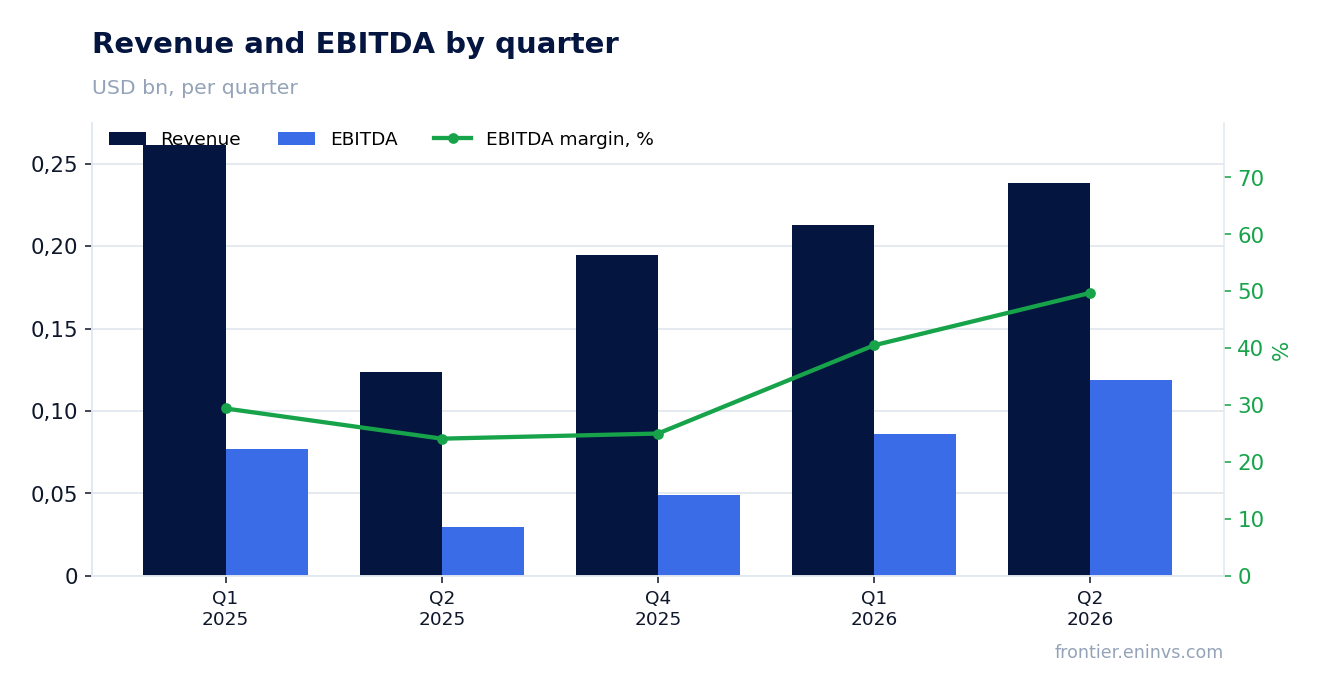
EBITDA margin of 49.4% versus 38.4% a year earlier — the margin expansion reflects a low base, not a durable improvement
EBITDA in the second quarter of 2026 was 117.7 million, up 147.7% year on year. The EBITDA margin rose to 49.4% from 38.4% in the second quarter of 2025. Such margin growth looks impressive, but it was achieved largely thanks to the low base: a year earlier EBITDA was only 29.8 million on revenue of 123.6 million.
In the first quarter of 2026 EBITDA was 86.2 million on revenue of 213.0 million, a margin of about 40.5%. Thus, in the second quarter the margin improved not only year on year but also quarter on quarter — from 40.5% to 49.4%. This suggests the margin expansion is not solely a base effect: the company genuinely improved operating efficiency compared with the start of the year.
Operating profit in the second quarter of 2026 was 62.6 million against a loss of -13.5 million a year earlier. This confirms that the improvement affected not only EBITDA but also profit after depreciation. However, the sustainability of this dynamic depends on whether the favourable conditions that drove revenue and margin growth persist.
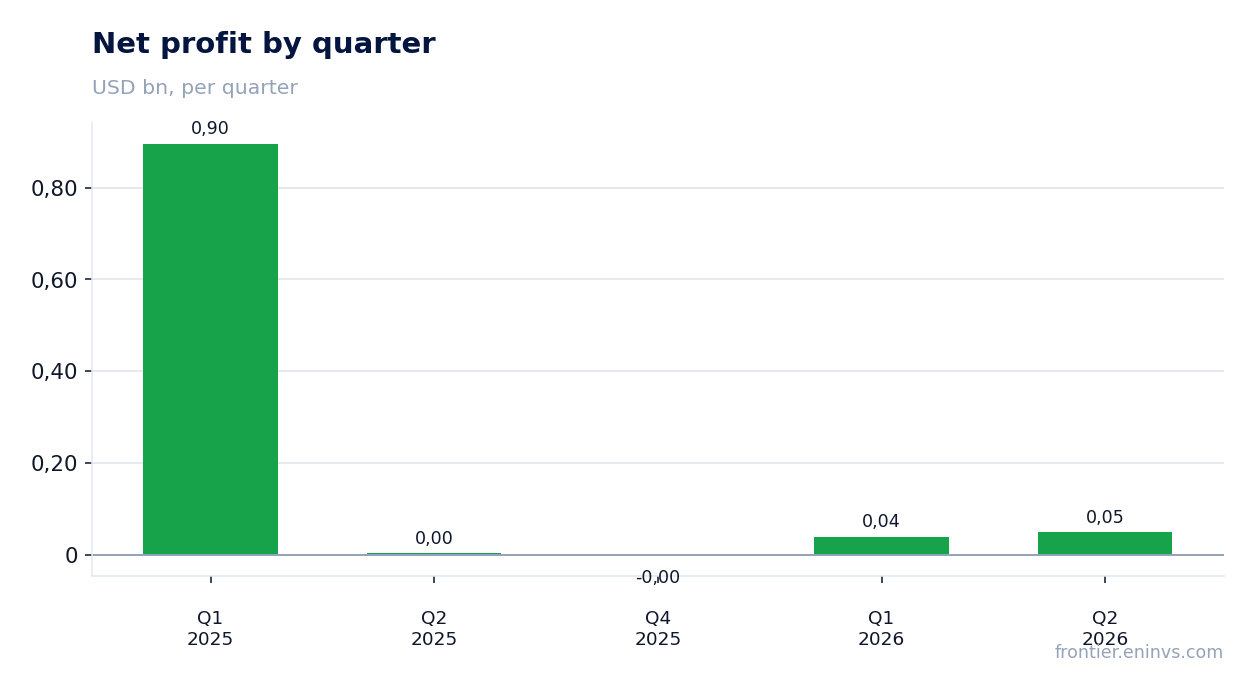
Net profit of 49.1 million versus 3.0 million a year earlier — the 16-fold jump came mostly from the low base, not one-offs
Net profit in the second quarter of 2026 was 49.1 million, 16 times more than 3.0 million a year earlier. Such growth looks extraordinary, but it is explained mainly by the low base: in the second quarter of 2025 profit was almost zero. In the first quarter of 2026 net profit was 38.7 million, so quarter on quarter it grew by about 27% — a more moderate but still noticeable gain.
The net margin rose to 20.6% from 2.5% a year earlier. This improvement is consistent with higher operating profit and the absence of large one-off write-offs that could distort the picture. There are no signs of one-off items in the reporting period that would explain the jump in profit — the growth looks organic against the recovery in revenue and margin.
Nevertheless, such a high annual profit growth rate should not be misleading. For assessing sustainability, the quarterly dynamics matter more: profit is growing, but the pace is many times more modest than the annual 1517.5%. An investor should focus on the sequential improvement, not the low-base effect.
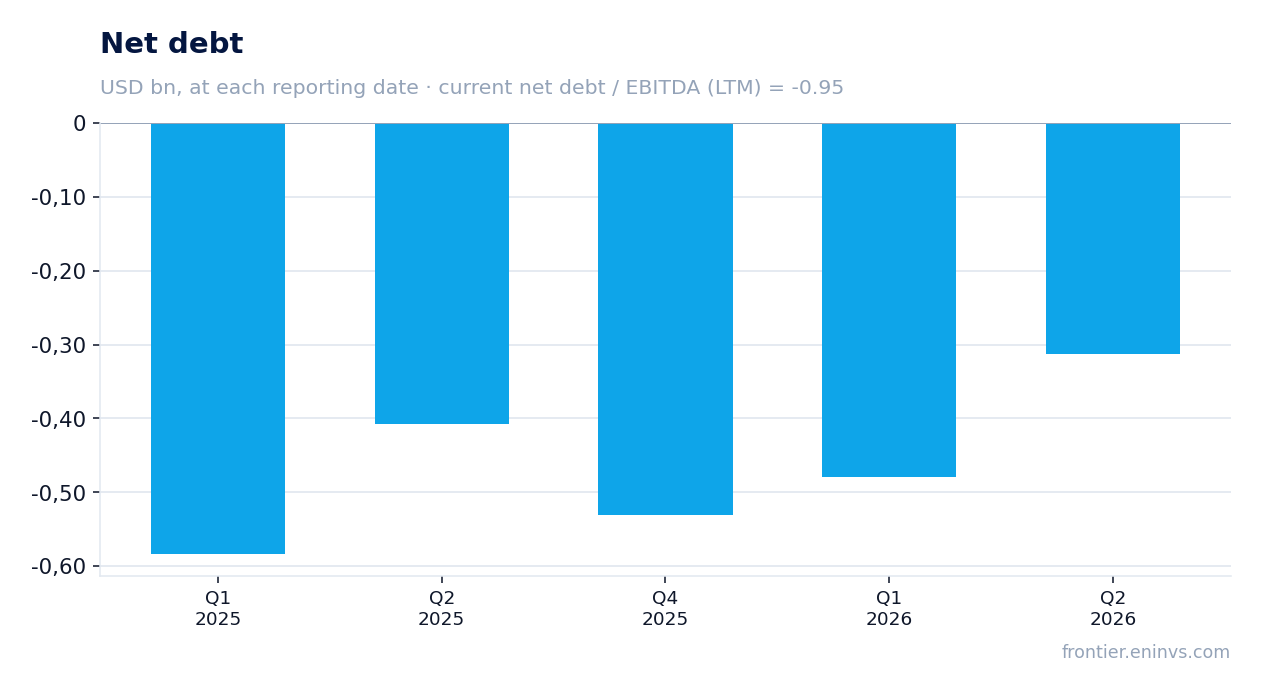
Net debt of -0.3 billion at 30 June 2026 — the company retains a net cash position, but debt rose by 0.2 billion over the quarter
Net debt at 30 June 2026 was -0.3 billion, meaning the company retains a net cash position. Compared with 31 March 2026, when net debt was -0.5 billion, the figure rose by 0.2 billion. Over the year, from 30 June 2025, net debt increased by 0.1 billion — from -0.4 billion to -0.3 billion. This means the cash cushion has shrunk slightly but remains solid.
The net debt to EBITDA ratio over the last 12 months is -0.95, reflecting a net cash position rather than debt burden. Since the earlier value of this ratio is not in the facts, one cannot claim leverage rose or fell — only state the current level. The company can cover all debt obligations with its available cash.
The rise in net debt over the quarter by 0.2 billion may be linked to seasonal factors or investments, but there is no capex data in the facts, so the cause cannot be named. Importantly, even after this increase the company remains in a net cash position, which reduces financial risks.
Operating cash flow of 103.9 million for the quarter — with no capex data, free cash flow cannot be assessed
Operating cash flow in the second quarter of 2026 was 103.9 million, up from 28.8 million a year earlier. This is significant growth, reflecting improved operations. However, there is no capex data in the facts, so it is impossible to assess how much of this flow remains after investments.
For comparison: in the first quarter of 2026 operating cash flow was 84.5 million, and in the fourth quarter of 2025 it was 133.1 million. Thus, in the second quarter the flow grew quarter on quarter but remained below the level at the end of last year. Without capex data, one cannot say whether this flow is sufficient to fund investments and dividends.
Nevertheless, the very fact of positive and growing operating cash flow is a positive signal. It confirms the company generates enough cash to cover current expenses and likely to pay dividends. But for a full assessment of free cash flow, an investor needs capex data, which the report does not provide.
Dividend yield of 2.02% over the last 12 months — modest versus the key rate, but the payout is sustainable at current profit
The dividend yield over the last 12 months is 2.02%. This is a modest level, especially against the high key rate. The company does not disclose the size of the last dividend and the period for which it was paid in the provided facts. However, with net profit of 921.4 million over the last 12 months and a market capitalisation of 3.0 billion, the current payout looks sustainable.
Our estimate for the current year's dividend assumes a conservative payout ratio that provides a yield of about 2%. This hinges on the payout ratio and the profit base; any one-off items could reduce the payout. With stable profit and no large one-off write-offs, the dividend is likely to remain at the current level or grow slightly.
The yield of 2.02% is noticeably below the key rate, making the stock less attractive for income investors. However, if the company continues to generate profit and cash flow, the dividend could be increased. What could make the payout smaller: a drop in profit, higher capex, or the need to direct funds to repay debt, although the current net cash position reduces this risk.
EV/EBITDA of 9.5 versus a three-year average of 6.7 — the stock trades above its own history, and the portal's model implies -37% to fair value
The current EV/EBITDA multiple over the last 12 months is 9.5, above the three-year average of 6.7. This means the stock trades at a premium to its historical valuation. The P/E over the last 12 months is 3.28, which looks low, but this is explained by the high profit over the last 12 months, which includes one-off effects from prior periods.
According to the portal's model, which re-prices EBITDA at current commodity prices at the target EV/EBITDA, the fair value of the share is 37% below the current market price. This is our own calculation, not a market consensus. It indicates that at current commodity prices the stock is overvalued.
Return on equity (ROE) is 10.04%, which is moderate. With a market capitalisation of 3.0 billion and a net cash position of -0.3 billion, the company looks financially sound, but the valuation is above its historical level. To change the verdict, either EBITDA needs to grow or the share price needs to fall to levels consistent with the three-year average.
Valuation on the latest reported figures
| Metric | Value |
|---|---|
| Market cap | 3.02 bn USD |
| P/E (LTM) | 3.3 |
| EV/EBITDA (LTM) | 9.5 |
| P/B | 1.18 |
| Net debt / EBITDA (LTM) | -0.95 |
| Operating cash flow (LTM) | 0.37 bn |
| ROE | 10.0% |
| Dividend yield (12m) | 2.0% |
| EV/EBITDA, 3-year average | 6.7 |
Bottom line
Bottom line: the second-quarter 2026 report looks strong — revenue of 238.3 million, EBITDA of 117.7 million, net profit of 49.1 million, EBITDA margin of 49.4%. However, a significant part of this growth is due to the low base a year earlier, not a durable improvement. The company retains a net cash position of -0.3 billion, but debt rose by 0.2 billion over the quarter. The valuation is above its historical level: EV/EBITDA of 9.5 versus the three-year average of 6.7, while the portal's model implies -37% to fair value. For a holder, the key question is whether the company can sustain its margin and profit at current levels if commodity prices do not remain favourable.
Open the company's financial profile POU →
See also: market overview · valuation map · stock screeners