Riley Exploration Permian: profit tripled, but half of it came from derivative revaluation, not production
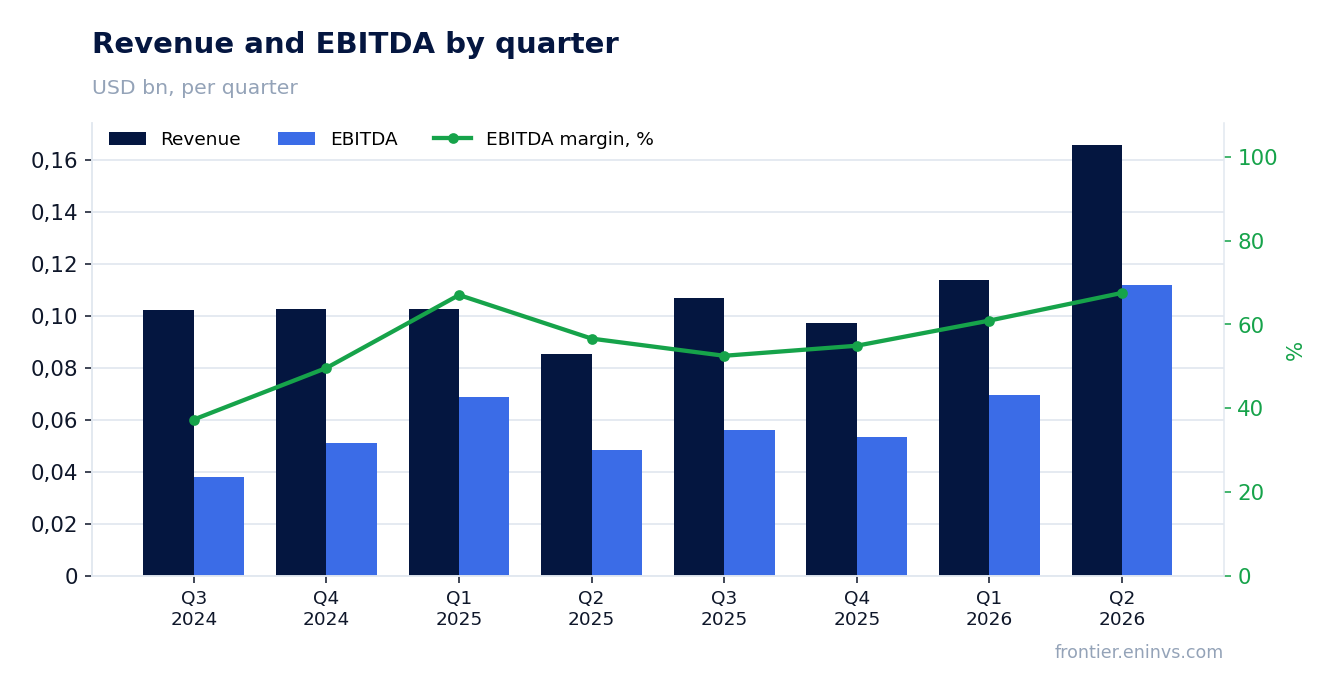
On August 5, Riley Exploration Permian released its second-quarter 2026 results. Revenue rose 94.2% year on year to $165.9 million, EBITDA – by 131.7% to $111.9 million, net profit – by 186.7% to $87.4 million. However, $69 million of the profit came from non-operating derivative revaluation gains, and free cash flow was only $6 million. The stock trades at EV/EBITDA of 4.1 with an EBITDA margin of 67.5%, and the portal model puts upside to fair value at +12% – the share looks rather attractive, with a caveat about the one-off nature of the profit.
Key takeaways
— Revenue rose 94.2% year on year, but almost all of the gain came from oil prices, not production volumes
— Two-thirds of the $87.4 million profit consists of non-operating items, not core operations
— Free cash flow was only $6 million because capital expenditures tripled
— Leverage at 0.81x LTM EBITDA is comfortable, but debt rose by $26 million in the quarter
— The $0.40 per share dividend at a $33.66 price yields 4.8% – above the key rate, but the payout exceeds free cash flow
— EV/EBITDA of 4.1 and P/E of 7.9 are cheap by historical standards, but the market has already priced in the one-off nature of the profit
— The main risk is further growth in capital expenditures and a decline in oil prices, which could wipe out free cash flow
Attractiveness
Key figures, USD bn
| Metric | Q2 2025 | Q2 2026 | Change |
|---|---|---|---|
| Revenue | 0.09 | 0.17 | +94.2% |
| EBITDA | 0.05 | 0.11 | +131.7% |
| Operating profit | 0.03 | 0.09 | +203.4% |
| Net profit | 0.03 | 0.09 | +186.7% |
| Operating cash flow | 0.03 | 0.06 | +88.8% |
| Capex | 0.03 | 0.00 | -90.9% |
| EBITDA margin | 56.6% | 67.5% | +10.9 pp |
| Net margin | 35.7% | 52.7% | +17.0 pp |
Revenue rose 94.2% year on year, but almost all of the gain came from oil prices, not production volumes
Revenue in the second quarter of 2026 was $165.9 million, up 94.2% year on year. That growth looks impressive, but it is almost entirely explained by price: the average realised oil price rose to $94.28 per barrel from $62.17 a year earlier. Oil production increased by only 40% – from 15.2 to 21.2 thousand barrels per day.
Total equivalent production rose from 24.4 to 34.3 thousand barrels of oil equivalent per day. However, part of this growth was offset by an unplanned outage at a third-party gas processing facility in New Mexico, which forced the company to temporarily shut in wells. The company estimates these shut-ins reduced production by approximately 1.9 thousand barrels per day. Without them, revenue would have been even higher.
Gas and NGL prices remained negative: the realised gas price was minus $4.12 per thousand cubic feet, NGL – minus $4.71 per barrel. This means the company pays for transportation and processing of these products. The negative effect from gas and NGL partially offset the record oil revenue.
Two-thirds of the $87.4 million profit consists of non-operating items, not core operations
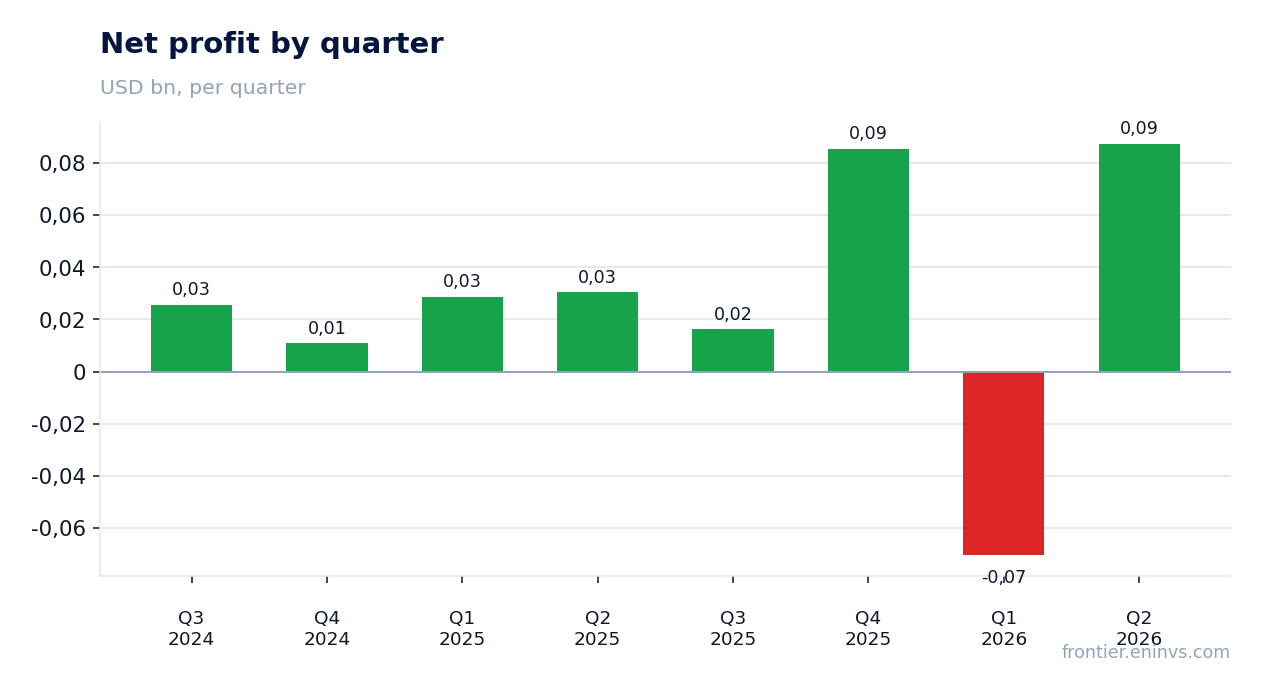
Net profit in the second quarter of 2026 was $87.4 million, or $4.11 per diluted share. However, operating profit was only $87.2 million, and net profit exceeded operating profit due to non-operating items. The key one was an unrealised gain from derivative revaluation of $69 million. This is an accounting remeasurement of open contracts that brought no cash into the company.
At the same time, the company recorded a $36 million realised loss on derivative settlements. These are real cash payments on hedges related to rising oil prices. Thus, the net effect from derivatives was a $33 million gain, but $69 million of it was non-cash revaluation, while $36 million was a real outflow.
Excluding non-operating effects, adjusted net income was $33 million, or $1.54 per share. This is less than half of the reported profit. This figure better reflects the company's actual ability to earn money in the current quarter.
Free cash flow was only $6 million because capital expenditures tripled
Operating cash flow in the second quarter of 2026 was $63.5 million, nearly double the year-earlier figure. However, capital expenditures grew much faster: accrued capital expenditures reached $86.6 million versus $22.0 million a year earlier. As a result, free cash flow was only $6.3 million.
The company is running an active drilling programme: 24 wells were drilled in the quarter, 18 completed, 15 brought online. This explains the rise in capital expenditures. In addition, the company invested $3 million in its power-focused joint venture, RPC Power.
The gap between operating cash flow and capital expenditures means the company is financing its investment programme largely through debt. Total debt increased by $26 million in the quarter. If capital expenditures continue at this pace, free cash flow will remain low, limiting the ability to pay dividends and reduce debt.
Leverage at 0.81x LTM EBITDA is comfortable, but debt rose by $26 million in the quarter
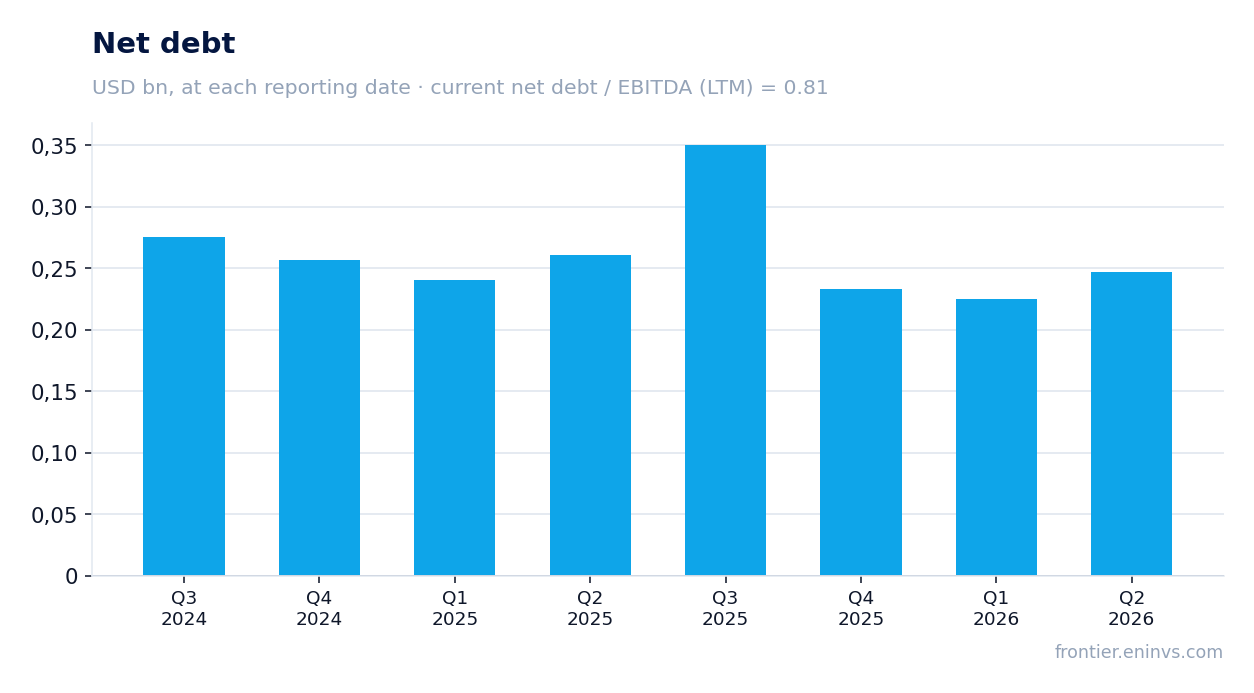
Net debt at the end of the second quarter of 2026 was $233.4 million, and the ratio of net debt to LTM EBITDA was 0.81. This is a low level for an oil and gas company, providing a margin of safety. However, total debt increased by $26 million in the quarter, including a $31 million increase on the credit facility and a $5 million repayment of senior notes.
Interest expenses remained stable: $6.8 million for the quarter, roughly the same as a year earlier. At the current cost of debt and EBITDA level, the company easily services its obligations. The debt-to-adjusted-EBITDAX ratio, according to the company, is 1.0x.
Nevertheless, debt growth amid an active investment programme is a factor to watch. If oil prices decline and capital expenditures remain high, leverage could increase. For now, it is at a comfortable level.
The $0.40 per share dividend at a $33.66 price yields 4.8% – above the key rate, but the payout exceeds free cash flow
For the second quarter of 2026, the company paid a dividend of $0.40 per share, totalling $9 million. At the share price of $33.66 before the release, the dividend yield is 4.8%. This is above the key rate, making the stock interesting for income investors.
However, free cash flow for the quarter was only $6.3 million, less than the dividends paid. The company is partly financing dividends through debt. If capital expenditures remain at current levels and oil prices do not rise, the dividend could come under pressure. Our estimate: if current oil prices and planned capital expenditures hold, the annual dividend could be around $1.60 per share, giving a yield of about 4.8%.
What could reduce the payout: further growth in capital expenditures, a decline in oil prices, or the need to direct more funds to debt reduction. The company also repurchased shares: 25 thousand shares for $1 million in the quarter. This is an additional way to return capital, but it also competes for cash flow.
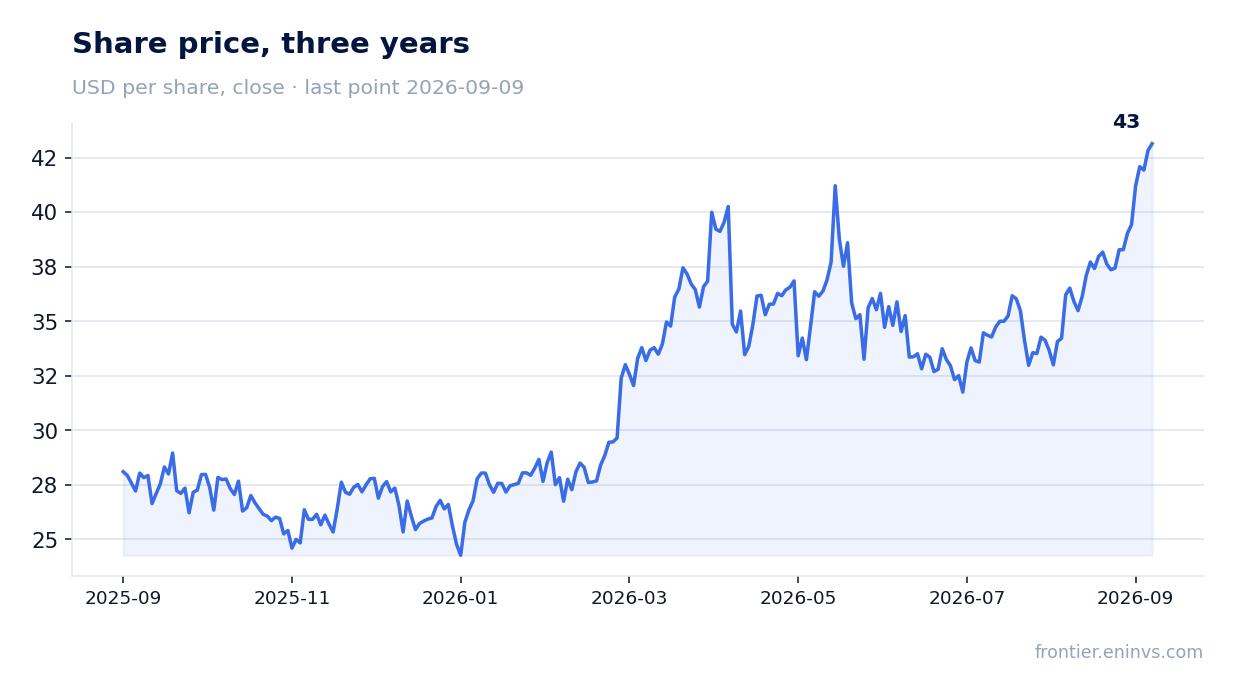
EV/EBITDA of 4.1 and P/E of 7.9 are cheap by historical standards, but the market has already priced in the one-off nature of the profit
The stock trades at EV/EBITDA of 4.1 and P/E of 7.9 based on the last twelve months. For an oil and gas company, these are low values implying a significant margin of safety. The EBITDA margin in the second quarter was 67.5% versus 56.6% a year earlier, reflecting high oil prices.
However, the last-twelve-month profit includes one-off effects, including derivative revaluation. Adjusted profit is lower, and multiples based on it would be higher. The market likely accounts for this: since the release, the stock has risen 28.2%, but on the day of the release it fell 2.0%. This suggests investors appreciated the strong operating results but are concerned about the quality of earnings.
According to the portal model, which re-prices EBITDA at current commodity prices at the target EV/EBITDA, the upside to fair value is +12%. This is a moderate but positive signal. For comparison, the three-year average EV/EBITDA is not provided in the FACTS, so we cannot say whether the current multiple is above or below its own history.
The main risk is further growth in capital expenditures and a decline in oil prices, which could wipe out free cash flow
The company raised its 2026 production guidance: oil production is expected to grow by about 30% year on year. This requires significant capital expenditures: full-year guidance is $230–242 million. If oil prices fall while costs remain high, free cash flow could turn negative.
An additional risk is the ongoing infrastructure constraints in New Mexico. The gas processing plant outage already reduced production by 1.9 thousand barrels per day. The new Targa pipeline, which should solve the problem, is expected only in the fourth quarter of 2026. Until then, further disruptions are possible.
It is also worth noting that a significant portion of profit is non-cash derivative revaluation. If oil prices change, these items could reverse and put pressure on reported profit. Investors should focus on adjusted metrics and cash flow, not net profit.
Valuation on the latest reported figures
| Metric | Value |
|---|---|
| Market cap | 0.94 bn USD |
| P/E (LTM) | 7.9 |
| EV/EBITDA (LTM) | 4.1 |
| P/B | 1.48 |
| Net debt / EBITDA (LTM) | 0.81 |
| Operating cash flow (LTM) | 0.21 bn |
| ROE | 58.9% |
Bottom line
The second-quarter 2026 report showed record revenue and EBITDA, but the quality of profit is questionable: two-thirds of net profit is non-cash derivative revaluation, and free cash flow was only $6 million. Leverage remains comfortable at 0.81x LTM EBITDA, and the 4.8% dividend yield is above the key rate. The stock trades at EV/EBITDA of 4.1, which looks cheap, but the market has already priced in the one-off nature of the profit. The portal model puts upside to fair value at +12%, making the share rather attractive for investors willing to accept the risk of falling oil prices and rising capital expenditures.
Open the company's financial profile REPX →
See also: market overview · valuation map · stock screeners