CSN: revenue up 16.1% but EBITDA down 23% – net loss widens and net debt reaches $7.7bn

CSN reported second-quarter 2026 results. Revenue rose 16.1% year on year to $2,226.5m, but EBITDA fell 23.0% to $371.6m and the net loss widened to $152.2m. The EBITDA margin compressed to 16.7% from 25.1% a year earlier. At the current price the shares look unattractive: leverage of 5.09x LTM EBITDA and a negative bottom line outweigh the top-line growth.
Key takeaways
— Revenue rose 16.1% year on year but EBITDA fell 23.0% – growth is not converting into profit
— EBITDA margin compressed to 16.7% from 25.1% a year earlier
— Net loss in Q2 2026 reached $152.2m
— Leverage reached 5.09x LTM EBITDA with net debt of $7,695.8m
— Operating cash flow over the last twelve months is negative at -$177.7m
— EV/EBITDA LTM at 6.39x – valuation does not look cheap against the losses
Attractiveness
Key figures, USD bn
| Metric | Q2 2025 | Q2 2026 | Change |
|---|---|---|---|
| Revenue | 1.92 | 2.23 | +16.1% |
| EBITDA | 0.48 | 0.37 | -23.0% |
| Operating profit | 0.29 | 0.15 | -48.9% |
| Net profit | -0.02 | -0.15 | — |
| Operating cash flow | -0.04 | 0.02 | to profit |
| Capex | 0.24 | 0.27 | +13.7% |
| EBITDA margin | 25.1% | 16.7% | -8.4 pp |
| Net margin | -1.2% | -6.8% | -5.6 pp |
Revenue rose 16.1% year on year but EBITDA fell 23.0% – growth is not converting into profit
In Q2 2026, CSN revenue reached $2,226.5m, up 16.1% year on year. This is an acceleration from 8.9% growth in Q1 2026. However, EBITDA for the same period fell 23.0% to $371.6m.
Falling EBITDA amid rising revenue means costs are growing faster than income. The EBITDA margin in Q2 2026 was 16.7% versus 25.1% a year earlier. That is a compression of 8.4 percentage points.
The net loss in Q2 2026 was $152.2m versus a loss of $23.4m a year earlier. The negative net margin widened to -6.8% from -1.2%.
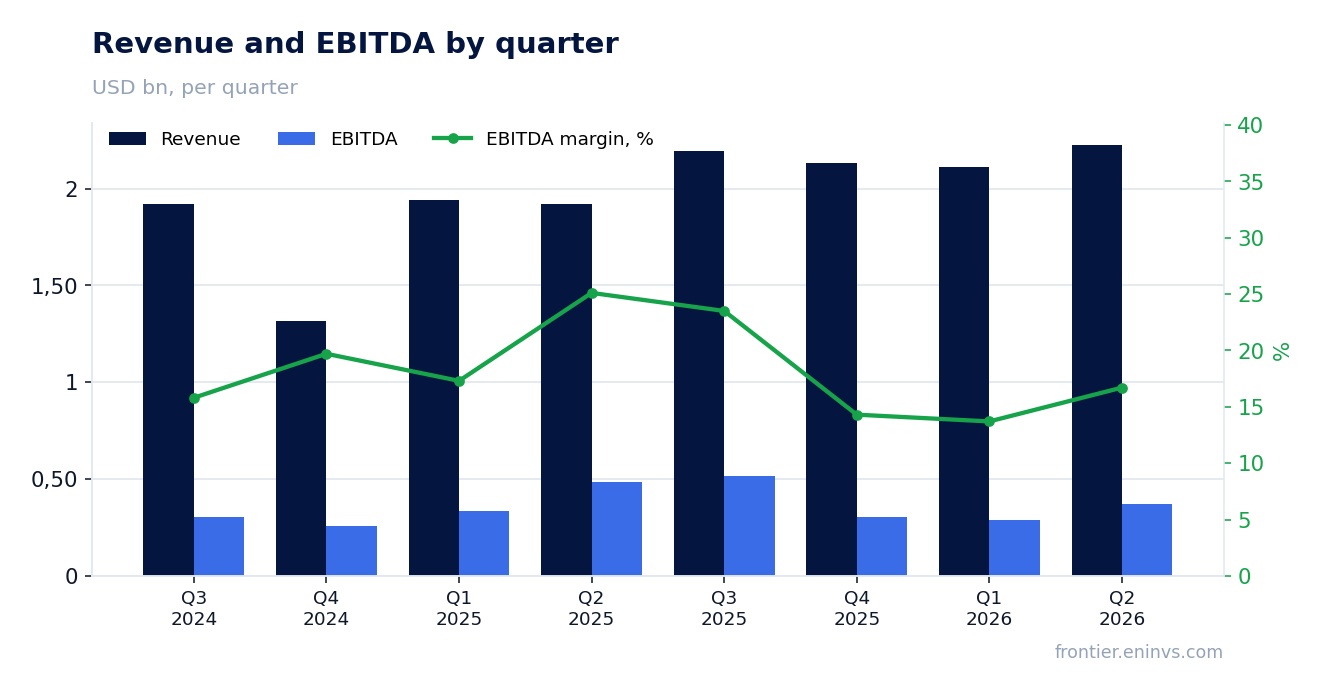
EBITDA margin compressed to 16.7% from 25.1% a year earlier
The compression of the EBITDA margin to 16.7% in Q2 2026 from 25.1% a year earlier is the key negative of the report. This is the lowest level in at least several quarters.
Operating profit in Q2 2026 was $150.6m versus $294.6m a year earlier. The decline in operating profit despite revenue growth points to faster growth in operating expenses.
The company does not provide a breakdown of cost items in the available data, so it is impossible to say exactly which line caused this pressure on the margin. But the fact remains: profitability has fallen significantly.
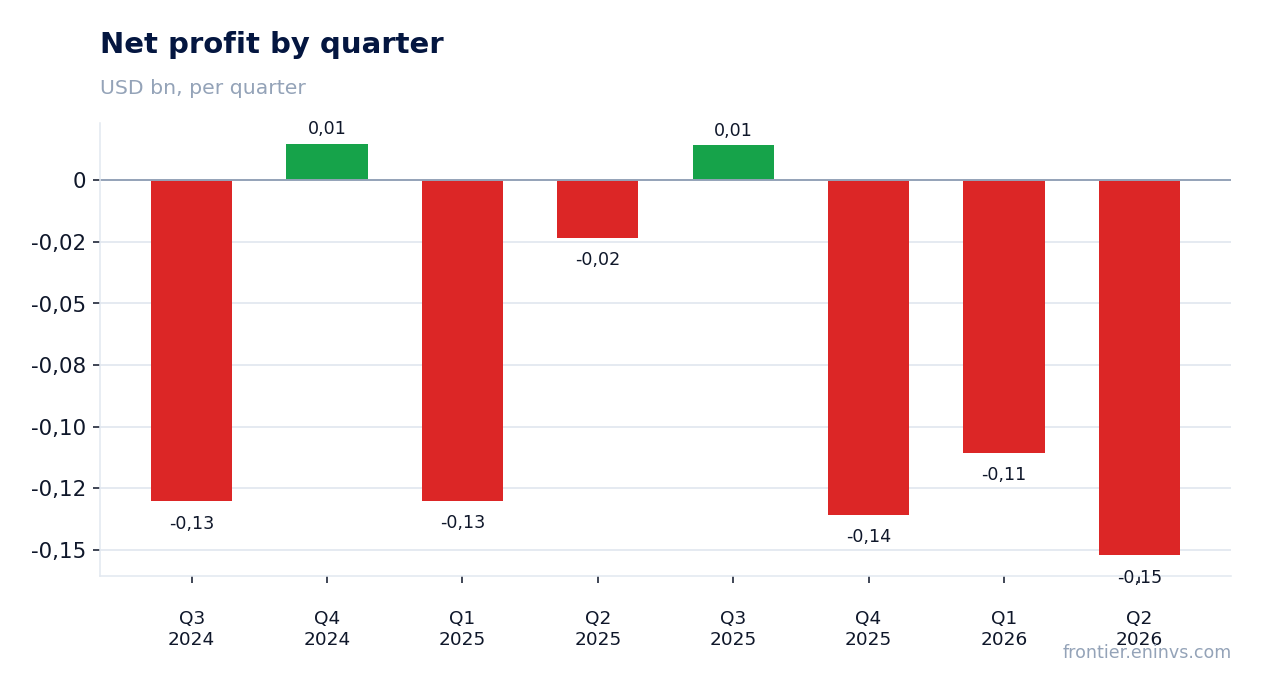
Net loss in Q2 2026 reached $152.2m
CSN's net loss in Q2 2026 was $152.2m, significantly larger than the $23.4m loss a year earlier. The negative net margin widened to -6.8% from -1.2%.
The loss was formed amid negative operating profit and likely under pressure from financial expenses related to high debt. The company does not disclose details, but the scale of the loss is substantial.
Over the last twelve months, the net loss also remains significant. This limits the company's ability to pay dividends and reduces its investment appeal.
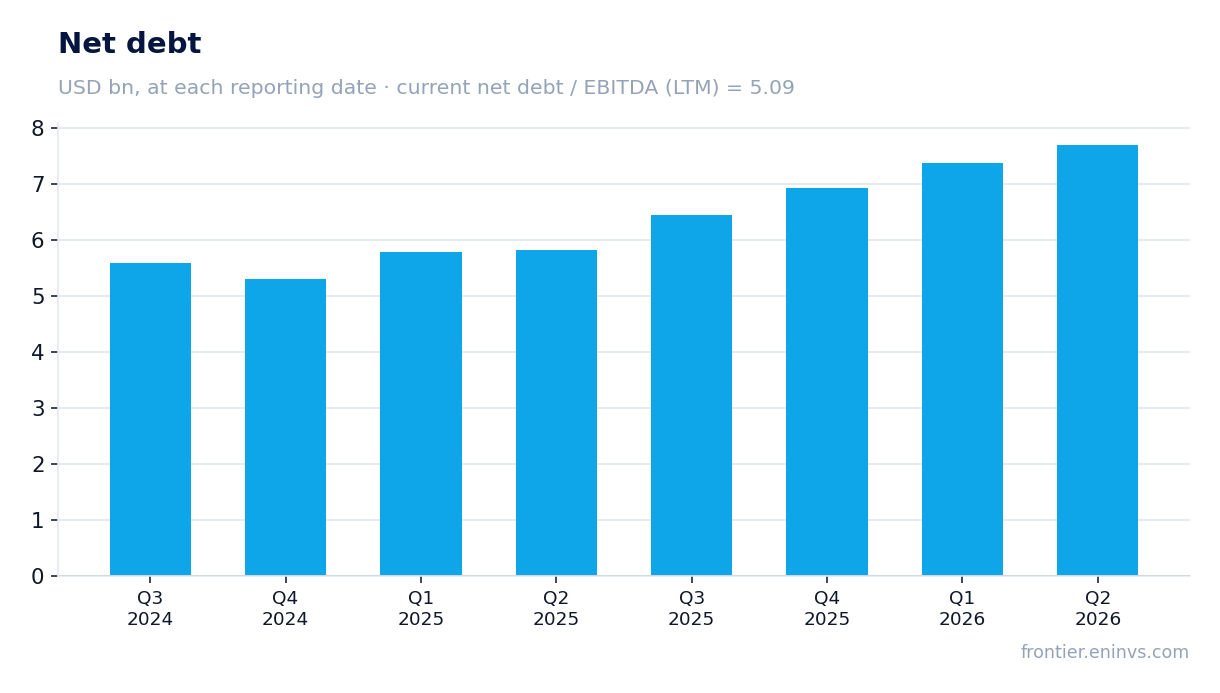
Leverage reached 5.09x LTM EBITDA with net debt of $7,695.8m
CSN's net debt at the end of Q2 2026 was $7,695.8m, up $0.3bn from the previous reporting date and up $1.9bn from a year earlier. The net debt / LTM EBITDA ratio reached 5.09x.
This level of leverage is high and limits the company's financial flexibility. At the current EBITDA, debt servicing requires significant funds.
The increase in net debt occurred against the backdrop of negative operating cash flow over the last twelve months, which exacerbates the situation.
Operating cash flow over the last twelve months is negative at -$177.7m
CSN's operating cash flow over the last twelve months was -$177.7m. This means the company does not generate enough funds from core operations to cover its investments and debt servicing.
In Q2 2026, operating cash flow was positive at $20.8m, but this is not enough to offset the outflow in previous quarters.
Negative operating cash flow combined with high debt creates risks for the company's financial stability.
EV/EBITDA LTM at 6.39x – valuation does not look cheap against the losses
CSN's EV/EBITDA LTM is 6.39x. This is a moderate level, but it does not account for the negative net profit and high debt burden.
The company's market capitalisation is $1,763.7m. With net debt of $7,695.8m, EV is significantly higher than market cap, reflecting the high debt.
Return on equity (ROE) is negative at -19.7%. This confirms that the current valuation does not compensate for the losses.
Valuation on the latest reported figures
| Metric | Value |
|---|---|
| Market cap | 1.76 bn USD |
| EV/EBITDA (LTM) | 6.4 |
| P/B | 0.61 |
| Net debt / EBITDA (LTM) | 5.09 |
| Operating cash flow (LTM) | -0.18 bn |
| ROE | -19.7% |
Bottom line
CSN's revenue grew 16.1% year on year, but EBITDA fell 23.0% and the net loss widened to $152.2m. The EBITDA margin compressed to 16.7% from 25.1%. Leverage reached 5.09x LTM EBITDA with net debt of $7,695.8m, and operating cash flow over the last twelve months is negative. At the current price the shares look unattractive: revenue growth is not converting into profit, and the financial position remains strained.
Open the company's financial profile SID →
See also: market overview · valuation map · stock screeners