Steel Dynamics: record steel shipments and aluminum nearing breakeven, but valuation has run ahead
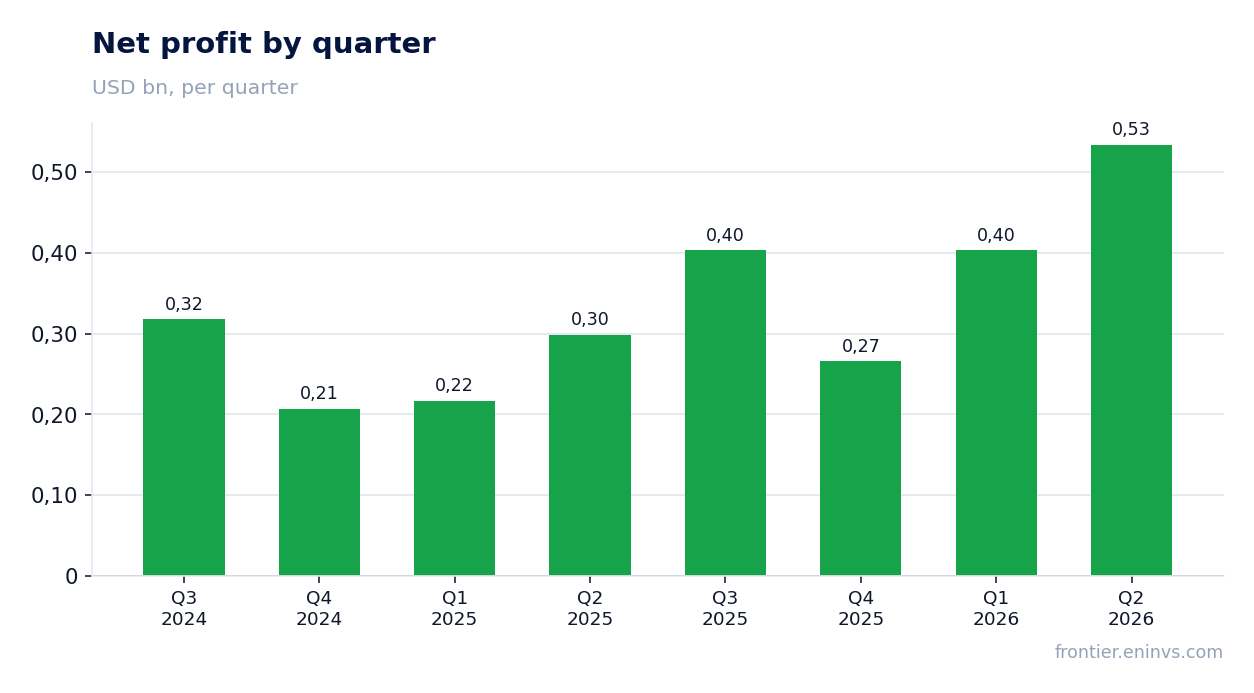
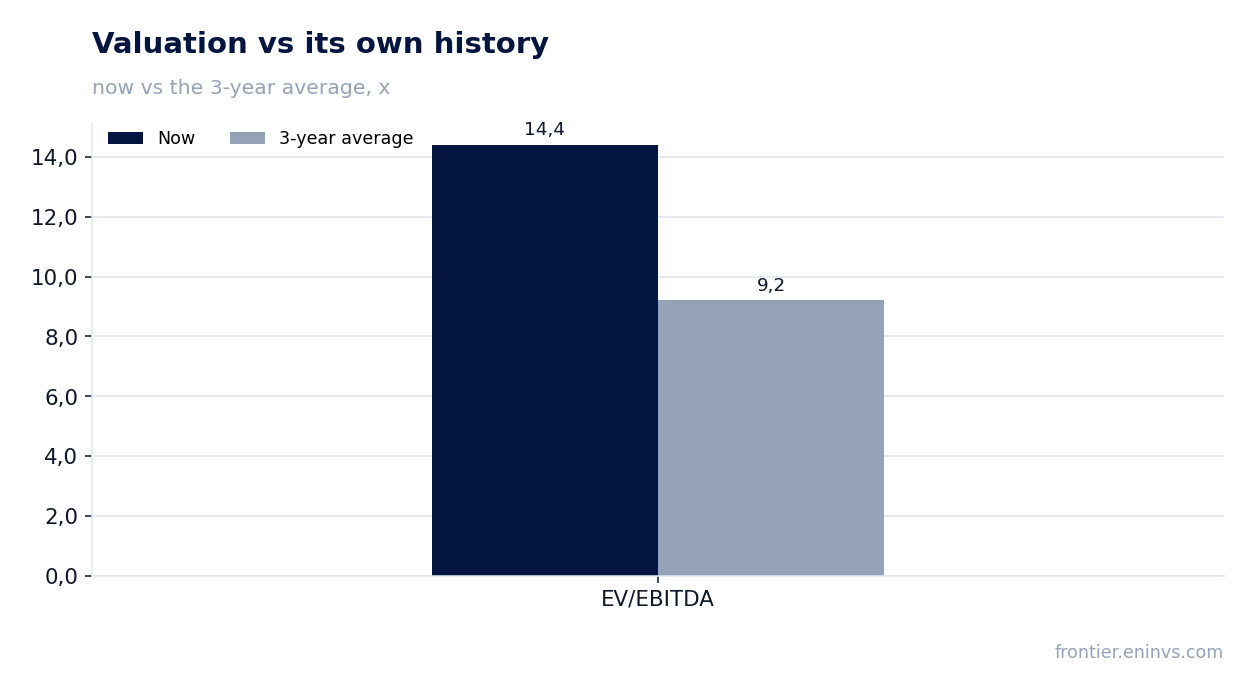
On July 21, 2026, Steel Dynamics reported Q2 2026 results: revenue grew 33.4% YoY to $6.1 billion, net profit rose 78.8% to $534 million. Growth was driven by record steel shipments and spread expansion, while the aluminum segment nearly halved its losses. At the current price, the share looks rather unattractive: EV/EBITDA is almost 1.6 times above its own three-year average, and the portal's model points to downside potential.
Key takeaways
— Q2 revenue grew by a third thanks to record steel shipments and a $105 per ton price increase
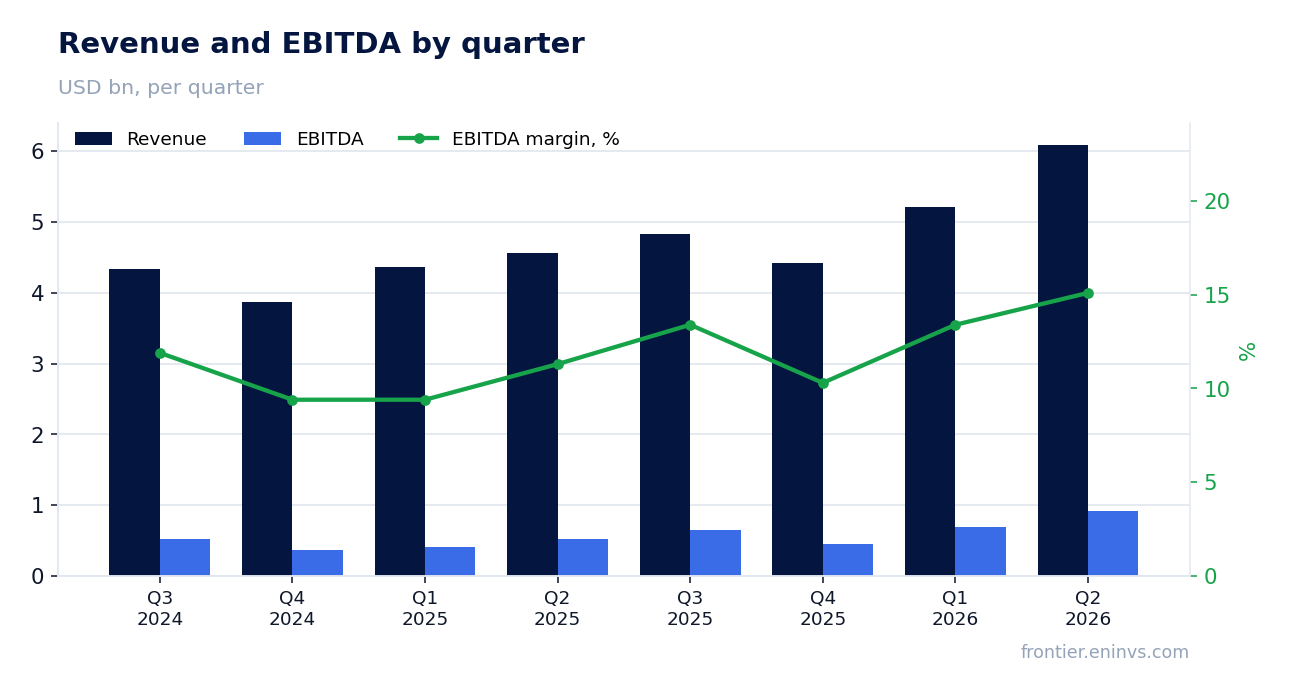
— EBITDA margin expanded to 15.1% from 11.3% a year earlier as prices rose faster than scrap costs
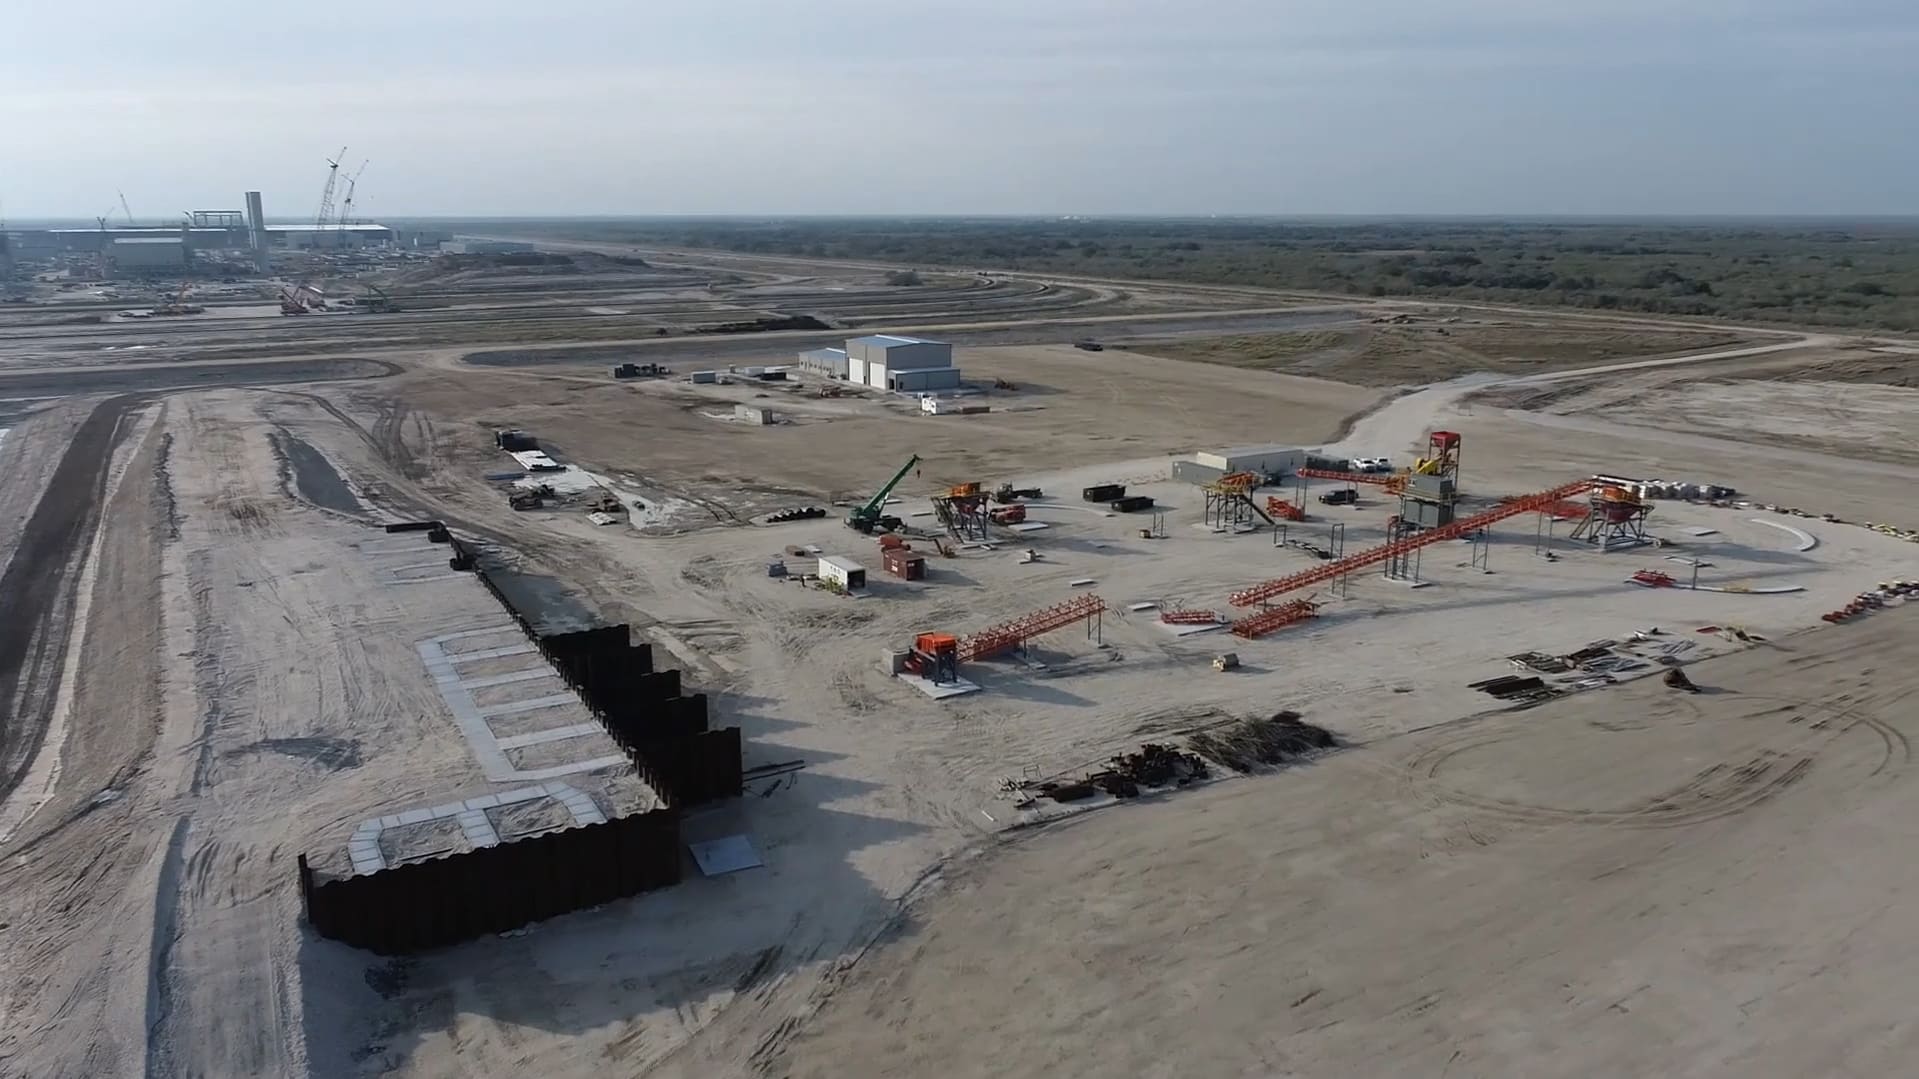
— The aluminum segment cut its operating loss by 48% and is preparing for commercial automotive sales
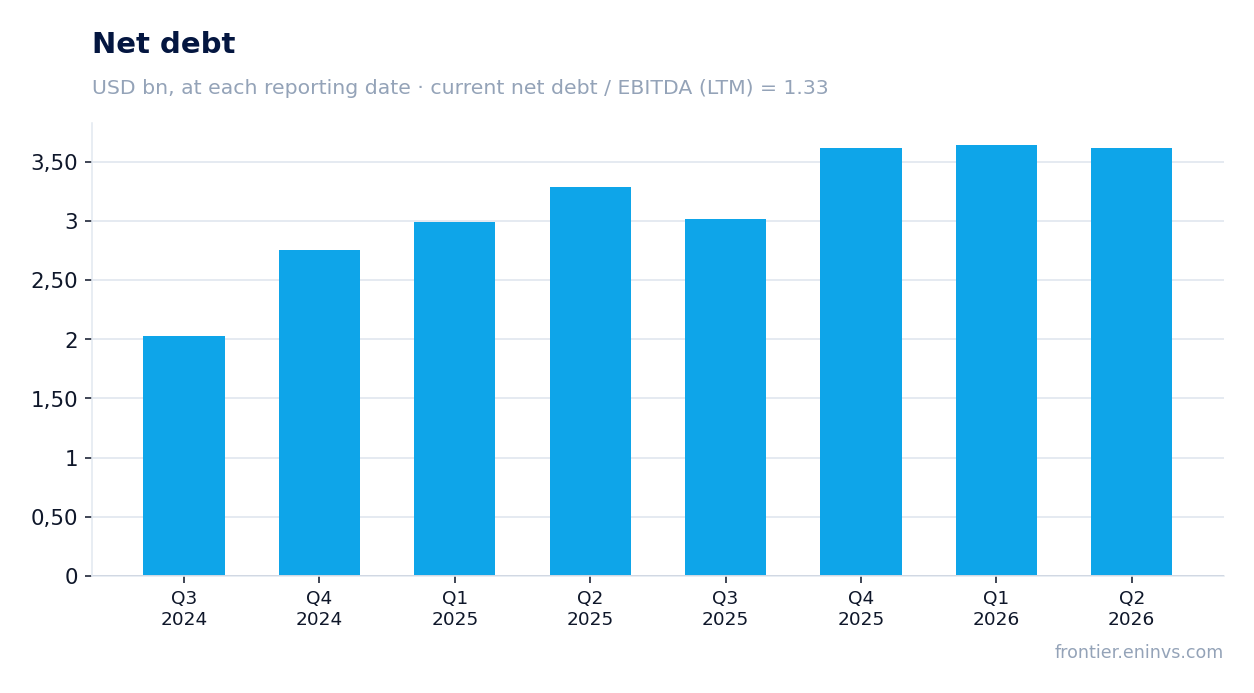
— Leverage stands at 1.33 EBITDA, with net debt up $0.3 billion over the year
— Capex is declining, and the dividend for H1 amounted to $1.06 per share
— The share trades 1.6 times above its three-year EV/EBITDA average, and the portal's model implies 55% downside
Attractiveness
Key figures, USD bn
| Metric | Q2 2025 | Q2 2026 | Change |
|---|---|---|---|
| Revenue | 4.57 | 6.09 | +33.4% |
| EBITDA | 0.52 | 0.92 | +78.5% |
| Operating profit | 0.38 | 0.70 | +83.0% |
| Net profit | 0.30 | 0.53 | +78.8% |
| Operating cash flow | 0.30 | 0.43 | +41.9% |
| Capex | 0.29 | 0.12 | -57.1% |
| EBITDA margin | 11.3% | 15.1% | +3.8 pp |
| Net margin | 6.5% | 8.8% | +2.3 pp |
Q2 revenue grew by a third thanks to record steel shipments and a $105 per ton price increase
In Q2 2026, Steel Dynamics' revenue reached $6.1 billion, up 33.4% YoY. The company shipped a record 3.7 million tons of steel, and the average selling price rose $105 per ton sequentially to $1,298.
Demand was supported by the energy sector, non-residential construction, automotive, and agricultural industries. Orders for steel joists are nearly 45% higher than a year ago and extend into Q1 2027. Price increases outpaced scrap cost inflation: melting costs rose only $16 per ton sequentially.
EBITDA margin expanded to 15.1% from 11.3% a year earlier as prices rose faster than scrap costs
EBITDA for the quarter grew 78.5% YoY to $920.5 million, with EBITDA margin reaching 15.1% versus 11.3% in Q2 2025. Net margin rose to 8.8% from 6.5%.
The steel segment was the main contributor: operating income reached $721 million, up 30% sequentially. Fabrication and metals recycling remained roughly flat, while aluminum narrowed its loss.
The aluminum segment cut its operating loss by 48% and is preparing for commercial automotive sales
The aluminum segment's operating loss in Q2 was $33 million, 48% lower than in Q1. Flat-rolled sheet shipments rose to 53,000 metric tons, and hot band production to 84,000 tons.
The company has qualified to supply automotive products and expects sales to begin before the end of 2026. The third and final cold mill was commissioned in July, enabling full capacity of 650,000 metric tons per year. Management expects volumes and profitability to increase sharply in H2 2026 and through 2027.
Leverage stands at 1.33 EBITDA, with net debt up $0.3 billion over the year
As of end-June 2026, Steel Dynamics' net debt stood at $3.6 billion, equivalent to 1.33 EBITDA over the trailing twelve months. Net debt increased by $0.3 billion over the year.
Interest expense in Q2 rose to $39 million from $17 million a year earlier, but operating cash flow of $428 million covers it with a wide margin. Liquidity stands at $2.0 billion.
Capex is declining, and the dividend for H1 amounted to $1.06 per share
Capex in Q2 was $124 million, well below the $288 million a year earlier when the company was heavily building its aluminum plant. In H1, capex declined to $262 million from $594 million in the same period of 2025.
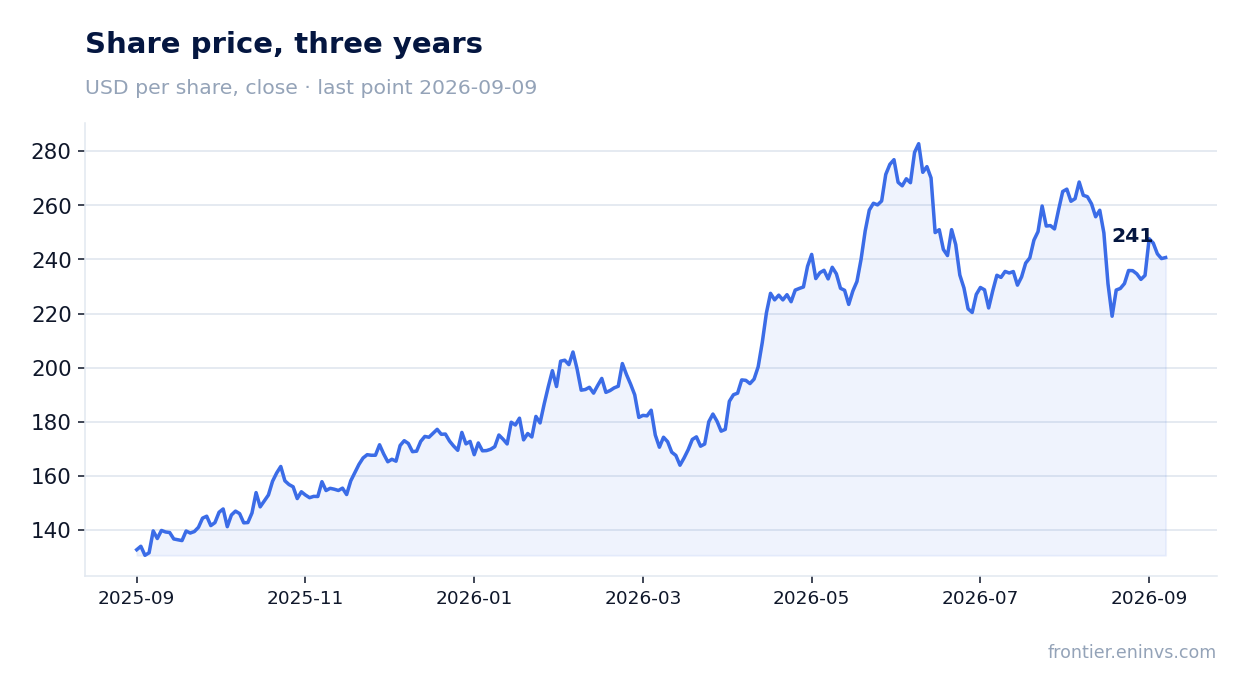
The company paid dividends of $0.53 per share for the quarter, or $1.06 for H1. At the current price, the trailing twelve-month dividend yield is 0.86%. Payments are backed by strong cash flow: operating cash flow for H1 was $576 million, more than twice covering dividends and capex combined.
The share trades 1.6 times above its three-year EV/EBITDA average, and the portal's model implies 55% downside
The current EV/EBITDA multiple is 14.4 versus the three-year average of 9.2. Thus, the share trades at a premium of about 1.6 times to its own history. P/E over the trailing twelve months is 22.1.
According to the portal's model, which re-prices EBITDA at current commodity prices and applies a target EV/EBITDA, the share's downside potential is -55% from the current market cap. This implies the market has already priced in a significant improvement in conditions, and justifying such a valuation would require sustained steel price increases and a successful aluminum ramp-up.
Valuation on the latest reported figures
| Metric | Value |
|---|---|
| Market cap | 35.6 bn USD |
| P/E (LTM) | 22.1 |
| EV/EBITDA (LTM) | 14.4 |
| P/B | 3.97 |
| Net debt / EBITDA (LTM) | 1.33 |
| Operating cash flow (LTM) | 1.40 bn |
| ROE | 23.0% |
| Dividend yield (12m) | 0.9% |
| EV/EBITDA, 3-year average | 9.2 |
Bottom line
The report is strong: record shipments, margin expansion, and a rapid reduction in aluminum losses confirm that operational momentum persists. Cash flow covers both dividends and declining capex, and leverage is moderate. However, the key question for a holder is valuation: the share trades well above its own history, and the portal's model points to significant downside. The verdict is rather unattractive: to justify the current price, the company needs not only to sustain high steel prices but also to bring aluminum to profitability quickly.
Open the company's financial profile STLD →
See also: market overview · valuation map · stock screeners